International
Key Events This Week: Here Come Payrolls
Key Events This Week: Here Come Payrolls
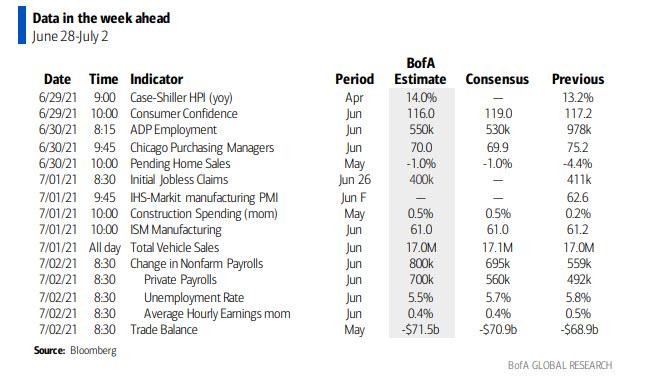
The first half of this week will be quiet before the tempo picks up substantially with Thursday’s ISM print and Friday’s Non-Farm Payrolls which consensus expects to print at 675k on Friday up from…
Share this:

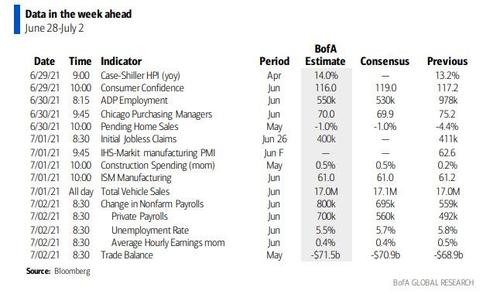
The first half of this week will be quiet before the tempo picks up substantially with Thursday's ISM print and Friday's Non-Farm Payrolls which consensus expects to print at 675k on Friday up from previous 559k, if well below where the number has to be for the labor market to normalize by end 2021. Then, one week from Tuesday, Q2 earnings season begins.
In terms of what to expect from payrolls, Deutsche Bank economists are forecasting a +700k increase in nonfarm payrolls following May’s +559k reading, which in turn should send the unemployment rate to a post-pandemic low of 5.7%. That said, even with a +700k increase, the total number of nonfarm payrolls would still be - 6.9m beneath its level in February 2020. Ahead of payrolls, the jobs plentiful / jobs hard-to-get series within tomorrow's June consumer confidence release will be interesting as it has been been highly correlated with the unemployment rate. Wednesday's ADP employment survey (+550k consensus vs. +978k) will also be watched even if has been well above payrolls of late.
The jobs data has been the one clear soft spot in US economic data points that has given Powell reason to hold the line despite a number of hawkish FOMC speeches last week and elevated inflation figures. Although one report wont severely alter the Chair's t,ming, we see a good number as further confirmation that we remain on track for policy hints to be dropped at the Jackson Hole meeting come late August.
We also get the US ISM report (Thurs) and consumer confidence (Tues). Both should hold at firm levels with the former again highlighting the supply chain strains that are putting up costs and boosting the chances that inflation stays higher for (much) longer (as long as 4 years according to BofA).
June ISM is expected to come in at 61.0, little changed from the May reading of 61.2 and continuing to signal broad-based growth in activity. Demand for manufactured goods remains elevated with the new orders index climbing to 67.0 from 64.3 in May. New orders are expected to remain strong in June. This along with the strong reading in May should support some growth in the production index, which has fallen by 9.6 points over the past two months reflecting the effects of the supply chain shortages. Meanwhile, the supplier deliveries index, which increases when delivery times are slower, should remain elevated and could very well increase given the recent shutdowns in ports in China. This could lead to inventories falling below the breakeven level (50.0) again. Demand for goods remains strong which should support hiring activity. Moreover, the industry generally offers higher paying jobs that should not be as susceptible to disincentives from the generous unemployment insurance benefits. That said, lack of goods inputs may limit employment gains. Meanwhile, the prices index will remain at historically elevated levels reflecting the ongoing demand supply imbalance, rising oil prices, and high shipping costs.
Conference Board confidence is expected to decrease moderately to 116.0 from 117.2 previously. In May, the Present Situation Index, which measures consumers’ assessment of current business and labor market conditions, rose to 144.3 from 131.9. However, the Expectations Index, which captures consumers’ short term views for income, business, and labor market conditions, decreased to 99.1 from 107.9. Although stronger economic growth is expected this year, consumers still remain concerned about COVID and higher inflation.
Elsewhere, OPEC+ holds their latest monthly meeting on Thursday. Sources suggested the group is mulling a further easing of curbs, although the specifics have not yet been ironed out, reports suggested a curb-easing of 500kBPD. Look out for more sources in coming days.
We also get the June auto sales number on July 2, which is expected to come in flat compared with the prior month at 17mn SAAR. Auto demand is running way ahead of traditional economic indicators such as the unemployment rate and consumer confidence, but supply side constraints will limit the sales upside in the near term.
Here is Goldman with a focus on key US events: The key economic data releases this week are the ISM manufacturing index on Thursday and employment report on Friday. There are several speaking engagements from Fed officials this week, including from President Williams on Monday.
Monday, June 28
- 09:00 AM New York Fed President Williams (FOMC voter) speaks: New York Fed President John Williams will participate in a virtual panel discussion hosted by the Bank for International Settlements. Prepared text and moderated Q&A are expected.
- 10:30 AM Dallas Fed manufacturing index, June (consensus 32.5, last 34.9)
- 12:00 PM Richmond Fed President Barkin (FOMC voter) speaks: Richmond Fed President Thomas Barkin will discuss inflation risk at an event hosted by the Rotary Club of Atlanta.
- 01:10 PM Fed Vice Chair for Supervision Quarles (FOMC voter) speaks: Fed Vice Chair for Supervision Randal Quarles will discuss central bank digital currencies at an event hosted by the Utah Bankers Association. Prepared text and moderated Q&A are expected.
Tuesday, June 29
- 09:00 AM FHFA house price index, April (consensus +1.6%, last +1.4%)
- 09:00 AM S&P/Case-Shiller 20-city home price index, April (GS +1.8%, consensus +1.80%, last +1.60%): We estimate the S&P/Case-Shiller 20-city home price index rose by 1.8% in April, following a 1.60% increase in March.
- 09:00 AM Richmond Fed President Barkin (FOMC voter) speaks: Richmond Fed President Thomas Barkin will participate in a virtual event hosted by MNI.
- 10:00 AM Conference Board consumer confidence, June (GS 117.0 consensus 119.0, last 117.2): We estimate that the Conference Board consumer confidence index edged down by 0.2pt to 117.0 in June. Our forecast reflects weaker signals from other consumer confidence measures.
Wednesday, June 30
- 08:00 AM Atlanta Fed President Bostic (FOMC voter) speaks: Atlanta Fed President Raphael Bostic will discuss regionalism at an event hosted by the Buckhead Coalition. Audience Q&A is expected.
- 08:15 AM ADP employment report, June (GS +600k, consensus +550k, last +978k): We expect a 600k rise in ADP payroll employment for the month of June, following a 978k rise in May. The decline in initial jobless claims should provide a technical boost to the ADP model.
- 09:45 AM Chicago PMI, June (GS 71.0, consensus 70.0, last 75.2): We estimate that the Chicago PMI pulled back by 4.2pt to 71.0 in June, reflecting mean reversion in several subcomponents that saw outsized jumps in the prior month but continued upward support from slow supplier deliveries.
- 10:00 AM Pending home sales, May (GS flat, consensus -1.0%, last -4.4%): We estimate that pending home sales were flat in May, reflecting mixed regional home sales data.
- 01:00 PM Richmond Fed President Barkin (FOMC voter) speaks: Richmond Fed President Thomas Barkin will participate in an event hosted by the Northern Virginia Hispanic American Chamber of Commerce.
Thursday, July 1
- 08:30 AM Initial jobless claims, week ended June 26 (GS 385k, consensus 389k, last 411k); Continuing jobless claims, week ended June 19 (consensus 3,328k, last 3,390k); We estimate initial jobless claims decreased to 385k in the week ended June 26.
- 09:45 AM Markit manufacturing PMI, June final (consensus 62.6, last 62.6)
- 10:00 AM ISM manufacturing index, June (GS 60.0, consensus 61.0, last 61.2): We estimate that the ISM manufacturing index declined 1.2pt to 60.0 in June, reflecting moderation from elevated levels in some components. Our manufacturing tracker edged up 0.1pt to 58.5.
- 10:00 AM Construction spending, May (GS +0.3%, consensus +0.4%, last +0.2%): We estimate a 0.3% increase in construction spending in May.
- 02:00 PM Atlanta Fed President Bostic (FOMC voter) speaks: Atlanta Fed President Raphael Bostic will participate in a panel discussion hosted by Habitat for Humanity. Audience Q&A is expected.
- 05:00 PM Lightweight motor vehicle sales, June (GS 16.0m, consensus 17.0m, last 17.0m)
Friday, July 2
- 08:30 AM Nonfarm payroll employment, June (GS +750k, consensus +700k, last +559k); Private payroll employment, June (GS +675k, consensus +600k, last +492k); Average hourly earnings (mom), June (GS +0.4%, consensus +0.3%, last +0.5%); Average hourly earnings (yoy), June (GS +3.8%, consensus +3.6%, last +2.0%); Unemployment rate, June (GS 5.6%, consensus 5.7%, last 5.8%): We estimate nonfarm payrolls rose 750k in June (mom sa). Our forecast reflects a sequential easing of labor supply constraints due to the arrival of the youth summer labor force (+1.8mn in a typical June) and the wind-down of federal unemployment top-ups in some states. Coupled with very strong labor demand and continued progress on vaccinations and reopening, we believe job growth probably picked up further in the month. And while big data measures were mixed, continuing jobless claims declined significantly in states that are ending UI top-ups early (-200k relative to the trend in all other states). More generally, fewer education-sector workers reduces scope for end-of-school-year layoffs.
- We estimate a two-tenths drop in the unemployment rate to 5.6%, reflecting a strong household employment gain but a further rise in the participation rate. We estimate a 0.4% rise in average hourly earnings (mom sa), reflecting continued labor shortages partially offset by negative calendar effects. Coupled with last spring’s waning composition effects, this would result in a further rise in the year-on-year rate (from +2.0% to +3.8%).
- 08:30 AM Trade Balance, May (GS -$72.0bn, consensus -$71.3bn, last -$68.9bn): We estimate that the trade deficit increased by $3.1bn to $72.0bn in May, reflecting an increase in imports and decrease in exports in the advance goods report.
- 10:00 AM Factory orders, May (GS +1.6%, consensus +1.5%, last -0.6%); Durable goods orders, May final (last +2.3%); Durable goods orders ex-transportation, May final (last +0.3%); Core capital goods orders, May final (last -0.1%); Core capital goods shipments, May final (last +0.9%): We estimate that factory orders increased by 1.6% in May following a 0.6% decline in April. Durable goods orders increased by 2.3% in the May advance report, but core capital goods orders declined by 0.1%.
Source: BofA, Goldman
International
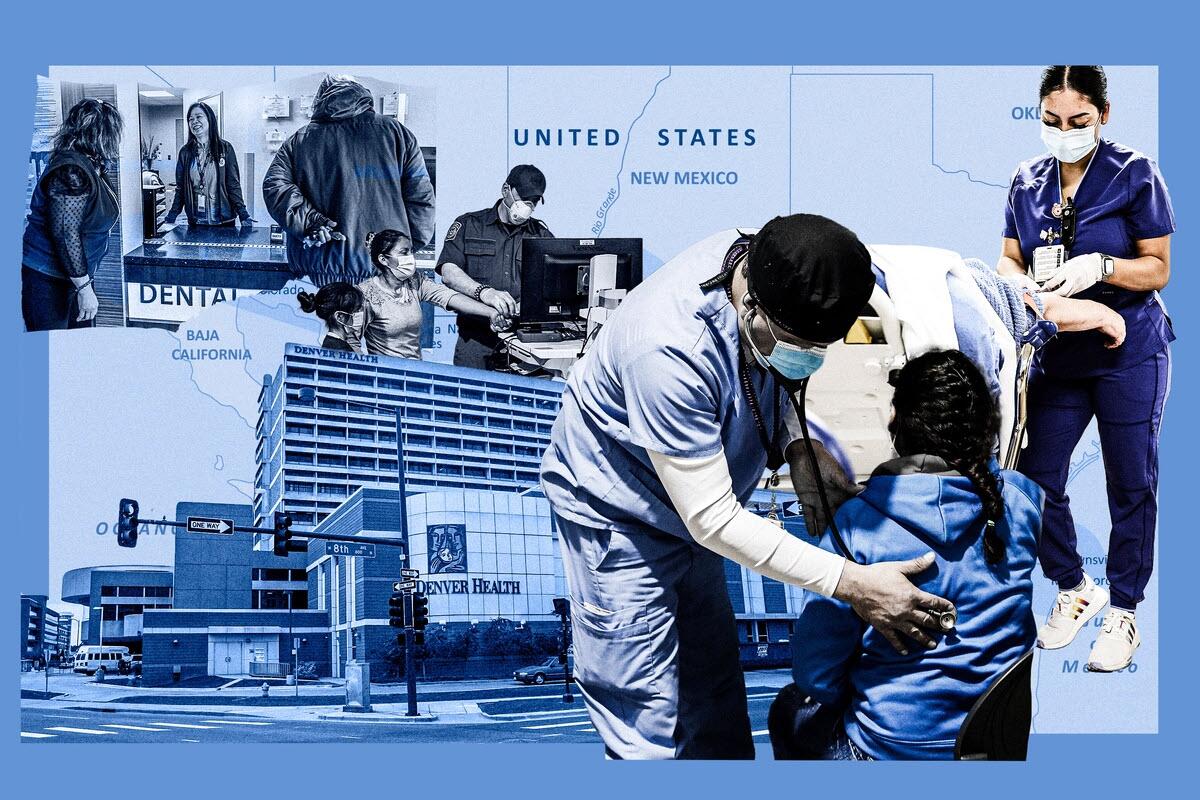
Illegal Immigrants Leave US Hospitals With Billions In Unpaid Bills
Illegal Immigrants Leave US Hospitals With Billions In Unpaid Bills
By Autumn Spredemann of The Epoch Times
Tens of thousands of illegal…
Share this:

By Autumn Spredemann of The Epoch Times
Tens of thousands of illegal immigrants are flooding into U.S. hospitals for treatment and leaving billions in uncompensated health care costs in their wake.
The House Committee on Homeland Security recently released a report illustrating that from the estimated $451 billion in annual costs stemming from the U.S. border crisis, a significant portion is going to health care for illegal immigrants.
With the majority of the illegal immigrant population lacking any kind of medical insurance, hospitals and government welfare programs such as Medicaid are feeling the weight of these unanticipated costs.
Apprehensions of illegal immigrants at the U.S. border have jumped 48 percent since the record in fiscal year 2021 and nearly tripled since fiscal year 2019, according to Customs and Border Protection data.
Last year broke a new record high for illegal border crossings, surpassing more than 3.2 million apprehensions.
And with that sea of humanity comes the need for health care and, in most cases, the inability to pay for it.
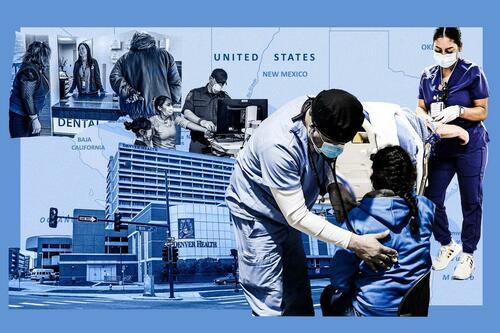
In January, CEO of Denver Health Donna Lynne told reporters that 8,000 illegal immigrants made roughly 20,000 visits to the city’s health system in 2023.
The total bill for uncompensated care costs last year to the system totaled $140 million, said Dane Roper, public information officer for Denver Health. More than $10 million of it was attributed to “care for new immigrants,” he told The Epoch Times.
Though the amount of debt assigned to illegal immigrants is a fraction of the total, uncompensated care costs in the Denver Health system have risen dramatically over the past few years.
The total uncompensated costs in 2020 came to $60 million, Mr. Roper said. In 2022, the number doubled, hitting $120 million.
He also said their city hospitals are treating issues such as “respiratory illnesses, GI [gastro-intenstinal] illnesses, dental disease, and some common chronic illnesses such as asthma and diabetes.”
“The perspective we’ve been trying to emphasize all along is that providing healthcare services for an influx of new immigrants who are unable to pay for their care is adding additional strain to an already significant uncompensated care burden,” Mr. Roper said.
He added this is why a local, state, and federal response to the needs of the new illegal immigrant population is “so important.”
Colorado is far from the only state struggling with a trail of unpaid hospital bills.
Dr. Robert Trenschel, CEO of the Yuma Regional Medical Center situated on the Arizona–Mexico border, said on average, illegal immigrants cost up to three times more in human resources to resolve their cases and provide a safe discharge.
“Some [illegal] migrants come with minor ailments, but many of them come in with significant disease,” Dr. Trenschel said during a congressional hearing last year.
“We’ve had migrant patients on dialysis, cardiac catheterization, and in need of heart surgery. Many are very sick.”
He said many illegal immigrants who enter the country and need medical assistance end up staying in the ICU ward for 60 days or more.
A large portion of the patients are pregnant women who’ve had little to no prenatal treatment. This has resulted in an increase in babies being born that require neonatal care for 30 days or longer.
Dr. Trenschel told The Epoch Times last year that illegal immigrants were overrunning healthcare services in his town, leaving the hospital with $26 million in unpaid medical bills in just 12 months.
ER Duty to Care
The Emergency Medical Treatment and Labor Act of 1986 requires that public hospitals participating in Medicare “must medically screen all persons seeking emergency care … regardless of payment method or insurance status.”
The numbers are difficult to gauge as the policy position of the Centers for Medicare & Medicaid Services (CMS) is that it “will not require hospital staff to ask patients directly about their citizenship or immigration status.”
In southern California, again close to the border with Mexico, some hospitals are struggling with an influx of illegal immigrants.
American patients are enduring longer wait times for doctor appointments due to a nursing shortage in the state, two health care professionals told The Epoch Times in January.
A health care worker at a hospital in Southern California, who asked not to be named for fear of losing her job, told The Epoch Times that “the entire health care system is just being bombarded” by a steady stream of illegal immigrants.
“Our healthcare system is so overwhelmed, and then add on top of that tuberculosis, COVID-19, and other diseases from all over the world,” she said.

A newly-enacted law in California provides free healthcare for all illegal immigrants residing in the state. The law could cost taxpayers between $3 billion and $6 billion per year, according to recent estimates by state and federal lawmakers.
In New York, where the illegal immigration crisis has manifested most notably beyond the southern border, city and state officials have long been accommodating of illegal immigrants’ healthcare costs.
Since June 2014, when then-mayor Bill de Blasio set up The Task Force on Immigrant Health Care Access, New York City has worked to expand avenues for illegal immigrants to get free health care.
“New York City has a moral duty to ensure that all its residents have meaningful access to needed health care, regardless of their immigration status or ability to pay,” Mr. de Blasio stated in a 2015 report.
The report notes that in 2013, nearly 64 percent of illegal immigrants were uninsured. Since then, tens of thousands of illegal immigrants have settled in the city.
“The uninsured rate for undocumented immigrants is more than three times that of other noncitizens in New York City (20 percent) and more than six times greater than the uninsured rate for the rest of the city (10 percent),” the report states.
The report states that because healthcare providers don’t ask patients about documentation status, the task force lacks “data specific to undocumented patients.”
Some health care providers say a big part of the issue is that without a clear path to insurance or payment for non-emergency services, illegal immigrants are going to the hospital due to a lack of options.
“It’s insane, and it has been for years at this point,” Dana, a Texas emergency room nurse who asked to have her full name omitted, told The Epoch Times.
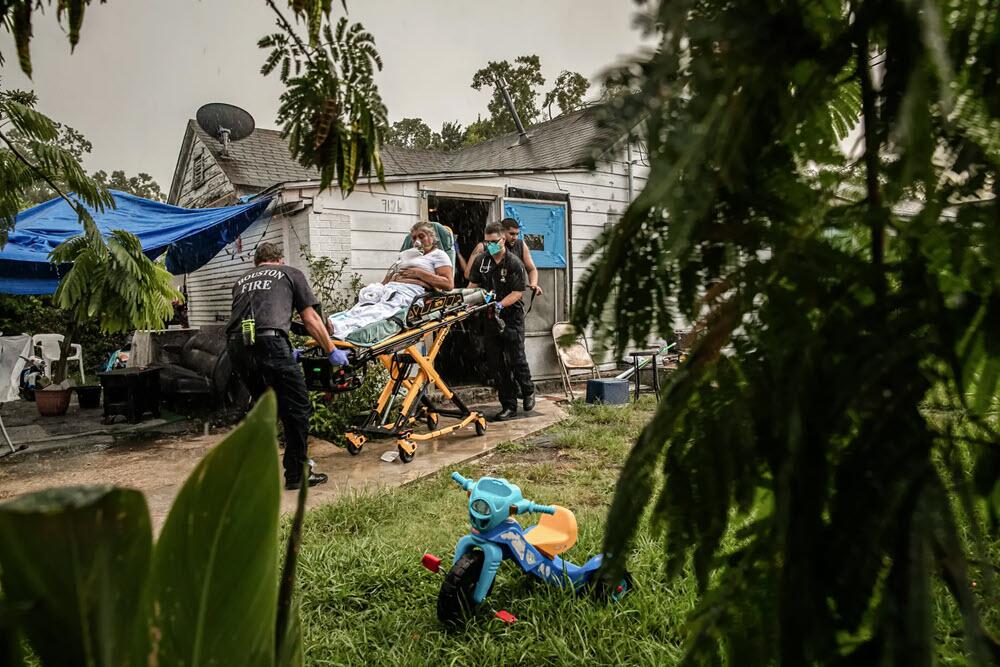
Working for a major hospital system in the greater Houston area, Dana has seen “a zillion” migrants pass through under her watch with “no end in sight.” She said many who are illegal immigrants arrive with treatable illnesses that require simple antibiotics. “Not a lot of GPs [general practitioners] will see you if you can’t pay and don’t have insurance.”
She said the “undocumented crowd” tends to arrive with a lot of the same conditions. Many find their way to Houston not long after crossing the southern border. Some of the common health issues Dana encounters include dehydration, unhealed fractures, respiratory illnesses, stomach ailments, and pregnancy-related concerns.
“This isn’t a new problem, it’s just worse now,” Dana said.

Medicaid Factor
One of the main government healthcare resources illegal immigrants use is Medicaid.
All those who don’t qualify for regular Medicaid are eligible for Emergency Medicaid, regardless of immigration status. By doing this, the program helps pay for the cost of uncompensated care bills at qualifying hospitals.
However, some loopholes allow access to the regular Medicaid benefits. “Qualified noncitizens” who haven’t been granted legal status within five years still qualify if they’re listed as a refugee, an asylum seeker, or a Cuban or Haitian national.
Yet the lion’s share of Medicaid usage by illegal immigrants still comes through state-level benefits and emergency medical treatment.
A Congressional report highlighted data from the CMS, which showed total Medicaid costs for “emergency services for undocumented aliens” in fiscal year 2021 surpassed $7 billion, and totaled more than $5 billion in fiscal 2022.
Both years represent a significant spike from the $3 billion in fiscal 2020.
An employee working with Medicaid who asked to be referred to only as Jennifer out of concern for her job, told The Epoch Times that at a state level, it’s easy for an illegal immigrant to access the program benefits.
Jennifer said that when exceptions are sent from states to CMS for approval, “denial is actually super rare. It’s usually always approved.”
She also said it comes as no surprise that many of the states with the highest amount of Medicaid spending are sanctuary states, which tend to have policies and laws that shield illegal immigrants from federal immigration authorities.
Moreover, Jennifer said there are ways for states to get around CMS guidelines. “It’s not easy, but it can and has been done.”
The first generation of illegal immigrants who arrive to the United States tend to be healthy enough to pass any pre-screenings, but Jennifer has observed that the subsequent generations tend to be sicker and require more access to care. If a family is illegally present, they tend to use Emergency Medicaid or nothing at all.
The Epoch Times asked Medicaid Services to provide the most recent data for the total uncompensated care that hospitals have reported. The agency didn’t respond.
Continue reading over at The Epoch Times
International
Fuel poverty in England is probably 2.5 times higher than government statistics show
The top 40% most energy efficient homes aren’t counted as being in fuel poverty, no matter what their bills or income are.
Share this:


The cap set on how much UK energy suppliers can charge for domestic gas and electricity is set to fall by 15% from April 1 2024. Despite this, prices remain shockingly high. The average household energy bill in 2023 was £2,592 a year, dwarfing the pre-pandemic average of £1,308 in 2019.
The term “fuel poverty” refers to a household’s ability to afford the energy required to maintain adequate warmth and the use of other essential appliances. Quite how it is measured varies from country to country. In England, the government uses what is known as the low income low energy efficiency (Lilee) indicator.
Since energy costs started rising sharply in 2021, UK households’ spending powers have plummeted. It would be reasonable to assume that these increasingly hostile economic conditions have caused fuel poverty rates to rise.
However, according to the Lilee fuel poverty metric, in England there have only been modest changes in fuel poverty incidence year on year. In fact, government statistics show a slight decrease in the nationwide rate, from 13.2% in 2020 to 13.0% in 2023.
Our recent study suggests that these figures are incorrect. We estimate the rate of fuel poverty in England to be around 2.5 times higher than what the government’s statistics show, because the criteria underpinning the Lilee estimation process leaves out a large number of financially vulnerable households which, in reality, are unable to afford and maintain adequate warmth.

Energy security
In 2022, we undertook an in-depth analysis of Lilee fuel poverty in Greater London. First, we combined fuel poverty, housing and employment data to provide an estimate of vulnerable homes which are omitted from Lilee statistics.
We also surveyed 2,886 residents of Greater London about their experiences of fuel poverty during the winter of 2022. We wanted to gauge energy security, which refers to a type of self-reported fuel poverty. Both parts of the study aimed to demonstrate the potential flaws of the Lilee definition.
Introduced in 2019, the Lilee metric considers a household to be “fuel poor” if it meets two criteria. First, after accounting for energy expenses, its income must fall below the poverty line (which is 60% of median income).
Second, the property must have an energy performance certificate (EPC) rating of D–G (the lowest four ratings). The government’s apparent logic for the Lilee metric is to quicken the net-zero transition of the housing sector.
In Sustainable Warmth, the policy paper that defined the Lilee approach, the government says that EPC A–C-rated homes “will not significantly benefit from energy-efficiency measures”. Hence, the focus on fuel poverty in D–G-rated properties.
Generally speaking, EPC A–C-rated homes (those with the highest three ratings) are considered energy efficient, while D–G-rated homes are deemed inefficient. The problem with how Lilee fuel poverty is measured is that the process assumes that EPC A–C-rated homes are too “energy efficient” to be considered fuel poor: the main focus of the fuel poverty assessment is a characteristic of the property, not the occupant’s financial situation.
In other words, by this metric, anyone living in an energy-efficient home cannot be considered to be in fuel poverty, no matter their financial situation. There is an obvious flaw here.
Around 40% of homes in England have an EPC rating of A–C. According to the Lilee definition, none of these homes can or ever will be classed as fuel poor. Even though energy prices are going through the roof, a single-parent household with dependent children whose only income is universal credit (or some other form of benefits) will still not be considered to be living in fuel poverty if their home is rated A-C.
The lack of protection afforded to these households against an extremely volatile energy market is highly concerning.
In our study, we estimate that 4.4% of London’s homes are rated A-C and also financially vulnerable. That is around 171,091 households, which are currently omitted by the Lilee metric but remain highly likely to be unable to afford adequate energy.
In most other European nations, what is known as the 10% indicator is used to gauge fuel poverty. This metric, which was also used in England from the 1990s until the mid 2010s, considers a home to be fuel poor if more than 10% of income is spent on energy. Here, the main focus of the fuel poverty assessment is the occupant’s financial situation, not the property.
Were such alternative fuel poverty metrics to be employed, a significant portion of those 171,091 households in London would almost certainly qualify as fuel poor.
This is confirmed by the findings of our survey. Our data shows that 28.2% of the 2,886 people who responded were “energy insecure”. This includes being unable to afford energy, making involuntary spending trade-offs between food and energy, and falling behind on energy payments.
Worryingly, we found that the rate of energy insecurity in the survey sample is around 2.5 times higher than the official rate of fuel poverty in London (11.5%), as assessed according to the Lilee metric.
It is likely that this figure can be extrapolated for the rest of England. If anything, energy insecurity may be even higher in other regions, given that Londoners tend to have higher-than-average household income.
The UK government is wrongly omitting hundreds of thousands of English households from fuel poverty statistics. Without a more accurate measure, vulnerable households will continue to be overlooked and not get the assistance they desperately need to stay warm.
Torran Semple receives funding from Engineering and Physical Sciences Research Council (EPSRC) grant EP/S023305/1.
John Harvey does not work for, consult, own shares in or receive funding from any company or organisation that would benefit from this article, and has disclosed no relevant affiliations beyond their academic appointment.
european uk pandemicGovernment
Looking Back At COVID’s Authoritarian Regimes
After having moved from Canada to the United States, partly to be wealthier and partly to be freer (those two are connected, by the way), I was shocked,…
Share this:


After having moved from Canada to the United States, partly to be wealthier and partly to be freer (those two are connected, by the way), I was shocked, in March 2020, when President Trump and most US governors imposed heavy restrictions on people’s freedom. The purpose, said Trump and his COVID-19 advisers, was to “flatten the curve”: shut down people’s mobility for two weeks so that hospitals could catch up with the expected demand from COVID patients. In her book Silent Invasion, Dr. Deborah Birx, the coordinator of the White House Coronavirus Task Force, admitted that she was scrambling during those two weeks to come up with a reason to extend the lockdowns for much longer. As she put it, “I didn’t have the numbers in front of me yet to make the case for extending it longer, but I had two weeks to get them.” In short, she chose the goal and then tried to find the data to justify the goal. This, by the way, was from someone who, along with her task force colleague Dr. Anthony Fauci, kept talking about the importance of the scientific method. By the end of April 2020, the term “flatten the curve” had all but disappeared from public discussion.
Now that we are four years past that awful time, it makes sense to look back and see whether those heavy restrictions on the lives of people of all ages made sense. I’ll save you the suspense. They didn’t. The damage to the economy was huge. Remember that “the economy” is not a term used to describe a big machine; it’s a shorthand for the trillions of interactions among hundreds of millions of people. The lockdowns and the subsequent federal spending ballooned the budget deficit and consequent federal debt. The effect on children’s learning, not just in school but outside of school, was huge. These effects will be with us for a long time. It’s not as if there wasn’t another way to go. The people who came up with the idea of lockdowns did so on the basis of abstract models that had not been tested. They ignored a model of human behavior, which I’ll call Hayekian, that is tested every day.
These are the opening two paragraphs of my latest Defining Ideas article, “Looking Back at COVID’s Authoritarian Regimes,” Defining Ideas, March 14, 2024.
Another excerpt:
That wasn’t the only uncertainty. My daughter Karen lived in San Francisco and made her living teaching Pilates. San Francisco mayor London Breed shut down all the gyms, and so there went my daughter’s business. (The good news was that she quickly got online and shifted many of her clients to virtual Pilates. But that’s another story.) We tried to see her every six weeks or so, whether that meant our driving up to San Fran or her driving down to Monterey. But were we allowed to drive to see her? In that first month and a half, we simply didn’t know.
Read the whole thing, which is longer than usual.
(0 COMMENTS) budget deficit coronavirus covid-19 white house fauci trump canada

Net Zero, The Digital Panopticon, & The Future Of Food


Problems After COVID-19 Vaccination More Prevalent Among Naturally Immune: Study


For-profit nursing homes are cutting corners on safety and draining resources with financial shenanigans − especially at midsize chains that dodge public scrutiny


Trump nearly derailed democracy once − here’s what to watch out for in reelection campaign


‘Excess Mortality Skyrocketed’: Tucker Carlson and Dr. Pierre Kory Unpack ‘Criminal’ COVID Response


Looking Back At COVID’s Authoritarian Regimes


Riley Gaines Explains How Women’s Sports Are Rigged To Promote The Trans Agenda


Health Officials: Man Dies From Bubonic Plague In New Mexico


Illegal Immigrants Leave US Hospitals With Billions In Unpaid Bills


MIPIM 2024 Reflects Mixed Feelings on CRE Recovery
-

 Uncategorized3 weeks ago
All Of The Elements Are In Place For An Economic Crisis Of Staggering Proportions
-

 International1 week ago
EyePoint poaches medical chief from Apellis; Sandoz CFO, longtime BioNTech exec to retire
-

 Uncategorized4 weeks ago
California Counties Could Be Forced To Pay $300 Million To Cover COVID-Era Program
-

 Uncategorized3 weeks ago
Apparel Retailer Express Moving Toward Bankruptcy
-

 Uncategorized4 weeks ago
Industrial Production Decreased 0.1% in January
-

 International1 week ago
Walmart launches clever answer to Target’s new membership program
-

 Spread & Containment2 days ago
IFM’s Hat Trick and Reflections On Option-To-Buy M&A
-

 Uncategorized4 weeks ago
RFK Jr: The Wuhan Cover-Up & The Rise Of The Biowarfare-Industrial Complex