Jobs Shock: September Payrolls Unexpectedly Soar By 336K, Biggest Jump Since January And 6-Sigma Beat
The Biden administration has really outdone itself.
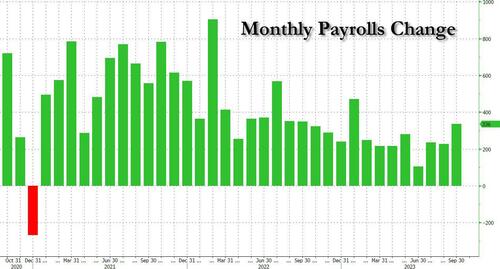
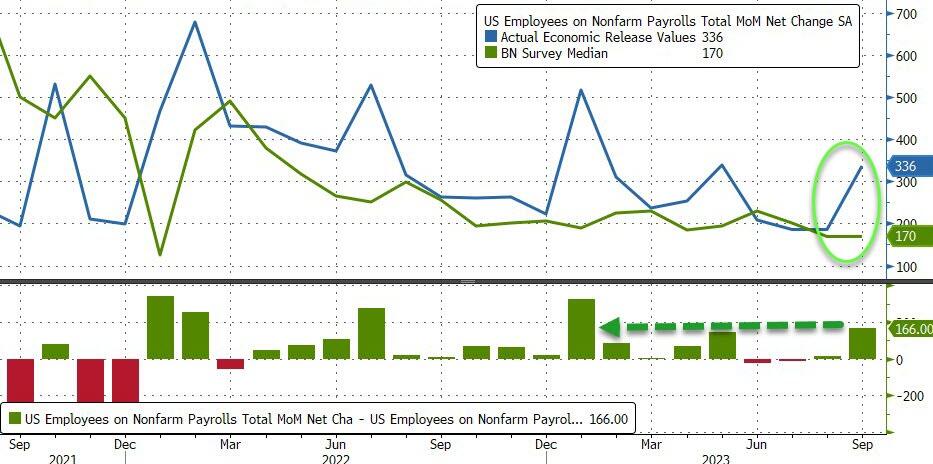
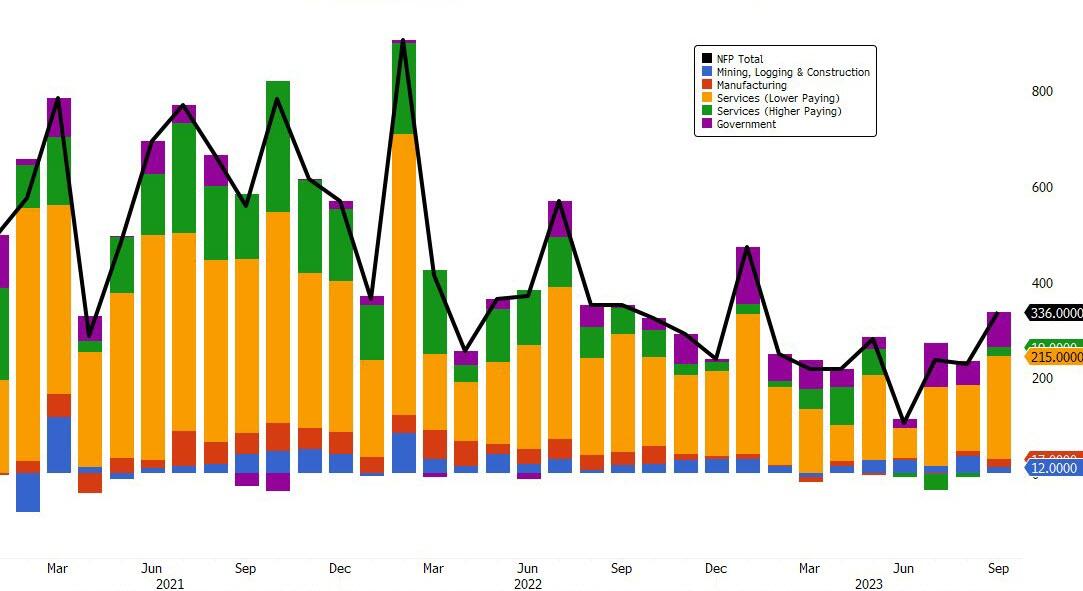
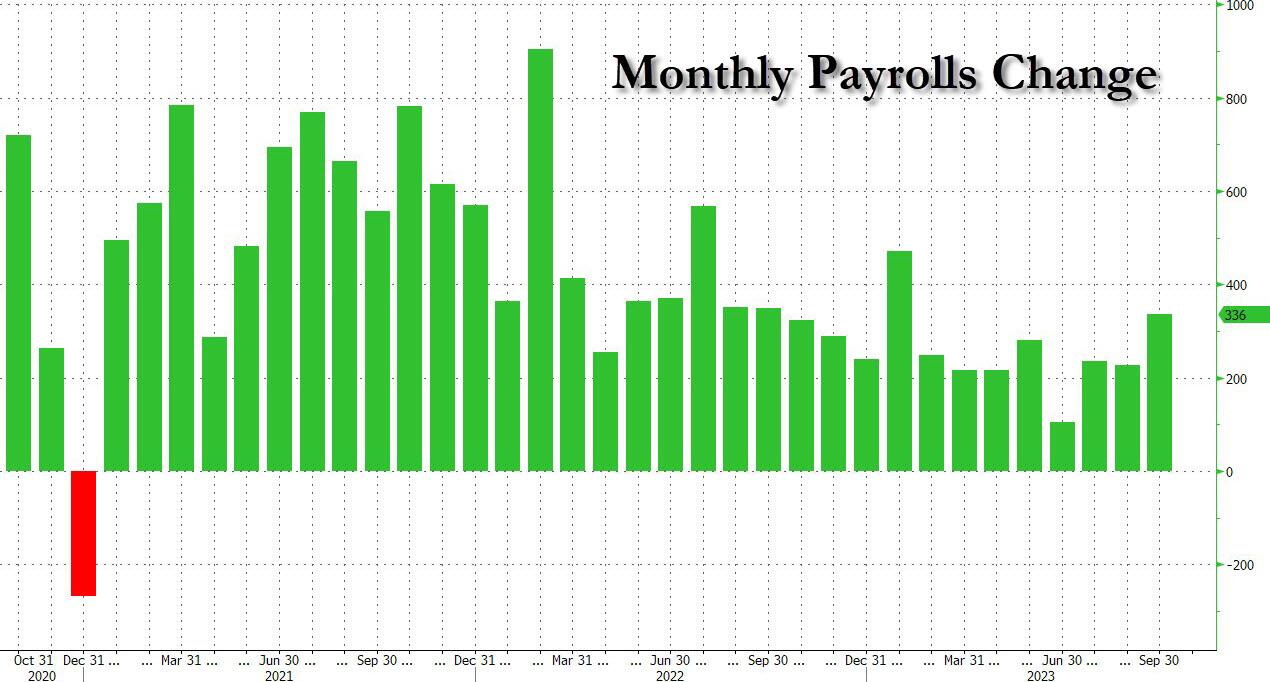
With everyone - even the most hardened bulls - expecting the September jobs report to be not only the weakest of 2023 but to presage a big drop in future payrolls data, moments ago the BLS reported that in September - a month when countless companies shut down due to labor strikes (i.e., people not working) - the US added a whopping 336K jobs, the highest monthly increase since January...
... and not only double the consensus estimate of 170K, but above the highest sellside estimate of 250K!
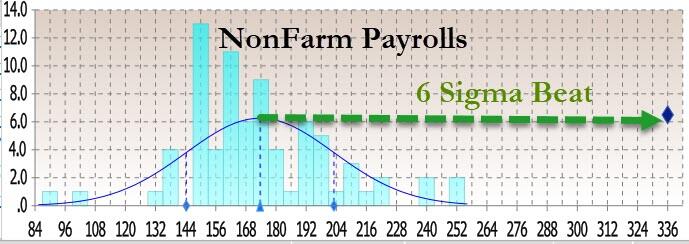
In fact, at 336K vs a median forecast of 170K, today's print was the first 6-sigma beat of expectations in a long time.
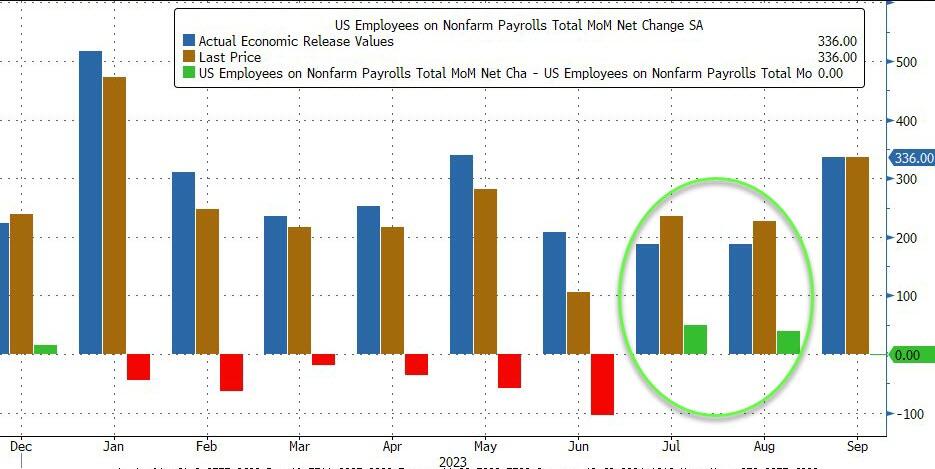
Furthermore, having become the butt of all data goalseeking jokes in recent months after revising every single month in 2023 lower, the BLS decided to show people who is boss and revised not only August but also July higher: the change in total nonfarm payroll employment for July was revised up by 79,000, from +157,000 to +236,000, and the change for August was revised up by 40,000, from +187,000 to +227,000. With these revisions, employment in July and August combined is 119,000 higher than previously reported.
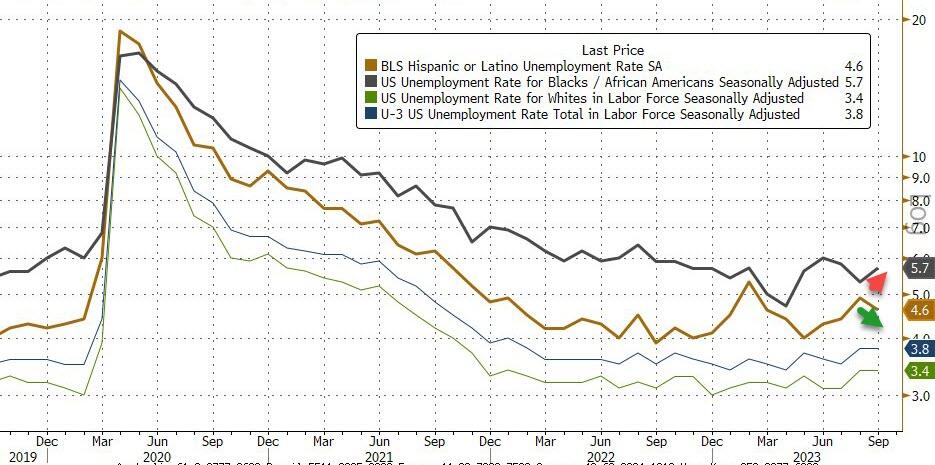
Looking at the unemployment rate, things here were not quite so good, with the rate unchanged at 3.8% from last month, above expectations of a modest drop to 3.7%, as Black unemployment increased while Hispanic unemp dropped.
Unemployment rates were as follows: adult men (3.8%), adult women (3.1%), teenagers (11.6%), Whites (3.4%), Blacks (5.7%), Asians (2.8%), and Hispanics (4.6%).
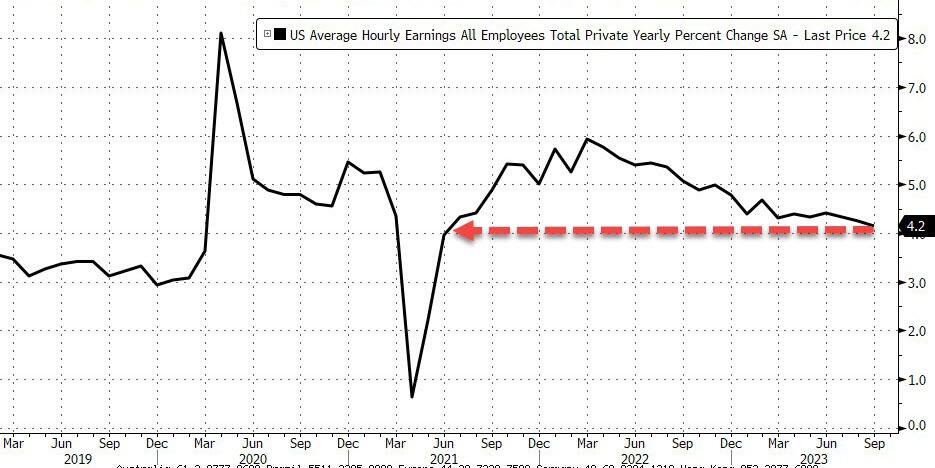
Meanwhile wage growth continued to cool, and in September average hourly earnings increased 0.2%, below the 0.3% expected, and resulted in a 4.2% increase YoY, down from 4.3% in August...
... as a result of a big bump in lower paying jobs.
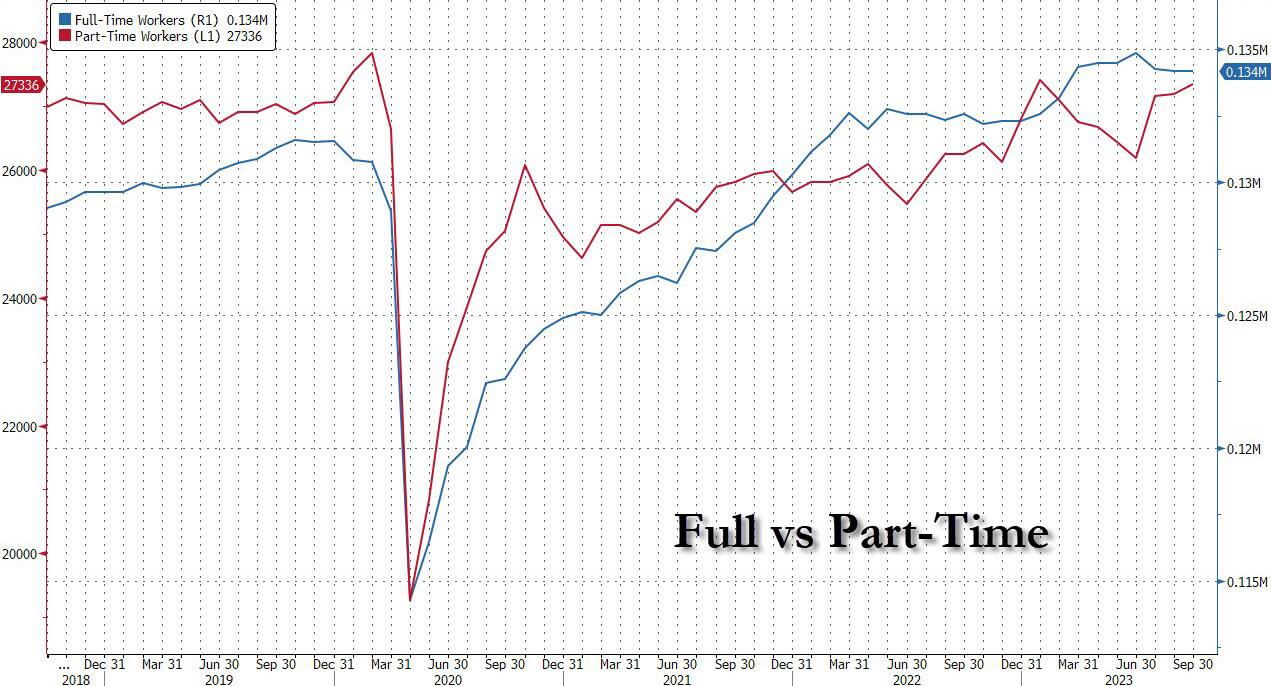
But perhaps the most remarkable divergence in the report is that with headline payrolls surging 336K (establishment survey), the Household Survey indicated that the pain continues, as the number of people employed not only rose by less than 100K (86K to be precise), but it was all part-time workers, which increased by 151K. Full-time workers? Why, they dropped by 22K, and the lowest since February.
Some more highlights from the report:
The number of long-term unemployed (those jobless for 27 weeks or more) was little changed at 1.2 million in September. The long-term unemployed accounted for 19.1 percent of all unemployed persons.
Both the labor force participation rate, at 62.8 percent, and the employment-population ratio, at 60.4 percent, were unchanged over the month.
The number of persons employed part time for economic reasons, at 4.1 million, changed little in September. These individuals, who would have preferred full-time employment, were working part time because their hours had been reduced or they were unable to find full-time jobs.
In September, the number of persons not in the labor force who currently want a job was 5.5 million, little different from the prior month. These individuals were not counted as unemployed because they were not actively looking for work during the 4 weeks preceding the survey or were unavailable to take a job.
Among those not in the labor force who wanted a job, the number of persons marginally attached to the labor force changed little at 1.5 million in September. These individuals wanted and were available for work and had looked for a job sometime in the prior 12 months but had not looked for work in the 4 weeks preceding the survey. The number of discouraged workers, a subset of the marginally attached who believed that no jobs were available for them, also changed little over the month at 367,000.
Here is the breakdown of jobs:
Leisure and hospitality added 96,000 jobs in September, above the average monthly gain of 61,000 over the prior 12 months. Employment in food services and drinking places rose by 61,000 over the month and has returned to its pre-pandemic February 2020 level.
In September, government employment increased by 73,000, above the average monthly gain of 47,000 over the prior 12 months. Over the month, job gains occurred in state government education (+29,000) and in local government, excluding education (+27,000).
Health care added 41,000 jobs in September, compared with the average monthly gain of 53,000 over the prior 12 months. Over the month, employment continued to trend up in ambulatory health care services (+24,000), hospitals (+8,000), and nursing and residential care facilities (+8,000).
Employment in professional, scientific, and technical services increased by 29,000 in September, in line with the average monthly gain of 27,000 over the prior 12 months.
Social assistance added 25,000 jobs in September, about the same as the average monthly gain of 23,000 over the prior 12 months. Over the month, job growth occurred in individual and family services (+19,000).
In September, employment in transportation and warehousing changed little (+9,000). Truck transportation added 9,000 jobs, following a decline of 25,000 in August that largely reflected a business closure. Air transportation added 5,000 jobs in September.
Employment in information changed little in September (-5,000). Within the industry, employment in motion picture and sound recording industries continued to trend down (-7,000) and has declined by 45,000 since May, reflecting the impact of labor disputes.
Employment showed little change over the month in other major industries, including mining, quarrying, and oil and gas extraction; construction; manufacturing; wholesale trade; retail trade; financial activities; and other services.
While we will publish a longer reaction piece shortly, this kneejerk response stood out from Peter Tchir of Academy Securities:
Given the strength of the job market (according to the Establishment data) and the barrage of “strike” headlines, that seems somewhat surprising.... The unemployment rate stayed at 3.8%, as the Household survey showed decline in full-time jobs for the 3rd month in a row. Total jobs were positive for the Household survey, but driven by an increase in part-time jobs (which doesn’t seem overly consistent with a blow out jobs report).
Difficult to fight the algos which are going to drive yields higher based on the headline number, but expect, as the day goes on, for many in the markets to question the veracity of this report and for the early losses in bonds and stocks to be dramatically reduced, if not finish the day and the week in the green!
The bottom line seems to be that virtually nobody believes the goalseeked propaganda spewed by the Biden admin any more...
BUFFALO, NY- March 11, 2024 – Impact Journals publishes scholarly journals in the biomedical sciences with a focus on all areas of cancer and aging research. Aging is one of the most prominent journals published by Impact Journals.
Credit: Impact Journals
BUFFALO, NY- March 11, 2024 – Impact Journals publishes scholarly journals in the biomedical sciences with a focus on all areas of cancer and aging research. Aging is one of the most prominent journals published by Impact Journals.
Impact Journals will be participating as an exhibitor at the American Association for Cancer Research (AACR) Annual Meeting 2024 from April 5-10 at the San Diego Convention Center in San Diego, California. This year, the AACR meeting theme is “Inspiring Science • Fueling Progress • Revolutionizing Care.”
Visit booth #4159 at the AACR Annual Meeting 2024 to connect with members of the Agingteam.
About Aging-US:
Agingpublishes research papers in all fields of aging research including but not limited, aging from yeast to mammals, cellular senescence, age-related diseases such as cancer and Alzheimer’s diseases and their prevention and treatment, anti-aging strategies and drug development and especially the role of signal transduction pathways such as mTOR in aging and potential approaches to modulate these signaling pathways to extend lifespan. The journal aims to promote treatment of age-related diseases by slowing down aging, validation of anti-aging drugs by treating age-related diseases, prevention of cancer by inhibiting aging. Cancer and COVID-19 are age-related diseases.
Agingis indexed and archived byPubMed/Medline (abbreviated as “Aging (Albany NY)”), PubMed Central, Web of Science: Science Citation Index Expanded (abbreviated as “Aging‐US” and listed in the Cell Biology and Geriatrics & Gerontology categories), Scopus (abbreviated as “Aging” and listed in the Cell Biology and Aging categories), Biological Abstracts, BIOSIS Previews, EMBASE, META (Chan Zuckerberg Initiative) (2018-2022), and Dimensions (Digital Science).
Please visit our website at www.Aging-US.com and connect with us:
NY Fed Finds Medium, Long-Term Inflation Expectations Jump Amid Surge In Stock Market Optimism
One month after the inflation outlook tracked by the NY Fed Consumer Survey extended their late 2023 slide, with 3Y inflation expectations in January sliding to a record low 2.4% (from 2.6% in December), even as 1 and 5Y inflation forecasts remained flat, moments ago the NY Fed reported that in February there was a sharp rebound in longer-term inflation expectations, rising to 2.7% from 2.4% at the three-year ahead horizon, and jumping to 2.9% from 2.5% at the five-year ahead horizon, while the 1Y inflation outlook was flat for the 3rd month in a row, stuck at 3.0%.
The increases in both the three-year ahead and five-year ahead measures were most pronounced for respondents with at most high school degrees (in other words, the "really smart folks" are expecting deflation soon). The survey’s measure of disagreement across respondents (the difference between the 75th and 25th percentile of inflation expectations) decreased at all horizons, while the median inflation uncertainty—or the uncertainty expressed regarding future inflation outcomes—declined at the one- and three-year ahead horizons and remained unchanged at the five-year ahead horizon.
Going down the survey, we find that the median year-ahead expected price changes increased by 0.1 percentage point to 4.3% for gas; decreased by 1.8 percentage points to 6.8% for the cost of medical care (its lowest reading since September 2020); decreased by 0.1 percentage point to 5.8% for the cost of a college education; and surprisingly decreased by 0.3 percentage point for rent to 6.1% (its lowest reading since December 2020), and remained flat for food at 4.9%.
We find the rent expectations surprising because it is happening just asking rents are rising across the country.
At the same time as consumers erroneously saw sharply lower rents, median home price growth expectations remained unchanged for the fifth consecutive month at 3.0%.
Turning to the labor market, the survey found that the average perceived likelihood of voluntary and involuntary job separations increased, while the perceived likelihood of finding a job (in the event of a job loss) declined. "The mean probability of leaving one’s job voluntarily in the next 12 months also increased, by 1.8 percentage points to 19.5%."
Mean unemployment expectations - or the mean probability that the U.S. unemployment rate will be higher one year from now - decreased by 1.1 percentage points to 36.1%, the lowest reading since February 2022. Additionally, the median one-year-ahead expected earnings growth was unchanged at 2.8%, remaining slightly below its 12-month trailing average of 2.9%.
Turning to household finance, we find the following:
The median expected growth in household income remained unchanged at 3.1%. The series has been moving within a narrow range of 2.9% to 3.3% since January 2023, and remains above the February 2020 pre-pandemic level of 2.7%.
Median household spending growth expectations increased by 0.2 percentage point to 5.2%. The increase was driven by respondents with a high school degree or less.
Median year-ahead expected growth in government debt increased to 9.3% from 8.9%.
The mean perceived probability that the average interest rate on saving accounts will be higher in 12 months increased by 0.6 percentage point to 26.1%, remaining below its 12-month trailing average of 30%.
Perceptions about households’ current financial situations deteriorated somewhat with fewer respondents reporting being better off than a year ago. Year-ahead expectations also deteriorated marginally with a smaller share of respondents expecting to be better off and a slightly larger share of respondents expecting to be worse off a year from now.
The mean perceived probability that U.S. stock prices will be higher 12 months from now increased by 1.4 percentage point to 38.9%.
At the same time, perceptions and expectations about credit access turned less optimistic: "Perceptions of credit access compared to a year ago deteriorated with a larger share of respondents reporting tighter conditions and a smaller share reporting looser conditions compared to a year ago."
Also, a smaller percentage of consumers, 11.45% vs 12.14% in prior month, expect to not be able to make minimum debt payment over the next three months
Last, and perhaps most humorous, is the now traditional cognitive dissonance one observes with these polls, because at a time when long-term inflation expectations jumped, which clearly suggests that financial conditions will need to be tightened, the number of respondents expecting higher stock prices one year from today jumped to the highest since November 2021... which incidentally is just when the market topped out during the last cycle before suffering a painful bear market.
Homes listed for sale in early June sell for $7,700 more
New Zillow research suggests the spring home shopping season may see a second wave this summer if mortgage rates fall
The post Homes listed for sale in…
A Zillow analysis of 2023 home sales finds homes listed in the first two weeks of June sold for 2.3% more.
The best time to list a home for sale is a month later than it was in 2019, likely driven by mortgage rates.
The best time to list can be as early as the second half of February in San Francisco, and as late as the first half of July in New York and Philadelphia.
Spring home sellers looking to maximize their sale price may want to wait it out and list their home for sale in the first half of June. A new Zillow® analysis of 2023 sales found that homes listed in the first two weeks of June sold for 2.3% more, a $7,700 boost on a typical U.S. home.
The best time to list consistently had been early May in the years leading up to the pandemic. The shift to June suggests mortgage rates are strongly influencing demand on top of the usual seasonality that brings buyers to the market in the spring. This home-shopping season is poised to follow a similar pattern as that in 2023, with the potential for a second wave if the Federal Reserve lowers interest rates midyear or later.
The 2.3% sale price premium registered last June followed the first spring in more than 15 years with mortgage rates over 6% on a 30-year fixed-rate loan. The high rates put home buyers on the back foot, and as rates continued upward through May, they were still reassessing and less likely to bid boldly. In June, however, rates pulled back a little from 6.79% to 6.67%, which likely presented an opportunity for determined buyers heading into summer. More buyers understood their market position and could afford to transact, boosting competition and sale prices.
The old logic was that sellers could earn a premium by listing in late spring, when search activity hit its peak. Now, with persistently low inventory, mortgage rate fluctuations make their own seasonality. First-time home buyers who are on the edge of qualifying for a home loan may dip in and out of the market, depending on what’s happening with rates. It is almost certain the Federal Reserve will push back any interest-rate cuts to mid-2024 at the earliest. If mortgage rates follow, that could bring another surge of buyers later this year.
Mortgage rates have been impacting affordability and sale prices since they began rising rapidly two years ago. In 2022, sellers nationwide saw the highest sale premium when they listed their home in late March, right before rates barreled past 5% and continued climbing.
Zillow’s research finds the best time to list can vary widely by metropolitan area. In 2023, it was as early as the second half of February in San Francisco, and as late as the first half of July in New York. Thirty of the top 35 largest metro areas saw for-sale listings command the highest sale prices between May and early July last year.
Zillow also found a wide range in the sale price premiums associated with homes listed during those peak periods. At the hottest time of the year in San Jose, homes sold for 5.5% more, a $88,000 boost on a typical home. Meanwhile, homes in San Antonio sold for 1.9% more during that same time period.
We use cookies on our website to give you the most relevant experience by remembering your preferences and repeat visits. By clicking “Accept”, you consent to the use of ALL the cookies.
This website uses cookies to improve your experience while you navigate through the website. Out of these, the cookies that are categorized as necessary are stored on your browser as they are essential for the working of basic functionalities of the website. We also use third-party cookies that help us analyze and understand how you use this website. These cookies will be stored in your browser only with your consent. You also have the option to opt-out of these cookies. But opting out of some of these cookies may affect your browsing experience.
Necessary cookies are absolutely essential for the website to function properly. These cookies ensure basic functionalities and security features of the website, anonymously.
Cookie
Duration
Description
cookielawinfo-checbox-analytics
11 months
This cookie is set by GDPR Cookie Consent plugin. The cookie is used to store the user consent for the cookies in the category "Analytics".
cookielawinfo-checbox-functional
11 months
The cookie is set by GDPR cookie consent to record the user consent for the cookies in the category "Functional".
cookielawinfo-checbox-others
11 months
This cookie is set by GDPR Cookie Consent plugin. The cookie is used to store the user consent for the cookies in the category "Other.
cookielawinfo-checkbox-necessary
11 months
This cookie is set by GDPR Cookie Consent plugin. The cookies is used to store the user consent for the cookies in the category "Necessary".
cookielawinfo-checkbox-performance
11 months
This cookie is set by GDPR Cookie Consent plugin. The cookie is used to store the user consent for the cookies in the category "Performance".
viewed_cookie_policy
11 months
The cookie is set by the GDPR Cookie Consent plugin and is used to store whether or not user has consented to the use of cookies. It does not store any personal data.
Functional cookies help to perform certain functionalities like sharing the content of the website on social media platforms, collect feedbacks, and other third-party features.
Performance cookies are used to understand and analyze the key performance indexes of the website which helps in delivering a better user experience for the visitors.
Analytical cookies are used to understand how visitors interact with the website. These cookies help provide information on metrics the number of visitors, bounce rate, traffic source, etc.
Advertisement cookies are used to provide visitors with relevant ads and marketing campaigns. These cookies track visitors across websites and collect information to provide customized ads.


