In the past few weeks the U.S. stock market has erased all of its gains over the past few months. The summer of 2023 came and went and we have nothing…
In the past few weeks the U.S. stock market has erased all of its gains over the past few months. The summer of 2023 came and went and we have nothing to show for it. Inflation and volatility are starting to creep back up and CNN's Fear & Greed index is seeing red once again.
With all this uncertainty, many investors are wondering: is the U.S. stock market as bad as it seems?
In some ways, it is. With a highly concentrated market rally and lingering inflation, there are legitimate things for retail investors to be worried about. However, history suggests that most of the market pain is already behind us. Let's dig in.
The Bad
As I discussed earlier this year, at the end of May only seven stocks were responsible for the entire gain in the U.S. stock market in 2023. This lack of breadth was a major concern for me as only a handful of large companies were leading the rally in equities.
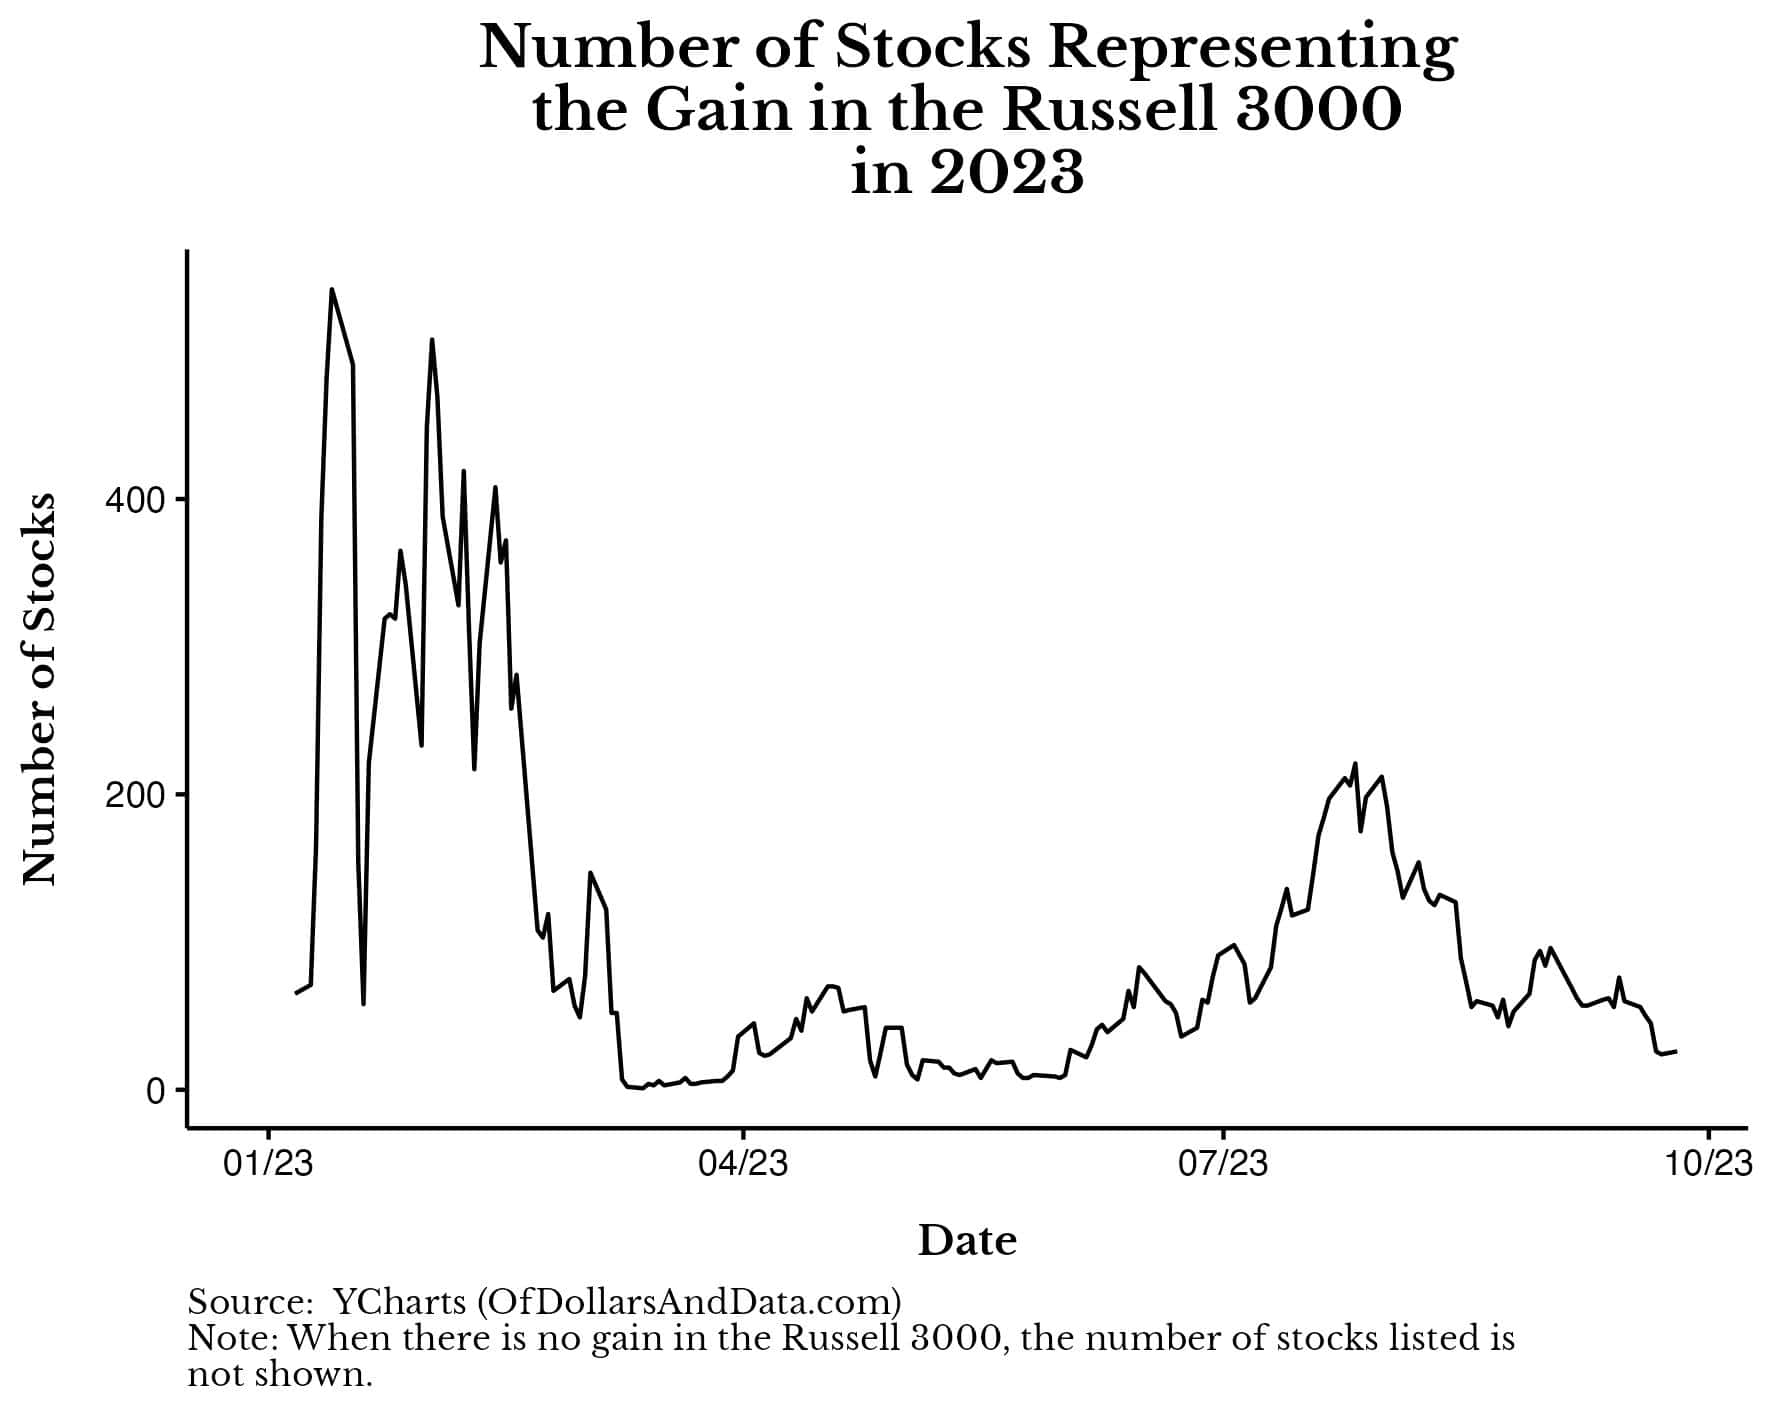
Unfortunately, this hasn't changed much since. Though the market rally did broaden during the summer, recent losses have caused things to reverse course. As of late September, only 25 companies are responsible for the 12% year-to-date gain in U.S. stocks.
You can see this more clearly by looking at the number of stocks responsible for the gain in the Russell 3000 (a broad based U.S. stock index) this year:
Though this year's rally started quite broadly, it has since become concentrated into relatively few companies. You know the names—Apple, Meta, Nvidia, etc. This level of concentration suggests that there might be more weakness in the market than what the overall gain would suggest.
But, the lack of market breadth isn't our only problem. We are also dealing with persistent inflation. Though CPI has come down from a high of 9% in June 2022, it's since increased from 3% to 3.7% over the past two months. This isn't a good sign.
As Jeremy Grantham explained in a recent episode of The Compound and Friends:
It turns out the market is coincident indicator of comfort. What makes the typical portfolio manager feel comfortable? Number one–it loves low inflation. It hates high inflation. It likes 2% stable inflation.
It does not like to see it bouncing around. It does not like to see it spike, in the worst way. And it does not like to see it hanging around for multiple years. That's the most important.
I've previously discussed why people hate uncertainty in the context of a career, but this idea is equally valid in markets. Most of us just want to know if we'll be okay and persistent inflation makes it difficult for us to answer that question. It makes it difficult for businesses and consumers alike to plan for the future. So, while prices remain in flux, we should expect more bumps along the road in the future.
Despite the storm clouds on the market's horizon, the worst month for the stock market is over and history suggests that there are some reasons to be hopeful.
The Good
Albert Einstein once [allegedly] said, "If you want to know the future, look at the past." Well, based on the past, the worst part of our current decline seems to be behind us.
We can see this clearly if we compare the top 10 worst inflation-adjusted drawdowns in U.S. stock market history against each other. As you can see, our current decline (highlighted in pink below) already seems to be on the road to recovery:
And, when we examine a longer time horizon, we see that U.S. market declines don't tend to bottom, recover, and then fall further in the future.
No, that's not how they typically work. In practice, the U.S. stock market tends to fall, reach its bottom, and then recover, as you can see in the chart below:
The two exceptions to this rule occurred in 1937 and 2000 where a secondary decline followed an initial decline years later.
You can see these two declines the chart below (with our current decline added in blue for context):
While it is definitely possible that our current decline could follow a similar path as the 1937 or 2000 declines, I wouldn't bet on it. Why?
Because, the causes of the secondary declines in 1937 and 2000 were unforeseen events that had little to do with the initial declines.
In 1937, the market initially fell due to monetary and fiscal policy issues but didn't ultimately bottom until May 1942, at the point of maximum bearishness during WWII. And in the case of the early 2000s decline, the market was nearly recovered from the DotCom Bubble when the Great Financial Crisis hit and sent it even lower. In both cases, the second decline had almost nothing to do with the first decline.
I believe the same thing will be true today. If we were to see a double-dip to a new low in 2023 (or beyond), it won't be because inflation ticked back up to 5%-6% for a few months. No, it will be because of something we couldn't predict at all.
While you might see this as bad news, I see it as good news. Why? Because these kinds of black swan events have two redeeming qualities. First, they are rare, which makes them unlikely to occur. And, second, because they are unpredictable, it's very difficult to prepare for them ahead of time. Therefore, why should we worry about them?
This might seem like a naive question from someone who tells you to "ignore the noise" and "Just Keep Buying" but it's not. It's fundamental to the way you invest your money.
After all, if you can't prepare for something that is unlikely to happen, what's the point in getting all worked up about it? There is no point. We will just have to cross that bridge when we get there.
If this line of thinking doesn't console you, then consider that the 4th quarter is historically the strongest for U.S. stocks. If this doesn't help, then "sin a little" and shift more of your future investments into Treasury bills. If Treasury bills worry you, then buy more farmland or Bitcoin or whatever else helps you sleep at night.
Either way, I can't provide you with the answer. I can only show you the data and then let you decide for yourself.
And the data suggests that predicting the future is incredibly difficult. So, we should choose an approach that is agnostic to whatever the future holds.
For me, that means the continual purchase of a diverse set of income-producing assets. The assets will change, but the philosophy will not.
So when someone asks, "Is the U.S. stock market as bad as it seems?" I don't worry about the answer.
Happy investing and thank you for reading.
If you liked this post, consider signing up for my newsletter or checking out my prior work in e-book form.
This is post 366. Any code I have related to this post can be found here with the same numbering: https://github.com/nmaggiulli/of-dollars-and-dataequitiesstocksbitcoin
BUFFALO, NY- March 11, 2024 – Impact Journals publishes scholarly journals in the biomedical sciences with a focus on all areas of cancer and aging research. Aging is one of the most prominent journals published by Impact Journals.
Credit: Impact Journals
BUFFALO, NY- March 11, 2024 – Impact Journals publishes scholarly journals in the biomedical sciences with a focus on all areas of cancer and aging research. Aging is one of the most prominent journals published by Impact Journals.
Impact Journals will be participating as an exhibitor at the American Association for Cancer Research (AACR) Annual Meeting 2024 from April 5-10 at the San Diego Convention Center in San Diego, California. This year, the AACR meeting theme is “Inspiring Science • Fueling Progress • Revolutionizing Care.”
Visit booth #4159 at the AACR Annual Meeting 2024 to connect with members of the Agingteam.
About Aging-US:
Agingpublishes research papers in all fields of aging research including but not limited, aging from yeast to mammals, cellular senescence, age-related diseases such as cancer and Alzheimer’s diseases and their prevention and treatment, anti-aging strategies and drug development and especially the role of signal transduction pathways such as mTOR in aging and potential approaches to modulate these signaling pathways to extend lifespan. The journal aims to promote treatment of age-related diseases by slowing down aging, validation of anti-aging drugs by treating age-related diseases, prevention of cancer by inhibiting aging. Cancer and COVID-19 are age-related diseases.
Agingis indexed and archived byPubMed/Medline (abbreviated as “Aging (Albany NY)”), PubMed Central, Web of Science: Science Citation Index Expanded (abbreviated as “Aging‐US” and listed in the Cell Biology and Geriatrics & Gerontology categories), Scopus (abbreviated as “Aging” and listed in the Cell Biology and Aging categories), Biological Abstracts, BIOSIS Previews, EMBASE, META (Chan Zuckerberg Initiative) (2018-2022), and Dimensions (Digital Science).
Please visit our website at www.Aging-US.com and connect with us:
NY Fed Finds Medium, Long-Term Inflation Expectations Jump Amid Surge In Stock Market Optimism
One month after the inflation outlook tracked by the NY Fed Consumer Survey extended their late 2023 slide, with 3Y inflation expectations in January sliding to a record low 2.4% (from 2.6% in December), even as 1 and 5Y inflation forecasts remained flat, moments ago the NY Fed reported that in February there was a sharp rebound in longer-term inflation expectations, rising to 2.7% from 2.4% at the three-year ahead horizon, and jumping to 2.9% from 2.5% at the five-year ahead horizon, while the 1Y inflation outlook was flat for the 3rd month in a row, stuck at 3.0%.
The increases in both the three-year ahead and five-year ahead measures were most pronounced for respondents with at most high school degrees (in other words, the "really smart folks" are expecting deflation soon). The survey’s measure of disagreement across respondents (the difference between the 75th and 25th percentile of inflation expectations) decreased at all horizons, while the median inflation uncertainty—or the uncertainty expressed regarding future inflation outcomes—declined at the one- and three-year ahead horizons and remained unchanged at the five-year ahead horizon.
Going down the survey, we find that the median year-ahead expected price changes increased by 0.1 percentage point to 4.3% for gas; decreased by 1.8 percentage points to 6.8% for the cost of medical care (its lowest reading since September 2020); decreased by 0.1 percentage point to 5.8% for the cost of a college education; and surprisingly decreased by 0.3 percentage point for rent to 6.1% (its lowest reading since December 2020), and remained flat for food at 4.9%.
We find the rent expectations surprising because it is happening just asking rents are rising across the country.
At the same time as consumers erroneously saw sharply lower rents, median home price growth expectations remained unchanged for the fifth consecutive month at 3.0%.
Turning to the labor market, the survey found that the average perceived likelihood of voluntary and involuntary job separations increased, while the perceived likelihood of finding a job (in the event of a job loss) declined. "The mean probability of leaving one’s job voluntarily in the next 12 months also increased, by 1.8 percentage points to 19.5%."
Mean unemployment expectations - or the mean probability that the U.S. unemployment rate will be higher one year from now - decreased by 1.1 percentage points to 36.1%, the lowest reading since February 2022. Additionally, the median one-year-ahead expected earnings growth was unchanged at 2.8%, remaining slightly below its 12-month trailing average of 2.9%.
Turning to household finance, we find the following:
The median expected growth in household income remained unchanged at 3.1%. The series has been moving within a narrow range of 2.9% to 3.3% since January 2023, and remains above the February 2020 pre-pandemic level of 2.7%.
Median household spending growth expectations increased by 0.2 percentage point to 5.2%. The increase was driven by respondents with a high school degree or less.
Median year-ahead expected growth in government debt increased to 9.3% from 8.9%.
The mean perceived probability that the average interest rate on saving accounts will be higher in 12 months increased by 0.6 percentage point to 26.1%, remaining below its 12-month trailing average of 30%.
Perceptions about households’ current financial situations deteriorated somewhat with fewer respondents reporting being better off than a year ago. Year-ahead expectations also deteriorated marginally with a smaller share of respondents expecting to be better off and a slightly larger share of respondents expecting to be worse off a year from now.
The mean perceived probability that U.S. stock prices will be higher 12 months from now increased by 1.4 percentage point to 38.9%.
At the same time, perceptions and expectations about credit access turned less optimistic: "Perceptions of credit access compared to a year ago deteriorated with a larger share of respondents reporting tighter conditions and a smaller share reporting looser conditions compared to a year ago."
Also, a smaller percentage of consumers, 11.45% vs 12.14% in prior month, expect to not be able to make minimum debt payment over the next three months
Last, and perhaps most humorous, is the now traditional cognitive dissonance one observes with these polls, because at a time when long-term inflation expectations jumped, which clearly suggests that financial conditions will need to be tightened, the number of respondents expecting higher stock prices one year from today jumped to the highest since November 2021... which incidentally is just when the market topped out during the last cycle before suffering a painful bear market.
Homes listed for sale in early June sell for $7,700 more
New Zillow research suggests the spring home shopping season may see a second wave this summer if mortgage rates fall
The post Homes listed for sale in…
A Zillow analysis of 2023 home sales finds homes listed in the first two weeks of June sold for 2.3% more.
The best time to list a home for sale is a month later than it was in 2019, likely driven by mortgage rates.
The best time to list can be as early as the second half of February in San Francisco, and as late as the first half of July in New York and Philadelphia.
Spring home sellers looking to maximize their sale price may want to wait it out and list their home for sale in the first half of June. A new Zillow® analysis of 2023 sales found that homes listed in the first two weeks of June sold for 2.3% more, a $7,700 boost on a typical U.S. home.
The best time to list consistently had been early May in the years leading up to the pandemic. The shift to June suggests mortgage rates are strongly influencing demand on top of the usual seasonality that brings buyers to the market in the spring. This home-shopping season is poised to follow a similar pattern as that in 2023, with the potential for a second wave if the Federal Reserve lowers interest rates midyear or later.
The 2.3% sale price premium registered last June followed the first spring in more than 15 years with mortgage rates over 6% on a 30-year fixed-rate loan. The high rates put home buyers on the back foot, and as rates continued upward through May, they were still reassessing and less likely to bid boldly. In June, however, rates pulled back a little from 6.79% to 6.67%, which likely presented an opportunity for determined buyers heading into summer. More buyers understood their market position and could afford to transact, boosting competition and sale prices.
The old logic was that sellers could earn a premium by listing in late spring, when search activity hit its peak. Now, with persistently low inventory, mortgage rate fluctuations make their own seasonality. First-time home buyers who are on the edge of qualifying for a home loan may dip in and out of the market, depending on what’s happening with rates. It is almost certain the Federal Reserve will push back any interest-rate cuts to mid-2024 at the earliest. If mortgage rates follow, that could bring another surge of buyers later this year.
Mortgage rates have been impacting affordability and sale prices since they began rising rapidly two years ago. In 2022, sellers nationwide saw the highest sale premium when they listed their home in late March, right before rates barreled past 5% and continued climbing.
Zillow’s research finds the best time to list can vary widely by metropolitan area. In 2023, it was as early as the second half of February in San Francisco, and as late as the first half of July in New York. Thirty of the top 35 largest metro areas saw for-sale listings command the highest sale prices between May and early July last year.
Zillow also found a wide range in the sale price premiums associated with homes listed during those peak periods. At the hottest time of the year in San Jose, homes sold for 5.5% more, a $88,000 boost on a typical home. Meanwhile, homes in San Antonio sold for 1.9% more during that same time period.
We use cookies on our website to give you the most relevant experience by remembering your preferences and repeat visits. By clicking “Accept”, you consent to the use of ALL the cookies.
This website uses cookies to improve your experience while you navigate through the website. Out of these, the cookies that are categorized as necessary are stored on your browser as they are essential for the working of basic functionalities of the website. We also use third-party cookies that help us analyze and understand how you use this website. These cookies will be stored in your browser only with your consent. You also have the option to opt-out of these cookies. But opting out of some of these cookies may affect your browsing experience.
Necessary cookies are absolutely essential for the website to function properly. These cookies ensure basic functionalities and security features of the website, anonymously.
Cookie
Duration
Description
cookielawinfo-checbox-analytics
11 months
This cookie is set by GDPR Cookie Consent plugin. The cookie is used to store the user consent for the cookies in the category "Analytics".
cookielawinfo-checbox-functional
11 months
The cookie is set by GDPR cookie consent to record the user consent for the cookies in the category "Functional".
cookielawinfo-checbox-others
11 months
This cookie is set by GDPR Cookie Consent plugin. The cookie is used to store the user consent for the cookies in the category "Other.
cookielawinfo-checkbox-necessary
11 months
This cookie is set by GDPR Cookie Consent plugin. The cookies is used to store the user consent for the cookies in the category "Necessary".
cookielawinfo-checkbox-performance
11 months
This cookie is set by GDPR Cookie Consent plugin. The cookie is used to store the user consent for the cookies in the category "Performance".
viewed_cookie_policy
11 months
The cookie is set by the GDPR Cookie Consent plugin and is used to store whether or not user has consented to the use of cookies. It does not store any personal data.
Functional cookies help to perform certain functionalities like sharing the content of the website on social media platforms, collect feedbacks, and other third-party features.
Performance cookies are used to understand and analyze the key performance indexes of the website which helps in delivering a better user experience for the visitors.
Analytical cookies are used to understand how visitors interact with the website. These cookies help provide information on metrics the number of visitors, bounce rate, traffic source, etc.
Advertisement cookies are used to provide visitors with relevant ads and marketing campaigns. These cookies track visitors across websites and collect information to provide customized ads.


