Uncategorized
Is the housing recession over?
Housing starts are surging today and builders’ confidence is rising. Does this mean the housing recession is over?
Share this:

Housing starts are surging today and the builder’s confidence data is now in expansion territory. Does this mean the housing recession is over?
As I have said many times over the last few months, the builders are efficient sellers and they’re taking advantage of an existing home sales market that is suffering from low inventory and higher mortgage rates. Tuesday’s solid housing starts print, combined with yesterday’s builder’s confidence data, shows a housing market back in expansion mode, but the permits haven’t risen yet, which is the missing piece of getting housing out of a recession.
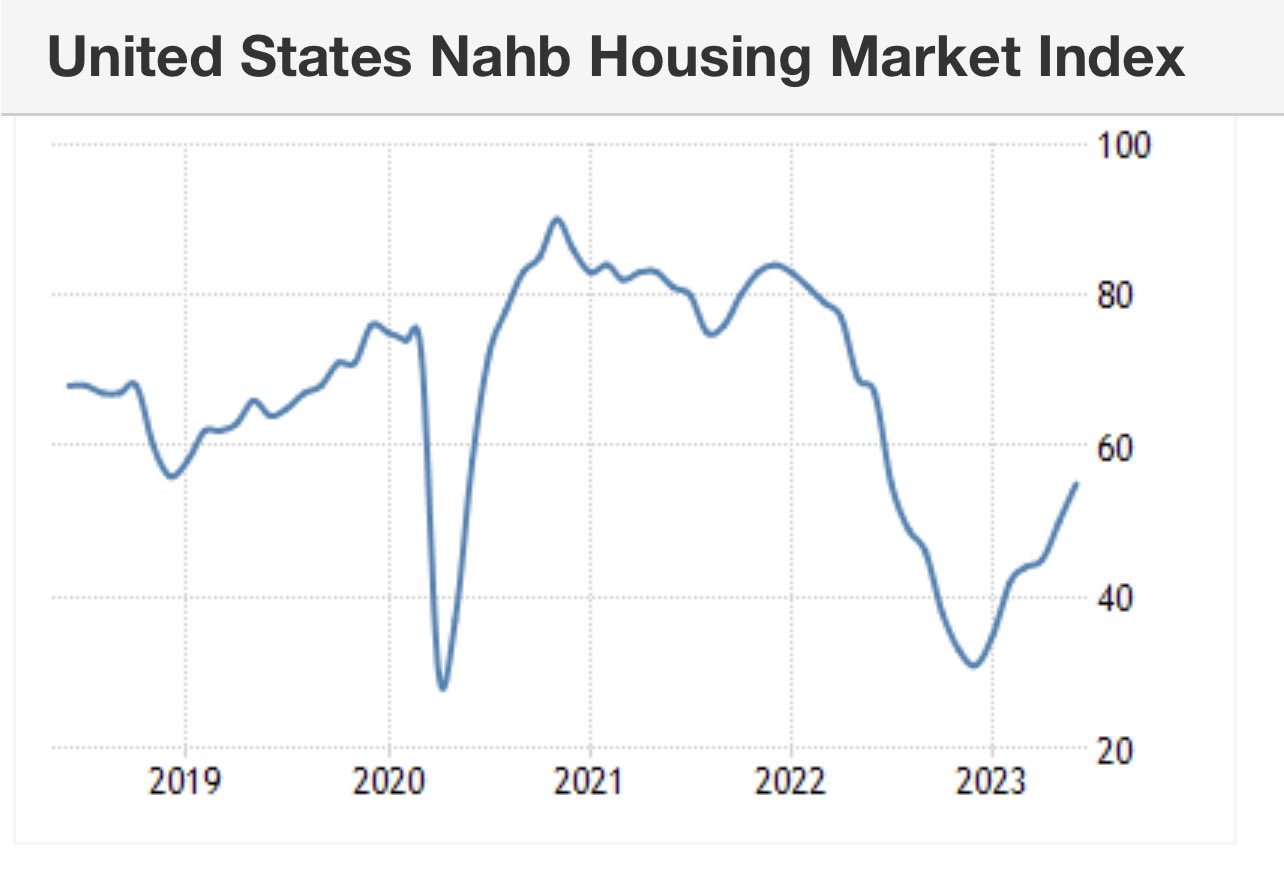
The builders confidence index came out yesterday and it’s all smiles lately, as the builders believe they can sell more homes. Historically speaking, the key level for builders confidence is 50: Anything below 50 is a recession and anything above 50 is an expansion. As you can see below, we broke over 50 yesterday as the index came in at 55.
Tuesday’s massive housing starts print will get revised lower, but the trend for the homebuilders, new home sales, and builders’ confidence has been intact since November of 2022.
Let’s look at the housing starts data and make sense of it all.
From Census: Housing starts: Privately‐owned housing starts in May were at a seasonally adjusted annual rate of 1,631,000. This is 21.7 percent (±14.8 percent) above the revised April estimate of 1,340,000 and is 5.7 percent (±10.8 percent)* above the May 2022 rate of 1,543,000. Single‐family housing starts in May were at a rate of 997,000; this is 18.5 percent (±14.1 percent) above the revised April figure of 841,000. The May rate for units in buildings with five units or more was 624,000.
This was an extreme month-to-month print on housing starts. It is likely to be revised lower as this has always been the case with really big housing starts prints — both positive and negative. It was a such a shocking print that a few economic bears kicked their recession call out to 2024 because housing is traditionally a leading economic indicator.
Housing Completions: Privately‐owned housing completions in May were at a seasonally adjusted annual rate of 1,518,000. This is 9.5 percent (±12.3 percent)* above the revised April estimate of 1,386,000 and is 5.0 percent (±13.0 percent)* above the May 2022 rate of 1,446,000. Single‐family housing completions in May were at a rate of 1,009,000; this is 3.9 percent (±13.9 percent)* above the revised April rate of 971,000. The May rate for units in buildings with five units or more was 493,000.
Housing completion data is still the saddest housing data line we have, but it also shows how different the housing market is now versus when housing crashed in 2008. Housing completions have been prolonged and still need to be faster: As you can see in the chart below, we haven’t gone anywhere for some time.
Unlike the housing bubble years when starts, permits, and completions were moving up and down, this time the lagging caused by COVID-19 delays is evident. However, we are past COVID-19 time, and this data line is still slower than my tortoise Grundy. 
Building Permits: Privately‐owned housing units authorized by building permits in May were at a seasonally adjusted annual rate of 1,491,000. This is 5.2 percent above the revised April rate of 1,417,000, but is 12.7 percent below the May 2022 rate of 1,708,000. Single‐family authorizations in May were at a rate of 897,000; this is 4.8 percent above the revised April figure of 856,000. Authorizations of units in buildings with five units or more were at a rate of 542,000 in May.
The missing link to ending the housing recession is housing permits. Traditionally in all expansions, housing permits are rising wildly when builders’ confidence is bouncing hard off the bottom. Permits just haven’t gotten there yet, and for a good reason. First, as you can see below, housing permits have stabilized for sure but haven’t taken off yet.
I have a straightforward model for when the homebuilders will start issuing new permits with some kick. My rule of thumb for anticipating builder behavior is based on the three-month supply average. This has nothing to do with the existing home sales market — this monthly supply data only applies to the new home sales market, and the current 7.6 months are too high for the builders to issue new permits with any kick and duration.
- When supply is 4.3 months and below, this is an excellent market for builders.
- When supply is 4.4-6.4 months, this is just an OK market for builders. They will build as long as new home sales are growing.
- When the supply is 6.5 months and above, the builders will pull back on construction.
As you can see below, builders have made good progress getting the monthly supply down, but they are just not able to get a strong push on permits yet, as they are still working off their backlog. Some of those homes haven’t even started construction yet.
Many people use housing as a leading indicator of the U.S. going in and out of a recession. As you can imagine, with the builders’ confidence rising so much and now housing starts with a giant print, some are beginning to question their recession call for 2023.
For me, it’s all about permits and demand growth, and we are working our way back to normal for this sector, we’re just not there yet. Can you imagine a housing market with mortgage rates at 5% instead of 7%? A lot of housing data would firm up more with lower mortgage rates.
The builders have some significant advantages in selling their homes because they sell them as a commodity and don’t have to deal with some of the issues that the traditional home seller has to deal with. In a high mortgage rate environment, they can offer lower rates and peel off some buyers who would generally go into the existing home sales market.
All in all, this was a shocking report on the headline. However, when you dig a bit deeper, it shows the positive housing trend that started in November of 2022 continues, but more work needs to be done.
Uncategorized
One city held a mass passport-getting event
A New Orleans congressman organized a way for people to apply for their passports en masse.
Share this:


While the number of Americans who do not have a passport has dropped steadily from more than 80% in 1990 to just over 50% now, a lack of knowledge around passport requirements still keeps a significant portion of the population away from international travel.
Over the four years that passed since the start of covid-19, passport offices have also been dealing with significant backlog due to the high numbers of people who were looking to get a passport post-pandemic.
Related: Here is why it is (still) taking forever to get a passport
To deal with these concurrent issues, the U.S. State Department recently held a mass passport-getting event in the city of New Orleans. Called the "Passport Acceptance Event," the gathering was held at a local auditorium and invited residents of Louisiana’s 2nd Congressional District to complete a passport application on-site with the help of staff and government workers.
'Come apply for your passport, no appointment is required'
"Hey #LA02," Rep. Troy A. Carter Sr. (D-LA), whose office co-hosted the event alongside the city of New Orleans, wrote to his followers on Instagram (META) . "My office is providing passport services at our #PassportAcceptance event. Come apply for your passport, no appointment is required."
More Travel:
- A new travel term is taking over the internet (and reaching airlines and hotels)
- The 10 best airline stocks to buy now
- Airlines see a new kind of traveler at the front of the plane
The event was held on March 14 from 10 a.m. to 1 p.m. While it was designed for those who are already eligible for U.S. citizenship rather than as a way to help non-citizens with immigration questions, it helped those completing the application for the first time fill out forms and make sure they have the photographs and identity documents they need. The passport offices in New Orleans where one would normally have to bring already-completed forms have also been dealing with lines and would require one to book spots weeks in advance.
These are the countries with the highest-ranking passports in 2024
According to Carter Sr.'s communications team, those who submitted their passport application at the event also received expedited processing of two to three weeks (according to the State Department's website, times for regular processing are currently six to eight weeks).
While Carter Sr.'s office has not released the numbers of people who applied for a passport on March 14, photos from the event show that many took advantage of the opportunity to apply for a passport in a group setting and get expedited processing.
Every couple of months, a new ranking agency puts together a list of the most and least powerful passports in the world based on factors such as visa-free travel and opportunities for cross-border business.
In January, global citizenship and financial advisory firm Arton Capital identified United Arab Emirates as having the most powerful passport in 2024. While the United States topped the list of one such ranking in 2014, worsening relations with a number of countries as well as stricter immigration rules even as other countries have taken strides to create opportunities for investors and digital nomads caused the American passport to slip in recent years.
A UAE passport grants holders visa-free or visa-on-arrival access to 180 of the world’s 198 countries (this calculation includes disputed territories such as Kosovo and Western Sahara) while Americans currently have the same access to 151 countries.
stocks pandemic covid-19 grantsUncategorized
Fast-food chain closes restaurants after Chapter 11 bankruptcy
Several major fast-food chains recently have struggled to keep restaurants open.
Share this:


Competition in the fast-food space has been brutal as operators deal with inflation, consumers who are worried about the economy and their jobs and, in recent months, the falling cost of eating at home.
Add in that many fast-food chains took on more debt during the covid pandemic and that labor costs are rising, and you have a perfect storm of problems.
It's a situation where Restaurant Brands International (QSR) has suffered as much as any company.
Related: Wendy's menu drops a fan favorite item, adds something new
Three major Burger King franchise operators filed for bankruptcy in 2023, and the chain saw hundreds of stores close. It also saw multiple Popeyes franchisees move into bankruptcy, with dozens of locations closing.
RBI also stepped in and purchased one of its key franchisees.
"Carrols is the largest Burger King franchisee in the United States today, operating 1,022 Burger King restaurants in 23 states that generated approximately $1.8 billion of system sales during the 12 months ended Sept. 30, 2023," RBI said in a news release. Carrols also owns and operates 60 Popeyes restaurants in six states."
The multichain company made the move after two of its large franchisees, Premier Kings and Meridian, saw multiple locations not purchased when they reached auction after Chapter 11 bankruptcy filings. In that case, RBI bought select locations but allowed others to close.
Image source: Chen Jianli/Xinhua via Getty
Another fast-food chain faces bankruptcy problems
Bojangles may not be as big a name as Burger King or Popeye's, but it's a popular chain with more than 800 restaurants in eight states.
"Bojangles is a Carolina-born restaurant chain specializing in craveable Southern chicken, biscuits and tea made fresh daily from real recipes, and with a friendly smile," the chain says on its website. "Founded in 1977 as a single location in Charlotte, our beloved brand continues to grow nationwide."
Like RBI, Bojangles uses a franchise model, which makes it dependent on the financial health of its operators. The company ultimately saw all its Maryland locations close due to the financial situation of one of its franchisees.
Unlike. RBI, Bojangles is not public — it was taken private by Durational Capital Management LP and Jordan Co. in 2018 — which means the company does not disclose its financial information to the public.
That makes it hard to know whether overall softness for the brand contributed to the chain seeing its five Maryland locations after a Chapter 11 bankruptcy filing.
Bojangles has a messy bankruptcy situation
Even though the locations still appear on the Bojangles website, they have been shuttered since late 2023. The locations were operated by Salim Kakakhail and Yavir Akbar Durranni. The partners operated under a variety of LLCs, including ABS Network, according to local news channel WUSA9.
The station reported that the owners face a state investigation over complaints of wage theft and fraudulent W2s. In November Durranni and ABS Network filed for bankruptcy in New Jersey, WUSA9 reported.
"Not only do former employees say these men owe them money, WUSA9 learned the former owners owe the state, too, and have over $69,000 in back property taxes."
Former employees also say that the restaurant would regularly purchase fried chicken from Popeyes and Safeway when it ran out in their stores, the station reported.
Bojangles sent the station a comment on the situation.
"The franchisee is no longer in the Bojangles system," the company said. "However, it is important to note in your coverage that franchisees are independent business owners who are licensed to operate a brand but have autonomy over many aspects of their business, including hiring employees and payroll responsibilities."
Kakakhail and Durranni did not respond to multiple requests for comment from WUSA9.
bankruptcy pandemicUncategorized
Industrial Production Increased 0.1% in February
From the Fed: Industrial Production and Capacity Utilization
Industrial production edged up 0.1 percent in February after declining 0.5 percent in January. In February, the output of manufacturing rose 0.8 percent and the index for mining climbed 2.2 p…
Share this:


Industrial production edged up 0.1 percent in February after declining 0.5 percent in January. In February, the output of manufacturing rose 0.8 percent and the index for mining climbed 2.2 percent. Both gains partly reflected recoveries from weather-related declines in January. The index for utilities fell 7.5 percent in February because of warmer-than-typical temperatures. At 102.3 percent of its 2017 average, total industrial production in February was 0.2 percent below its year-earlier level. Capacity utilization for the industrial sector remained at 78.3 percent in February, a rate that is 1.3 percentage points below its long-run (1972–2023) average.Click on graph for larger image.
emphasis added
This graph shows Capacity Utilization. This series is up from the record low set in April 2020, and above the level in February 2020 (pre-pandemic).
Capacity utilization at 78.3% is 1.3% below the average from 1972 to 2022. This was below consensus expectations.
Note: y-axis doesn't start at zero to better show the change.
 The second graph shows industrial production since 1967.
Industrial production increased to 102.3. This is above the pre-pandemic level.
Industrial production was above consensus expectations.


Key shipping company files for Chapter 11 bankruptcy


These Cities Have The Highest (And Lowest) Share Of Unaffordable Neighborhoods In 2024


The Question You Should Ask Whenever You’re Wrong


Tight inventory and frustrated buyers challenge agents in Virginia


Part 1: Current State of the Housing Market; Overview for mid-March 2024


Industrial Production Increased 0.1% in February


Walmart and Target make key self-checkout changes to fight theft


Your financial plan may be riskier without bitcoin
Key shipping company files Chapter 11 bankruptcy


The best real estate coaching programs for 2024
-

 Uncategorized3 weeks ago
All Of The Elements Are In Place For An Economic Crisis Of Staggering Proportions
-

 International1 week ago
EyePoint poaches medical chief from Apellis; Sandoz CFO, longtime BioNTech exec to retire
-

 Uncategorized4 weeks ago
California Counties Could Be Forced To Pay $300 Million To Cover COVID-Era Program
-

 Uncategorized3 weeks ago
Apparel Retailer Express Moving Toward Bankruptcy
-

 Uncategorized4 weeks ago
Industrial Production Decreased 0.1% in January
-

 International1 week ago
Walmart launches clever answer to Target’s new membership program
-

 Spread & Containment2 days ago
IFM’s Hat Trick and Reflections On Option-To-Buy M&A
-

 Uncategorized4 weeks ago
RFK Jr: The Wuhan Cover-Up & The Rise Of The Biowarfare-Industrial Complex