Connect with us

Inflation In Context: A Liquidity Adjusted CPI Index

First, folks, please send your prayers, thoughts, good feelings, positive energy, miracles, healing touch, whatever you got, and whatever it takes to GMM’s beloved Carol K., who keeps battling, never giving up against a serious disease in Boston at…

Published

on

First, folks, please send your prayers, thoughts, good feelings, positive energy, miracles, healing touch, whatever you got, and whatever it takes to GMM’s beloved Carol K., who keeps battling, never giving up against a serious disease in Boston at one, if not the best hospital in the world.  Even in her critical condition, she contributed to this post — though she may not agree with all its final points.  She’s truly an amazing and incredibly strong human being.  Semper Fi and Godspeed, CK.  

We had a few requests to write up something about today’s hot U.S consumer price inflation data. So we put together a quick note in honor of our friend from down in the Land of Oz, GMac, one of the most decent human beings on earth. He is one proud father of a super studly 18-year son, who is an incredible surfer and someday wants to surf Mavericks.  God. Bless. His. Soul.

Let us preface our inflation note with one of our favorite quotes:

World War II was transitory – GMM

Recall our post in January, Ready For 4 Percent CPI By Mid-Year?, when we speculated the U.S. would be experiencing 4 percent inflation, possibly 5 percent by mid-year.  We were beaten down like a red-headed stepchild (I am at liberty to say that as I have been a ginger most of my life).

GMM was also one of the first to point out the base effects (12-month comps) would kick in April and May 2021 due to the deflation that troughed last year from the COVID crash.  But don’t be gaslighted the lastest few month-on-month core prints essentially negate the base effect excuse for high inflation as three-month core CPI is now running at 7.9 percent on an annual basis.

We don’t know for certain if inflation will stick and move higher or lower but as better folk we are taking the over, however.

Liquidity Tsunami

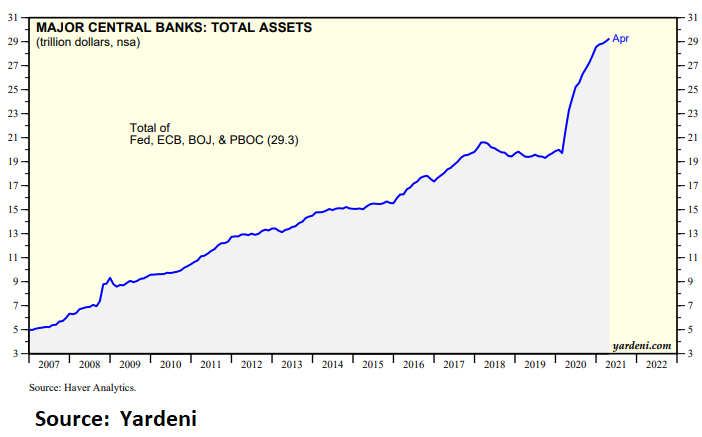
We do know the major global central banks have pumped in a shitload of high-powered money into the global financial system over the past year — as in around $10 trillion, close 50 percent increse of their collective balance sheets.   Here’s Dr. Ed’s excellent chart,

Moreover, banks now seem eager to start lending, thus creating more endogenous money on top of the trillions upon trillions of base money central banks have already injected.

Transitory?  Yeah, right.   

It’s not a question whether the Fed has the tools to reign it in, it’s do they have the ‘nads?  Given the multiple asset bubbles that would burst, and bust spectacularly, if the Fed draws it word,  we seriously doubt it. 

The following chart from Dr. Ed also illustrates not only has the digital printing press been working overtime, the credit system is just fine and dandy as deposits are expanding.  Don’t be confused by, yes, the base effect, as the money aggregates have a much large base to grow from they did a year ago before the pandemic.

Tough to beat comps after expanding over 25 percent 

Note, these are monetary aggregates, which include cash in circulation, bank deposits among near money and other short-term time deposits, not the expansion of the Fed’s balance sheet, though it does hugely influence the data.  

This image has an empty alt attribute; its file name is yardeni.png

Big spurts from the digital printing press without a credit crisis and an impaired financial system — as was the case after the Great Financial Crisis — will almost always generate inflationary pressures.   Stimulating demand without production during a supply shock is not optimal unless carefully targeted to those who need it most.   

It’s very amusing to us to see the FinTweets, “peak inflation has arrived.”  True, if the financial markets crash.  But what do they base their conclusion on?  A warm feeling in their tummy?   

Show me the money data, Jerry.  

Banks Itching To Lend

Banks now seem eager to start lending, thus creating more endogenous money on top of the trillions of base money central banks have injected.  

Loans are “starting to pick up,” and there’s plenty of borrowing capacity because companies have unused credit lines, {BofA CEO Brian ]Moynihan said. Loan growth has been a challenge across the banking industry because many consumers and businesses are sitting on cash from savings and stimulus during the pandemic. – Bloomberg, June 6

This should send shivers up the Fed’s spine, but we are not so sure.  We are also not so sure they are not flying blind and will again miss the next big one just as they have in the past. 

The Chart: Liquidity Adjusted Inflation. 

It’s late and we want to present the chart in honor of GMac. 

We have taken the non seasonaly adjusted year-on-year change of CPI and subtracted a scaled up version of the Chicago Fed’s  National Financial Conditions Index (NFCI), which measures how loose or tight monetary conditions are in the U.S..  It’s has been running at an extreme historical low — i.e., very loose financial conditions.   

You can see the 105 indicators it is based upon here.

We are trying to give context to the inflation data of how loose and accomodative finnancial market and monetary conditions are currently.   As you can see, today’s year-on-year CPI print less the NFCI is at the highest level since November 1990, which was in the middle of the first Gulf war, Where the Fed was facing spiking inflation due to the run-up in oil and a recession.  

Prior to that our adjusted inflation index hasn’t been so high since the high inflation late 197Os and early ‘80s.  Gulp. 

Clearly, it is a different environment in today’s economy.  In fact, just the opposite – the economy is ready to roar for the next several quarters as consumers are flush with cash, the supply chain is still a mess due to the “bullwhip effect” (more on this in a future post), and new businesses should be looking for credit and loans to rebuild and start new ventures.    

Most of all, folks, the central banks still have their pedal to the metal and balls to the walls, and as we all know (well some of us),

Inflation is always and everywhere a monetary phenomenon in the sense that it is and can be produced only by a more rapid increase in the quantity of money than in output. – Milton Friendman 

The Upshot

Inflation is way too high given exremely easy financial and monetary conditions.  There will be blood. 

Finally 

Life is transitory. 

Inflation has eroded my purchasing power in my transitory life.  Bring back the $.35 Big Mac, which was only about 20 percent of the minimum wage.  Now?  About 40-50 percent.  Enough to spark a revolution. 

Finally, the Democrats should begin to worry.

Stay tuned. 

Read More

Continue Reading

Government

Mathematicians use AI to identify emerging COVID-19 variants

Scientists at The Universities of Manchester and Oxford have developed an AI framework that can identify and track new and concerning COVID-19 variants…

Published

on

Scientists at The Universities of Manchester and Oxford have developed an AI framework that can identify and track new and concerning COVID-19 variants and could help with other infections in the future.

Credit: source: https://phil.cdc.gov/Details.aspx?pid=23312

Scientists at The Universities of Manchester and Oxford have developed an AI framework that can identify and track new and concerning COVID-19 variants and could help with other infections in the future.

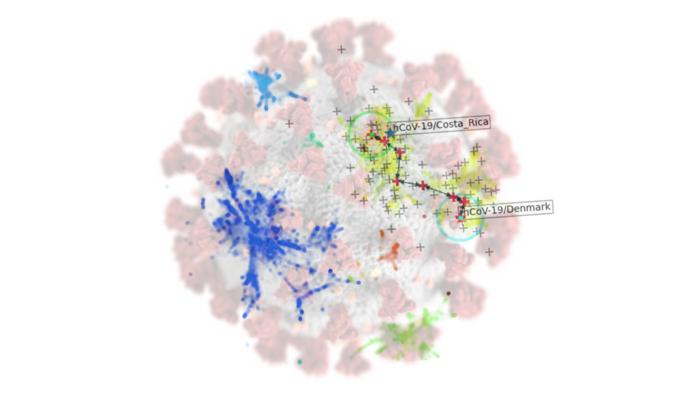
The framework combines dimension reduction techniques and a new explainable clustering algorithm called CLASSIX, developed by mathematicians at The University of Manchester. This enables the quick identification of groups of viral genomes that might present a risk in the future from huge volumes of data.

The study, presented this week in the journal PNAS, could support traditional methods of tracking viral evolution, such as phylogenetic analysis, which currently require extensive manual curation.

Roberto Cahuantzi, a researcher at The University of Manchester and first and corresponding author of the paper, said: “Since the emergence of COVID-19, we have seen multiple waves of new variants, heightened transmissibility, evasion of immune responses, and increased severity of illness.

“Scientists are now intensifying efforts to pinpoint these worrying new variants, such as alpha, delta and omicron, at the earliest stages of their emergence. If we can find a way to do this quickly and efficiently, it will enable us to be more proactive in our response, such as tailored vaccine development and may even enable us to eliminate the variants before they become established.”

Like many other RNA viruses, COVID-19 has a high mutation rate and short time between generations meaning it evolves extremely rapidly. This means identifying new strains that are likely to be problematic in the future requires considerable effort.

Currently, there are almost 16 million sequences available on the GISAID database (the Global Initiative on Sharing All Influenza Data), which provides access to genomic data of influenza viruses.

Mapping the evolution and history of all COVID-19 genomes from this data is currently done using extremely large amounts of computer and human time.

The described method allows automation of such tasks. The researchers processed 5.7 million high-coverage sequences in only one to two days on a standard modern laptop; this would not be possible for existing methods, putting identification of concerning pathogen strains in the hands of more researchers due to reduced resource needs.

Thomas House, Professor of Mathematical Sciences at The University of Manchester, said: “The unprecedented amount of genetic data generated during the pandemic demands improvements to our methods to analyse it thoroughly. The data is continuing to grow rapidly but without showing a benefit to curating this data, there is a risk that it will be removed or deleted.

“We know that human expert time is limited, so our approach should not replace the work of humans all together but work alongside them to enable the job to be done much quicker and free our experts for other vital developments.”

The proposed method works by breaking down genetic sequences of the COVID-19 virus into smaller “words” (called 3-mers) represented as numbers by counting them. Then, it groups similar sequences together based on their word patterns using machine learning techniques.

Stefan Güttel, Professor of Applied Mathematics at the University of Manchester, said: “The clustering algorithm CLASSIX we developed is much less computationally demanding than traditional methods and is fully explainable, meaning that it provides textual and visual explanations of the computed clusters.”

Roberto Cahuantzi added: “Our analysis serves as a proof of concept, demonstrating the potential use of machine learning methods as an alert tool for the early discovery of emerging major variants without relying on the need to generate phylogenies.

“Whilst phylogenetics remains the ‘gold standard’ for understanding the viral ancestry, these machine learning methods can accommodate several orders of magnitude more sequences than the current phylogenetic methods and at a low computational cost.”


Read More

Continue Reading

International

There will soon be one million seats on this popular Amtrak route

“More people are taking the train than ever before,” says Amtrak’s Executive Vice President.

Published

on

While the size of the United States makes it hard for it to compete with the inter-city train access available in places like Japan and many European countries, Amtrak trains are a very popular transportation option in certain pockets of the country — so much so that the country’s national railway company is expanding its Northeast Corridor by more than one million seats.

Related: This is what it's like to take a 19-hour train from New York to Chicago

Running from Boston all the way south to Washington, D.C., the route is one of the most popular as it passes through the most densely populated part of the country and serves as a commuter train for those who need to go between East Coast cities such as New York and Philadelphia for business.

Veronika Bondarenko captured this photo of New York’s Moynihan Train Hall. 

Veronika Bondarenko

Amtrak launches new routes, promises travelers ‘additional travel options’

Earlier this month, Amtrak announced that it was adding four additional Northeastern routes to its schedule — two more routes between New York’s Penn Station and Union Station in Washington, D.C. on the weekend, a new early-morning weekday route between New York and Philadelphia’s William H. Gray III 30th Street Station and a weekend route between Philadelphia and Boston’s South Station.

More Travel:

According to Amtrak, these additions will increase Northeast Corridor’s service by 20% on the weekdays and 10% on the weekends for a total of one million additional seats when counted by how many will ride the corridor over the year.

“More people are taking the train than ever before and we’re proud to offer our customers additional travel options when they ride with us on the Northeast Regional,” Amtrak Executive Vice President and Chief Commercial Officer Eliot Hamlisch said in a statement on the new routes. “The Northeast Regional gets you where you want to go comfortably, conveniently and sustainably as you breeze past traffic on I-95 for a more enjoyable travel experience.”

Here are some of the other Amtrak changes you can expect to see

Amtrak also said that, in the 2023 financial year, the Northeast Corridor had nearly 9.2 million riders — 8% more than it had pre-pandemic and a 29% increase from 2022. The higher demand, particularly during both off-peak hours and the time when many business travelers use to get to work, is pushing Amtrak to invest into this corridor in particular.

To reach more customers, Amtrak has also made several changes to both its routes and pricing system. In the fall of 2023, it introduced a type of new “Night Owl Fare” — if traveling during very late or very early hours, one can go between cities like New York and Philadelphia or Philadelphia and Washington. D.C. for $5 to $15.

As travel on the same routes during peak hours can reach as much as $300, this was a deliberate move to reach those who have the flexibility of time and might have otherwise preferred more affordable methods of transportation such as the bus. After seeing strong uptake, Amtrak added this type of fare to more Boston routes.

The largest distances, such as the ones between Boston and New York or New York and Washington, are available at the lowest rate for $20.

Read More

Continue Reading

International

The next pandemic? It’s already here for Earth’s wildlife

Bird flu is decimating species already threatened by climate change and habitat loss.

I am a conservation biologist who studies emerging infectious diseases. When people ask me what I think the next pandemic will be I often say that we are in the midst of one – it’s just afflicting a great many species more than ours.

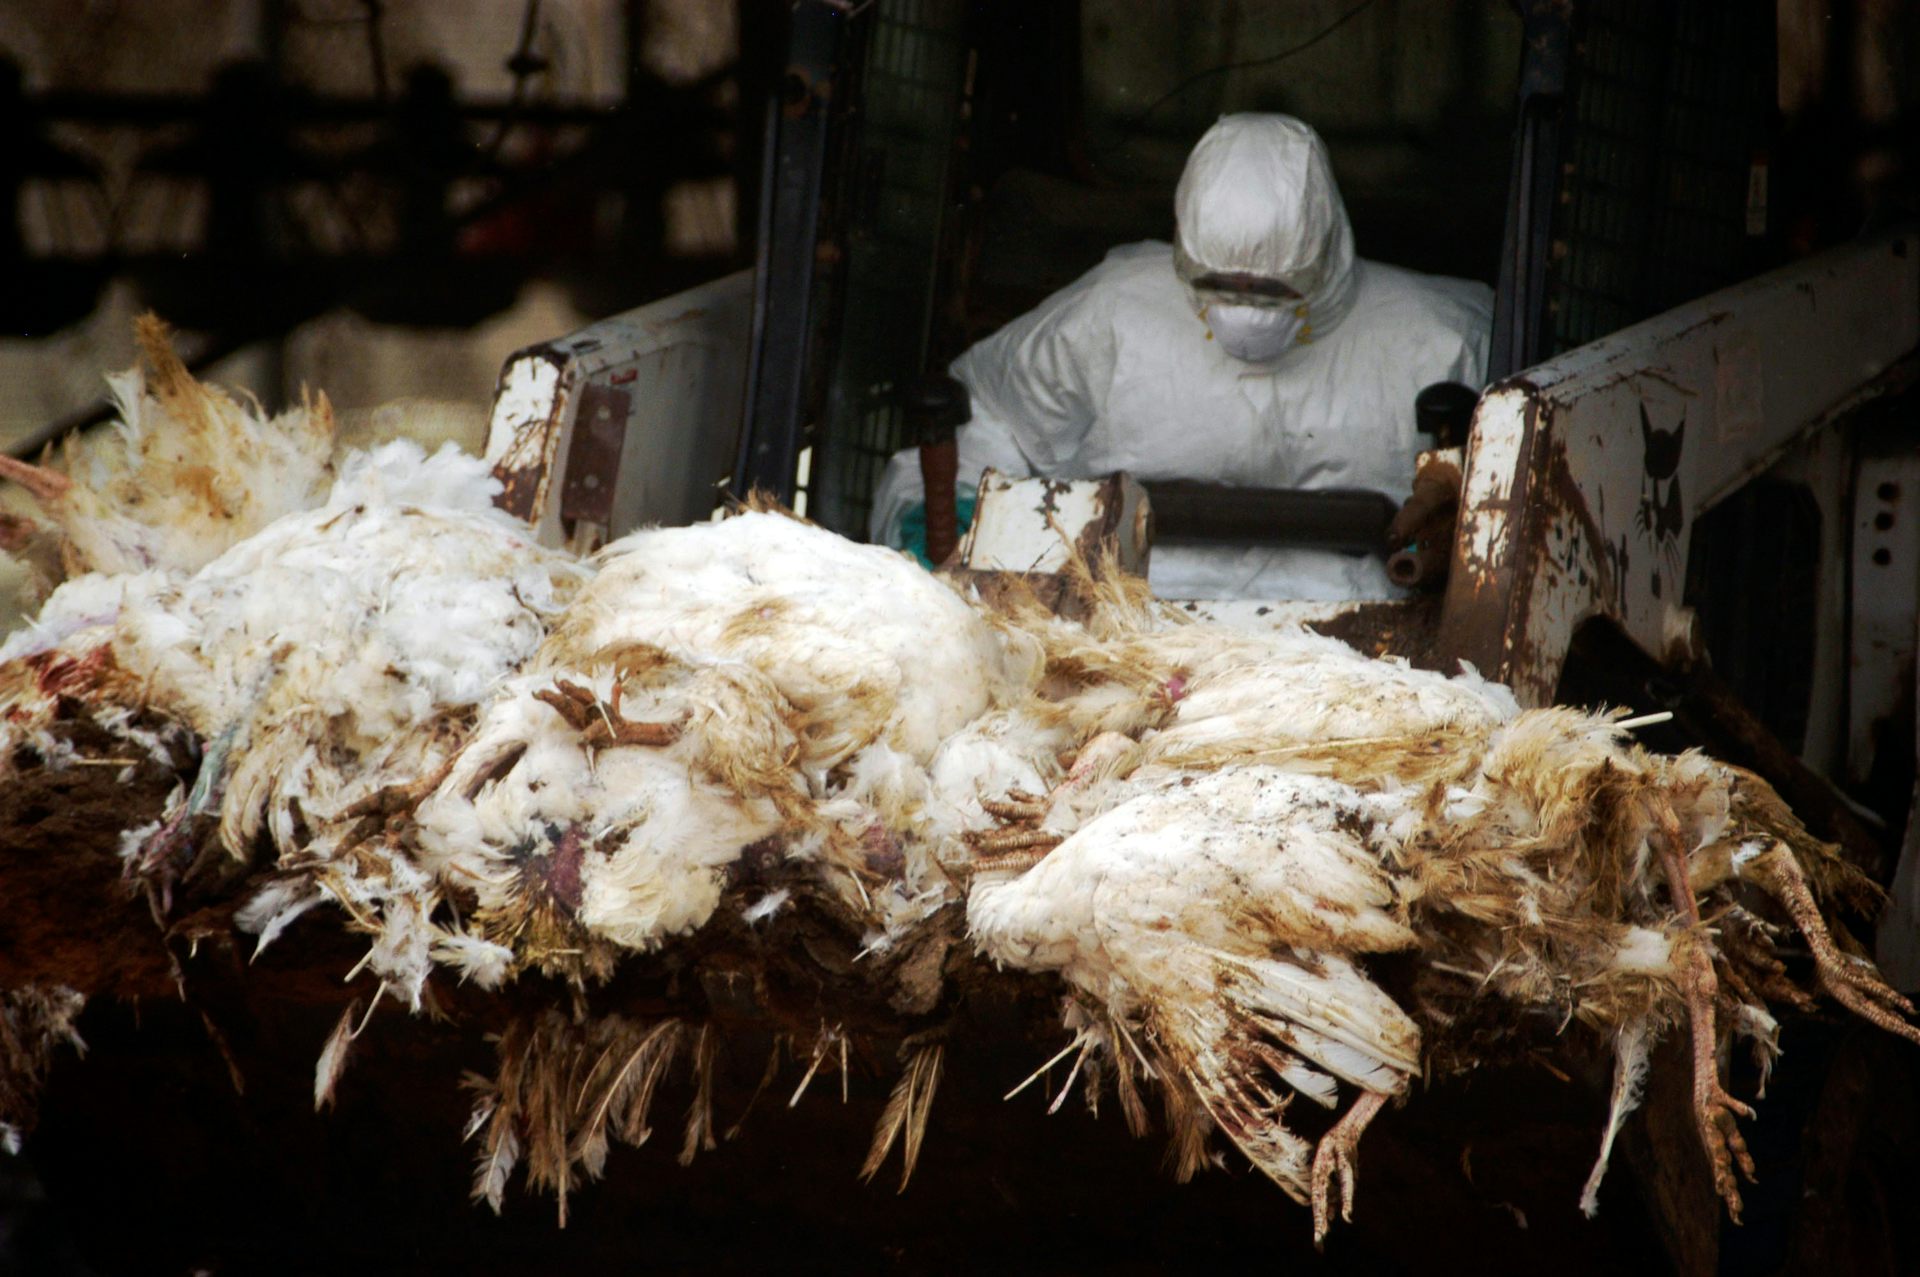
I am referring to the highly pathogenic strain of avian influenza H5N1 (HPAI H5N1), otherwise known as bird flu, which has killed millions of birds and unknown numbers of mammals, particularly during the past three years.

This is the strain that emerged in domestic geese in China in 1997 and quickly jumped to humans in south-east Asia with a mortality rate of around 40-50%. My research group encountered the virus when it killed a mammal, an endangered Owston’s palm civet, in a captive breeding programme in Cuc Phuong National Park Vietnam in 2005.

How these animals caught bird flu was never confirmed. Their diet is mainly earthworms, so they had not been infected by eating diseased poultry like many captive tigers in the region.

This discovery prompted us to collate all confirmed reports of fatal infection with bird flu to assess just how broad a threat to wildlife this virus might pose.

This is how a newly discovered virus in Chinese poultry came to threaten so much of the world’s biodiversity.

H5N1 originated on a Chinese poultry farm in 1997. ChameleonsEye/Shutterstock

The first signs

Until December 2005, most confirmed infections had been found in a few zoos and rescue centres in Thailand and Cambodia. Our analysis in 2006 showed that nearly half (48%) of all the different groups of birds (known to taxonomists as “orders”) contained a species in which a fatal infection of bird flu had been reported. These 13 orders comprised 84% of all bird species.

We reasoned 20 years ago that the strains of H5N1 circulating were probably highly pathogenic to all bird orders. We also showed that the list of confirmed infected species included those that were globally threatened and that important habitats, such as Vietnam’s Mekong delta, lay close to reported poultry outbreaks.

Mammals known to be susceptible to bird flu during the early 2000s included primates, rodents, pigs and rabbits. Large carnivores such as Bengal tigers and clouded leopards were reported to have been killed, as well as domestic cats.

Our 2006 paper showed the ease with which this virus crossed species barriers and suggested it might one day produce a pandemic-scale threat to global biodiversity.

Unfortunately, our warnings were correct.

A roving sickness

Two decades on, bird flu is killing species from the high Arctic to mainland Antarctica.

In the past couple of years, bird flu has spread rapidly across Europe and infiltrated North and South America, killing millions of poultry and a variety of bird and mammal species. A recent paper found that 26 countries have reported at least 48 mammal species that have died from the virus since 2020, when the latest increase in reported infections started.

Not even the ocean is safe. Since 2020, 13 species of aquatic mammal have succumbed, including American sea lions, porpoises and dolphins, often dying in their thousands in South America. A wide range of scavenging and predatory mammals that live on land are now also confirmed to be susceptible, including mountain lions, lynx, brown, black and polar bears.

The UK alone has lost over 75% of its great skuas and seen a 25% decline in northern gannets. Recent declines in sandwich terns (35%) and common terns (42%) were also largely driven by the virus.

Scientists haven’t managed to completely sequence the virus in all affected species. Research and continuous surveillance could tell us how adaptable it ultimately becomes, and whether it can jump to even more species. We know it can already infect humans – one or more genetic mutations may make it more infectious.

At the crossroads

Between January 1 2003 and December 21 2023, 882 cases of human infection with the H5N1 virus were reported from 23 countries, of which 461 (52%) were fatal.

Of these fatal cases, more than half were in Vietnam, China, Cambodia and Laos. Poultry-to-human infections were first recorded in Cambodia in December 2003. Intermittent cases were reported until 2014, followed by a gap until 2023, yielding 41 deaths from 64 cases. The subtype of H5N1 virus responsible has been detected in poultry in Cambodia since 2014. In the early 2000s, the H5N1 virus circulating had a high human mortality rate, so it is worrying that we are now starting to see people dying after contact with poultry again.

It’s not just H5 subtypes of bird flu that concern humans. The H10N1 virus was originally isolated from wild birds in South Korea, but has also been reported in samples from China and Mongolia.

Recent research found that these particular virus subtypes may be able to jump to humans after they were found to be pathogenic in laboratory mice and ferrets. The first person who was confirmed to be infected with H10N5 died in China on January 27 2024, but this patient was also suffering from seasonal flu (H3N2). They had been exposed to live poultry which also tested positive for H10N5.

Species already threatened with extinction are among those which have died due to bird flu in the past three years. The first deaths from the virus in mainland Antarctica have just been confirmed in skuas, highlighting a looming threat to penguin colonies whose eggs and chicks skuas prey on. Humboldt penguins have already been killed by the virus in Chile.

A colony of king penguins.
Remote penguin colonies are already threatened by climate change. AndreAnita/Shutterstock

How can we stem this tsunami of H5N1 and other avian influenzas? Completely overhaul poultry production on a global scale. Make farms self-sufficient in rearing eggs and chicks instead of exporting them internationally. The trend towards megafarms containing over a million birds must be stopped in its tracks.

To prevent the worst outcomes for this virus, we must revisit its primary source: the incubator of intensive poultry farms.

Diana Bell does not work for, consult, own shares in or receive funding from any company or organisation that would benefit from this article, and has disclosed no relevant affiliations beyond their academic appointment.

Read More

Continue Reading

Trending