Connect with us

Impact of the COVID-19 pandemic on mental health visits in pediatric primary care

DENVER, April 22, 2022 – A new study describes the impact of the COVID-19 pandemic on pediatric primary care mental health visits. Findings from the…

Published

on

DENVER, April 22, 2022 – A new study describes the impact of the COVID-19 pandemic on pediatric primary care mental health visits. Findings from the study will be presented during the Pediatric Academic Societies (PAS) 2022 Meeting, taking place April 21-25 in Denver.

Credit: Boston Children’s Hospital

DENVER, April 22, 2022 – A new study describes the impact of the COVID-19 pandemic on pediatric primary care mental health visits. Findings from the study will be presented during the Pediatric Academic Societies (PAS) 2022 Meeting, taking place April 21-25 in Denver.


Researchers with Boston Children’s Hospital found that visits to pediatric primary care offices for eating disorder and depressive and bipolar disorder began increasing significantly at the start of the pandemic period, whereas alcohol and substance use disorder visits immediately decreased in frequency and were less frequent over time.


These results reveal an increased burden of mental health care provision in the primary care office since the start of the pandemic and highlight the importance of screening for, provisionally diagnosing, and managing youth mental health conditions in primary care during periods of social isolation. Additional research is needed to further understand the impact of COVID-19 on youth mental health.


“We aimed to describe the impact of the COVID-19 pandemic on pediatric mental health, specifically in terms of visits to primary care,” said Jane Bittner Gould, MPH, CPH, senior project manager at Pediatric Physicians’ Organization at Children’s. “We conducted an interrupted time series analysis of in-network visits among our large pediatric network in Massachusetts. Our findings reveal significant changes in the pattern of visits to primary care offices for mental health conditions in children and adolescents: most notably, striking increases in visits for eating disorders and mood disorders during the pandemic period. Conversely, visits for alcohol and substance use disorders declined during the pandemic period.”


The self-reported mental health impacts of the COVID- 19 pandemic on adults include increased stress, anxiety, and depression. Research on the impact of pandemic-related social changes on the mental health of children and adolescents is more limited.


Ms. Gould will present “Impact of the Coronavirus Disease 2019 Pandemic on Mental Health Visits in Pediatric Primary Care” on Sunday, April 24 at 8:30 a.m. MDT. Reporters interested in an interview with Ms. Gould should contact PAS2022@piercom.com.


The PAS Meeting connects thousands of pediatricians and other health care providers worldwide. For more information about the PAS Meeting, please visit www.pas-meeting.org.


###


About the Pediatric Academic Societies Meeting

The Pediatric Academic Societies (PAS) Meeting is the premier North American scholarly child health meeting. The PAS Meeting connects thousands of pediatricians and other health care providers worldwide. The PAS Meeting is produced through a partnership of four pediatric organizations that are leaders in the advancement of pediatric research and child advocacy: American Pediatric Society, Society for Pediatric Research, Academic Pediatric Association and American Academy of Pediatrics. For more information, please visit www.pas-meeting.org. Follow us on Twitter @PASMeeting, Instagram PASMeeting and #PAS2022, and like us on Facebook PASMeeting. 


Abstract: Impact of the Coronavirus Disease 2019 Pandemic on Mental Health Visits in Pediatric Primary Care


Topic

General Pediatrics: All Areas


Presenting Author

Jane C. Bittner Gould, MPH, CPH


Organization

Boston Children’s Hospital


Background

The self-reported mental health impacts of the coronavirus disease 2019 (COVID- 19) pandemic on adults include increased stress, anxiety, and depression. Research on the impact of pandemic-related social changes on the mental health of children and adolescents is more limited.


Objective

To describe the impact of the COVID-19 pandemic on pediatric primary care mental health visits.


Design/Methods

We used electronic health record data from a pediatric primary care network in Massachusetts to perform an interrupted time series analysis on the rate of pediatric mental health visits before and after the start of the COVID-19 pandemic. Three time periods were defined: the pre-pandemic period (Jan 2019-Feb 2020); the emergency pandemic period (Mar 2020-May 2020); and the pandemic period (Jun 2020-Sep 2021). We assessed pediatric primary care visits, conducted in- person or via telehealth, with network physicians, nurse practitioners, and physician assistants with any of the following visit diagnoses: alcohol and substance use disorders; anxiety disorders; attention-deficit hyperactivity disorders; behavior disorders; depressive and bipolar disorders; eating disorders; and stress/trauma disorders.


Results

A significant increase in slope (P


Conclusion(s)

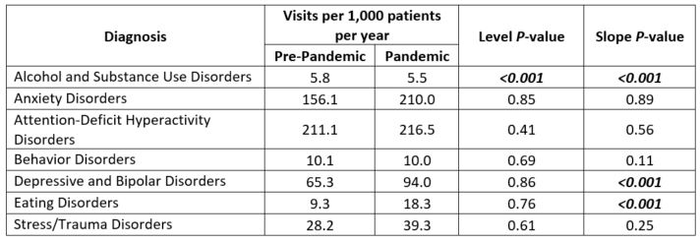
Visits to pediatric primary care offices for eating disorder and depressive and bipolar disorder began increasing significantly at the start of the pandemic period, whereas alcohol and substance use disorder visits immediately decreased in frequency and were less frequent over time. These results reveal an increased burden of mental health care provision in the primary care office since the start of the pandemic and highlight the importance of screening for, provisionally diagnosing, and managing youth mental health conditions in primary care during periods of social isolation. Additional research is needed to further understand the impact of COVID-19 on youth mental health.


Tables and Images

Table 1. Rates of Pediatric Mental Health Visit Diagnoses in the Pre-Pandemic and Pandemic Periods, with an ITS Analysis of Level and Slope Changes

Abbreviation: ITS = Interrupted time series

PAS_Table 1. Rates of Pediatric Mental Health Visit Diagnoses.JPG


Figure 1. Monthly Rates of Seven Pediatric Mental Health Visit Diagnoses, January 2019-September 2021

Symbol: ∆ = Change. The white area represents the pre-pandemic (Jan 2019-Feb 2020); the dark gray represents the emergency pandemic period (Mar 2020-May 2020); and the light gray represents the pandemic period (Jun 2020-Sep 2021). P-values bolded in red highlight statistically significant changes.

PAS_Figure 1. Monthly Rates of Seven Pediatric Mental Health.png


Read More

Continue Reading

International

There will soon be one million seats on this popular Amtrak route

“More people are taking the train than ever before,” says Amtrak’s Executive Vice President.

Published

on

While the size of the United States makes it hard for it to compete with the inter-city train access available in places like Japan and many European countries, Amtrak trains are a very popular transportation option in certain pockets of the country — so much so that the country’s national railway company is expanding its Northeast Corridor by more than one million seats.

Related: This is what it's like to take a 19-hour train from New York to Chicago

Running from Boston all the way south to Washington, D.C., the route is one of the most popular as it passes through the most densely populated part of the country and serves as a commuter train for those who need to go between East Coast cities such as New York and Philadelphia for business.

Veronika Bondarenko captured this photo of New York’s Moynihan Train Hall. 

Veronika Bondarenko

Amtrak launches new routes, promises travelers ‘additional travel options’

Earlier this month, Amtrak announced that it was adding four additional Northeastern routes to its schedule — two more routes between New York’s Penn Station and Union Station in Washington, D.C. on the weekend, a new early-morning weekday route between New York and Philadelphia’s William H. Gray III 30th Street Station and a weekend route between Philadelphia and Boston’s South Station.

More Travel:

According to Amtrak, these additions will increase Northeast Corridor’s service by 20% on the weekdays and 10% on the weekends for a total of one million additional seats when counted by how many will ride the corridor over the year.

“More people are taking the train than ever before and we’re proud to offer our customers additional travel options when they ride with us on the Northeast Regional,” Amtrak Executive Vice President and Chief Commercial Officer Eliot Hamlisch said in a statement on the new routes. “The Northeast Regional gets you where you want to go comfortably, conveniently and sustainably as you breeze past traffic on I-95 for a more enjoyable travel experience.”

Here are some of the other Amtrak changes you can expect to see

Amtrak also said that, in the 2023 financial year, the Northeast Corridor had nearly 9.2 million riders — 8% more than it had pre-pandemic and a 29% increase from 2022. The higher demand, particularly during both off-peak hours and the time when many business travelers use to get to work, is pushing Amtrak to invest into this corridor in particular.

To reach more customers, Amtrak has also made several changes to both its routes and pricing system. In the fall of 2023, it introduced a type of new “Night Owl Fare” — if traveling during very late or very early hours, one can go between cities like New York and Philadelphia or Philadelphia and Washington. D.C. for $5 to $15.

As travel on the same routes during peak hours can reach as much as $300, this was a deliberate move to reach those who have the flexibility of time and might have otherwise preferred more affordable methods of transportation such as the bus. After seeing strong uptake, Amtrak added this type of fare to more Boston routes.

The largest distances, such as the ones between Boston and New York or New York and Washington, are available at the lowest rate for $20.

Read More

Continue Reading

International

The next pandemic? It’s already here for Earth’s wildlife

Bird flu is decimating species already threatened by climate change and habitat loss.

I am a conservation biologist who studies emerging infectious diseases. When people ask me what I think the next pandemic will be I often say that we are in the midst of one – it’s just afflicting a great many species more than ours.

I am referring to the highly pathogenic strain of avian influenza H5N1 (HPAI H5N1), otherwise known as bird flu, which has killed millions of birds and unknown numbers of mammals, particularly during the past three years.

This is the strain that emerged in domestic geese in China in 1997 and quickly jumped to humans in south-east Asia with a mortality rate of around 40-50%. My research group encountered the virus when it killed a mammal, an endangered Owston’s palm civet, in a captive breeding programme in Cuc Phuong National Park Vietnam in 2005.

How these animals caught bird flu was never confirmed. Their diet is mainly earthworms, so they had not been infected by eating diseased poultry like many captive tigers in the region.

This discovery prompted us to collate all confirmed reports of fatal infection with bird flu to assess just how broad a threat to wildlife this virus might pose.

This is how a newly discovered virus in Chinese poultry came to threaten so much of the world’s biodiversity.

H5N1 originated on a Chinese poultry farm in 1997. ChameleonsEye/Shutterstock

The first signs

Until December 2005, most confirmed infections had been found in a few zoos and rescue centres in Thailand and Cambodia. Our analysis in 2006 showed that nearly half (48%) of all the different groups of birds (known to taxonomists as “orders”) contained a species in which a fatal infection of bird flu had been reported. These 13 orders comprised 84% of all bird species.

We reasoned 20 years ago that the strains of H5N1 circulating were probably highly pathogenic to all bird orders. We also showed that the list of confirmed infected species included those that were globally threatened and that important habitats, such as Vietnam’s Mekong delta, lay close to reported poultry outbreaks.

Mammals known to be susceptible to bird flu during the early 2000s included primates, rodents, pigs and rabbits. Large carnivores such as Bengal tigers and clouded leopards were reported to have been killed, as well as domestic cats.

Our 2006 paper showed the ease with which this virus crossed species barriers and suggested it might one day produce a pandemic-scale threat to global biodiversity.

Unfortunately, our warnings were correct.

A roving sickness

Two decades on, bird flu is killing species from the high Arctic to mainland Antarctica.

In the past couple of years, bird flu has spread rapidly across Europe and infiltrated North and South America, killing millions of poultry and a variety of bird and mammal species. A recent paper found that 26 countries have reported at least 48 mammal species that have died from the virus since 2020, when the latest increase in reported infections started.

Not even the ocean is safe. Since 2020, 13 species of aquatic mammal have succumbed, including American sea lions, porpoises and dolphins, often dying in their thousands in South America. A wide range of scavenging and predatory mammals that live on land are now also confirmed to be susceptible, including mountain lions, lynx, brown, black and polar bears.

The UK alone has lost over 75% of its great skuas and seen a 25% decline in northern gannets. Recent declines in sandwich terns (35%) and common terns (42%) were also largely driven by the virus.

Scientists haven’t managed to completely sequence the virus in all affected species. Research and continuous surveillance could tell us how adaptable it ultimately becomes, and whether it can jump to even more species. We know it can already infect humans – one or more genetic mutations may make it more infectious.

At the crossroads

Between January 1 2003 and December 21 2023, 882 cases of human infection with the H5N1 virus were reported from 23 countries, of which 461 (52%) were fatal.

Of these fatal cases, more than half were in Vietnam, China, Cambodia and Laos. Poultry-to-human infections were first recorded in Cambodia in December 2003. Intermittent cases were reported until 2014, followed by a gap until 2023, yielding 41 deaths from 64 cases. The subtype of H5N1 virus responsible has been detected in poultry in Cambodia since 2014. In the early 2000s, the H5N1 virus circulating had a high human mortality rate, so it is worrying that we are now starting to see people dying after contact with poultry again.

It’s not just H5 subtypes of bird flu that concern humans. The H10N1 virus was originally isolated from wild birds in South Korea, but has also been reported in samples from China and Mongolia.

Recent research found that these particular virus subtypes may be able to jump to humans after they were found to be pathogenic in laboratory mice and ferrets. The first person who was confirmed to be infected with H10N5 died in China on January 27 2024, but this patient was also suffering from seasonal flu (H3N2). They had been exposed to live poultry which also tested positive for H10N5.

Species already threatened with extinction are among those which have died due to bird flu in the past three years. The first deaths from the virus in mainland Antarctica have just been confirmed in skuas, highlighting a looming threat to penguin colonies whose eggs and chicks skuas prey on. Humboldt penguins have already been killed by the virus in Chile.

A colony of king penguins.
Remote penguin colonies are already threatened by climate change. AndreAnita/Shutterstock

How can we stem this tsunami of H5N1 and other avian influenzas? Completely overhaul poultry production on a global scale. Make farms self-sufficient in rearing eggs and chicks instead of exporting them internationally. The trend towards megafarms containing over a million birds must be stopped in its tracks.

To prevent the worst outcomes for this virus, we must revisit its primary source: the incubator of intensive poultry farms.

Diana Bell does not work for, consult, own shares in or receive funding from any company or organisation that would benefit from this article, and has disclosed no relevant affiliations beyond their academic appointment.

Read More

Continue Reading

Uncategorized

NY Fed Finds Medium, Long-Term Inflation Expectations Jump Amid Surge In Stock Market Optimism

NY Fed Finds Medium, Long-Term Inflation Expectations Jump Amid Surge In Stock Market Optimism

One month after the inflation outlook tracked…

Published

on

NY Fed Finds Medium, Long-Term Inflation Expectations Jump Amid Surge In Stock Market Optimism

One month after the inflation outlook tracked by the NY Fed Consumer Survey extended their late 2023 slide, with 3Y inflation expectations in January sliding to a record low 2.4% (from 2.6% in December), even as 1 and 5Y inflation forecasts remained flat, moments ago the NY Fed reported that in February there was a sharp rebound in longer-term inflation expectations, rising to 2.7% from 2.4% at the three-year ahead horizon, and jumping to 2.9% from 2.5% at the five-year ahead horizon, while the 1Y inflation outlook was flat for the 3rd month in a row, stuck at 3.0%. 

The increases in both the three-year ahead and five-year ahead measures were most pronounced for respondents with at most high school degrees (in other words, the "really smart folks" are expecting deflation soon). The survey’s measure of disagreement across respondents (the difference between the 75th and 25th percentile of inflation expectations) decreased at all horizons, while the median inflation uncertainty—or the uncertainty expressed regarding future inflation outcomes—declined at the one- and three-year ahead horizons and remained unchanged at the five-year ahead horizon.

Going down the survey, we find that the median year-ahead expected price changes increased by 0.1 percentage point to 4.3% for gas; decreased by 1.8 percentage points to 6.8% for the cost of medical care (its lowest reading since September 2020); decreased by 0.1 percentage point to 5.8% for the cost of a college education; and surprisingly decreased by 0.3 percentage point for rent to 6.1% (its lowest reading since December 2020), and remained flat for food at 4.9%.

We find the rent expectations surprising because it is happening just asking rents are rising across the country.

At the same time as consumers erroneously saw sharply lower rents, median home price growth expectations remained unchanged for the fifth consecutive month at 3.0%.

Turning to the labor market, the survey found that the average perceived likelihood of voluntary and involuntary job separations increased, while the perceived likelihood of finding a job (in the event of a job loss) declined. "The mean probability of leaving one’s job voluntarily in the next 12 months also increased, by 1.8 percentage points to 19.5%."

Mean unemployment expectations - or the mean probability that the U.S. unemployment rate will be higher one year from now - decreased by 1.1 percentage points to 36.1%, the lowest reading since February 2022. Additionally, the median one-year-ahead expected earnings growth was unchanged at 2.8%, remaining slightly below its 12-month trailing average of 2.9%.

Turning to household finance, we find the following:

  • The median expected growth in household income remained unchanged at 3.1%. The series has been moving within a narrow range of 2.9% to 3.3% since January 2023, and remains above the February 2020 pre-pandemic level of 2.7%.
  • Median household spending growth expectations increased by 0.2 percentage point to 5.2%. The increase was driven by respondents with a high school degree or less.
  • Median year-ahead expected growth in government debt increased to 9.3% from 8.9%.
  • The mean perceived probability that the average interest rate on saving accounts will be higher in 12 months increased by 0.6 percentage point to 26.1%, remaining below its 12-month trailing average of 30%.
  • Perceptions about households’ current financial situations deteriorated somewhat with fewer respondents reporting being better off than a year ago. Year-ahead expectations also deteriorated marginally with a smaller share of respondents expecting to be better off and a slightly larger share of respondents expecting to be worse off a year from now.
  • The mean perceived probability that U.S. stock prices will be higher 12 months from now increased by 1.4 percentage point to 38.9%.
  • At the same time, perceptions and expectations about credit access turned less optimistic: "Perceptions of credit access compared to a year ago deteriorated with a larger share of respondents reporting tighter conditions and a smaller share reporting looser conditions compared to a year ago."

Also, a smaller percentage of consumers, 11.45% vs 12.14% in prior month, expect to not be able to make minimum debt payment over the next three months

Last, and perhaps most humorous, is the now traditional cognitive dissonance one observes with these polls, because at a time when long-term inflation expectations jumped, which clearly suggests that financial conditions will need to be tightened, the number of respondents expecting higher stock prices one year from today jumped to the highest since November 2021... which incidentally is just when the market topped out during the last cycle before suffering a painful bear market.

Tyler Durden Mon, 03/11/2024 - 12:40

Read More

Continue Reading

Trending