NEW YORK, Feb. 20, 2023 /PRNewswire/ -- Hummus market insights -
- Vendors: 15+, Including Agro Tech Foods Ltd., Bakkavor Group PLC, Boars Head Brand, Cedars Mediterranean Foods Inc., Damai International, Fountain of Health, Haliburton International Foods Inc., Harvest Moon Foods, Hope Foods LLC, Hummus Goodness, Kasih Food Production Co., Lakeview Farms LLC, Nestle SA, Sabra Dipping Co. LLC, SAJJ Mediterranean, Strauss Group Ltd., T. Marzetti Co., The Huda Bar, The Kraft Heinz Co., Wingreens Farms Pvt. Ltd., among others
- Coverage: Parent market analysis; key drivers, major trends, and challenges; customer and vendor landscape; vendor product insights and recent developments; key vendors; and market positioning of vendors
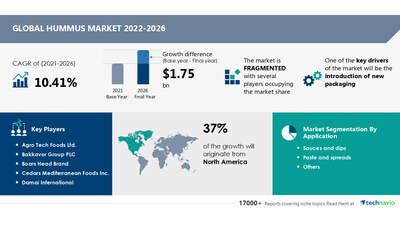
- Segments: Application (sauces and dips, paste and spreads, and others) and geography (North America, Europe, APAC, Middle East and Africa, and South America)
To understand more about the hummus market, request a sample report
The hummus market report provides critical information and factual data, with a qualitative and quantitative study of the market based on market drivers and limitations as well as future prospects.
Why buy?
- Add credibility to strategy
- Analyzes competitor's offerings
- Get a holistic view of the market
Grow your profit margin with Technavio - Buy the report
The hummus market size is estimated to grow by USD 1.75 billion from 2021 to 2026 at a CAGR of 10.41%, according to Technavio.
Hummus market - Customer landscape
To help companies evaluate and develop growth strategies, the report outlines –
- Key purchase criteria
- Adoption rates
- Adoption lifecycle
- Drivers of price sensitivity
- For highlights on customer landscape analysis, download a sample!
Hummus market - Vendor Insights
The growing competition in the market is compelling vendors to adopt various growth strategies such as quality, price, service, brand image, distribution, and marketing to compete in the market. Technavio report analyzes the market's competitive landscape and offers information on several market vendors, including -
- Bakkavor Group PLC - The company offers hummus with different flavors.
- Boars Head Brand - The company offers hummus, such as traditional hummus and dark chocolate dessert hummus.
- Cedars Mediterranean Foods Inc. - The company offers hummus such as traditional hummus, organic hummus, and hummus with toppings.
Hummus market – Market dynamics
Major Drivers
- Introduction of new packaging
- Rising urbanization and changing consumer lifestyles
- Increasing preference for convenience in cooking
Key Challenges
- Effects of natural calamities
- Product recalls
- Stringent government regulations
Drivers and challenges have an impact on market dynamics, which can impact businesses. Find more insights in a sample report!
What are the key data covered in this hummus market report?
- CAGR of the market during the forecast period
- Detailed information on factors that will drive the growth of the hummus market between 2022 and 2026
- Precise estimation of the size of the hummus market size and its contribution to the parent market
- Accurate predictions about upcoming trends and changes in consumer behavior
- Growth of the hummus market across North America, Europe, APAC, Middle East and Africa, and South America
- A thorough analysis of the market's competitive landscape and detailed information about vendors
- Comprehensive analysis of factors that will challenge the growth of hummus market vendors
Gain instant access to 17,000+ market research reports.
Technavio's SUBSCRIPTION platform
Related Reports:
The size of the hummus market in Europe is expected to increase by USD 321.34 million from 2021 to 2026, and the market's growth momentum will accelerate at a CAGR of 8.53%. This report extensively covers hummus market segmentation in Europe by type (classic hummus, lentil hummus, and others) and geography (UK, Germany, France, Spain, and Rest of Europe).
The honey market is estimated to grow at a CAGR of 9.39% between 2022 and 2027. The size of the market is forecasted to increase by USD 5,575.99 million. This report extensively covers market segmentation by distribution channel (offline and online), type (conventional and organic), and geography (APAC, Europe, North America, South America, and Middle East and Africa).
Hummus Market Scope
|
Report Coverage
| Details
|
Page number
| 134
|
Base year
| 2021
|
Forecast period
| 2022-2026
|
Growth momentum & CAGR
| Accelerate at a CAGR of 10.41%
|
Market growth 2022-2026
| USD 1.75 billion
|
Market structure
| Fragmented
|
YoY growth 2021-2022 (%)
| 9.84
|
Regional analysis
| North America, Europe, APAC, Middle East and Africa, and South America
|
Performing market contribution
| North America at 37%
|
Key countries
| US, Saudi Arabia, United Arab Emirates, UK, and Germany
|
Competitive landscape
| Leading vendors, market positioning of vendors, competitive strategies, and industry risks
|
Key companies profiled
| Agro Tech Foods Ltd., Bakkavor Group PLC, Boars Head Brand, Cedars Mediterranean Foods Inc., Damai International, Fountain of Health, Haliburton International Foods Inc., Harvest Moon Foods, Hope Foods LLC, Hummus Goodness, Kasih Food Production Co., Lakeview Farms LLC, Nestle SA, Sabra Dipping Co. LLC, SAJJ Mediterranean, Strauss Group Ltd., T. Marzetti Co., The Huda Bar, The Kraft Heinz Co., and Wingreens Farms Pvt. Ltd.
|
Market dynamics
| Parent market analysis, market growth inducers and obstacles, fast-growing and slow-growing segment analysis, COVID-19 impact and recovery analysis and future consumer dynamics, and market condition analysis for the forecast period.
|
Customization purview
| If our report has not included the data that you are looking for, you can reach out to our analysts and get segments customized.
|
Browse for Technavio consumer staples market reports
Table of contents
1 Executive Summary
- 1.1 Market overview
- Exhibit 01: Executive Summary – Chart on Market Overview
- Exhibit 02: Executive Summary – Data Table on Market Overview
- Exhibit 03: Executive Summary – Chart on Global Market Characteristics
- Exhibit 04: Executive Summary – Chart on Market by Geography
- Exhibit 05: Executive Summary – Chart on Market Segmentation by Application
- Exhibit 06: Executive Summary – Chart on Incremental Growth
- Exhibit 07: Executive Summary – Data Table on Incremental Growth
- Exhibit 08: Executive Summary – Chart on Vendor Market Positioning
2 Market Landscape
- 2.1 Market ecosystem
- Exhibit 09: Parent market
- Exhibit 10: Market Characteristics
3 Market Sizing
- 3.1 Market definition
- Exhibit 11: Offerings of vendors included in the market definition
- 3.2 Market segment analysis
- Exhibit 12: Market segments
- 3.4 Market outlook: Forecast for 2021-2026
- Exhibit 13: Chart on Global - Market size and forecast 2021-2026 ($ million)
- Exhibit 14: Data Table on Global - Market size and forecast 2021-2026 ($ million)
- Exhibit 15: Chart on Global Market: Year-over-year growth 2021-2026 (%)
- Exhibit 16: Data Table on Global Market: Year-over-year growth 2021-2026 (%)
4 Five Forces Analysis
- 4.1 Five forces summary
- Exhibit 17: Five forces analysis - Comparison between 2021 and 2026
- 4.2 Bargaining power of buyers
- Exhibit 18: Chart on Bargaining power of buyers – Impact of key factors 2021 and 2026
- 4.3 Bargaining power of suppliers
- Exhibit 19: Bargaining power of suppliers – Impact of key factors in 2021 and 2026
- 4.4 Threat of new entrants
- Exhibit 20: Threat of new entrants – Impact of key factors in 2021 and 2026
- 4.5 Threat of substitutes
- Exhibit 21: Threat of substitutes – Impact of key factors in 2021 and 2026
- 4.6 Threat of rivalry
- Exhibit 22: Threat of rivalry – Impact of key factors in 2021 and 2026
- 4.7 Market condition
- Exhibit 23: Chart on Market condition - Five forces 2021 and 2026
5 Market Segmentation by Application
- 5.1 Market segments
- Exhibit 24: Chart on Application - Market share 2021-2026 (%)
- Exhibit 25: Data Table on Application - Market share 2021-2026 (%)
- 5.2 Comparison by Application
- Exhibit 26: Chart on Comparison by Application
- Exhibit 27: Data Table on Comparison by Application
- 5.3 Sauces and dips - Market size and forecast 2021-2026
- Exhibit 28: Chart on Sauces and dips - Market size and forecast 2021-2026 ($ million)
- Exhibit 29: Data Table on Sauces and dips - Market size and forecast 2021-2026 ($ million)
- Exhibit 30: Chart on Sauces and dips - Year-over-year growth 2021-2026 (%)
- Exhibit 31: Data Table on Sauces and dips - Year-over-year growth 2021-2026 (%)
- 5.4 Paste and spreads - Market size and forecast 2021-2026
- Exhibit 32: Chart on Paste and spreads - Market size and forecast 2021-2026 ($ million)
- Exhibit 33: Data Table on Paste and spreads - Market size and forecast 2021-2026 ($ million)
- Exhibit 34: Chart on Paste and spreads - Year-over-year growth 2021-2026 (%)
- Exhibit 35: Data Table on Paste and spreads - Year-over-year growth 2021-2026 (%)
- 5.5 Others - Market size and forecast 2021-2026
- Exhibit 36: Chart on Others - Market size and forecast 2021-2026 ($ million)
- Exhibit 37: Data Table on Others - Market size and forecast 2021-2026 ($ million)
- Exhibit 38: Chart on Others - Year-over-year growth 2021-2026 (%)
- Exhibit 39: Data Table on Others - Year-over-year growth 2021-2026 (%)
- 5.6 Market opportunity by Application
- Exhibit 40: Market opportunity by Application ($ million)
6 Customer Landscape
- 6.1 Customer landscape overview
- Exhibit 41: Analysis of price sensitivity, lifecycle, customer purchase basket, adoption rates, and purchase criteria
7 Geographic Landscape
- 7.1 Geographic segmentation
- Exhibit 42: Chart on Market share by geography 2021-2026 (%)
- Exhibit 43: Data Table on Market share by geography 2021-2026 (%)
- 7.2 Geographic comparison
- Exhibit 44: Chart on Geographic comparison
- Exhibit 45: Data Table on Geographic comparison
- 7.3 North America - Market size and forecast 2021-2026
- Exhibit 46: Chart on North America - Market size and forecast 2021-2026 ($ million)
- Exhibit 47: Data Table on North America - Market size and forecast 2021-2026 ($ million)
- Exhibit 48: Chart on North America - Year-over-year growth 2021-2026 (%)
- Exhibit 49: Data Table on North America - Year-over-year growth 2021-2026 (%)
- 7.4 Europe - Market size and forecast 2021-2026
- Exhibit 50: Chart on Europe - Market size and forecast 2021-2026 ($ million)
- Exhibit 51: Data Table on Europe - Market size and forecast 2021-2026 ($ million)
- Exhibit 52: Chart on Europe - Year-over-year growth 2021-2026 (%)
- Exhibit 53: Data Table on Europe - Year-over-year growth 2021-2026 (%)
- 7.5 APAC - Market size and forecast 2021-2026
- Exhibit 54: Chart on APAC - Market size and forecast 2021-2026 ($ million)
- Exhibit 55: Data Table on APAC - Market size and forecast 2021-2026 ($ million)
- Exhibit 56: Chart on APAC - Year-over-year growth 2021-2026 (%)
- Exhibit 57: Data Table on APAC - Year-over-year growth 2021-2026 (%)
- 7.6 Middle East and Africa - Market size and forecast 2021-2026
- Exhibit 58: Chart on Middle East and Africa - Market size and forecast 2021-2026 ($ million)
- Exhibit 59: Data Table on Middle East and Africa - Market size and forecast 2021-2026 ($ million)
- Exhibit 60: Chart on Middle East and Africa - Year-over-year growth 2021-2026 (%)
- Exhibit 61: Data Table on Middle East and Africa - Year-over-year growth 2021-2026 (%)
- 7.7 South America - Market size and forecast 2021-2026
- Exhibit 62: Chart on South America - Market size and forecast 2021-2026 ($ million)
- Exhibit 63: Data Table on South America - Market size and forecast 2021-2026 ($ million)
- Exhibit 64: Chart on South America - Year-over-year growth 2021-2026 (%)
- Exhibit 65: Data Table on South America - Year-over-year growth 2021-2026 (%)
- 7.8 US - Market size and forecast 2021-2026
- Exhibit 66: Chart on US - Market size and forecast 2021-2026 ($ million)
- Exhibit 67: Data Table on US - Market size and forecast 2021-2026 ($ million)
- Exhibit 68: Chart on US - Year-over-year growth 2021-2026 (%)
- Exhibit 69: Data Table on US - Year-over-year growth 2021-2026 (%)
- 7.9 UK - Market size and forecast 2021-2026
- Exhibit 70: Chart on UK - Market size and forecast 2021-2026 ($ million)
- Exhibit 71: Data Table on UK - Market size and forecast 2021-2026 ($ million)
- Exhibit 72: Chart on UK - Year-over-year growth 2021-2026 (%)
- Exhibit 73: Data Table on UK - Year-over-year growth 2021-2026 (%)
- 7.10 Germany - Market size and forecast 2021-2026
- Exhibit 74: Chart on Germany - Market size and forecast 2021-2026 ($ million)
- Exhibit 75: Data Table on Germany - Market size and forecast 2021-2026 ($ million)
- Exhibit 76: Chart on Germany - Year-over-year growth 2021-2026 (%)
- Exhibit 77: Data Table on Germany - Year-over-year growth 2021-2026 (%)
- 7.11 Saudi Arabia - Market size and forecast 2021-2026
- Exhibit 78: Chart on Saudi Arabia - Market size and forecast 2021-2026 ($ million)
- Exhibit 79: Data Table on Saudi Arabia - Market size and forecast 2021-2026 ($ million)
- Exhibit 80: Chart on Saudi Arabia - Year-over-year growth 2021-2026 (%)
- Exhibit 81: Data Table on Saudi Arabia - Year-over-year growth 2021-2026 (%)
- 7.12 United Arab Emirates - Market size and forecast 2021-2026
- Exhibit 82: Chart on United Arab Emirates - Market size and forecast 2021-2026 ($ million)
- Exhibit 83: Data Table on United Arab Emirates - Market size and forecast 2021-2026 ($ million)
- Exhibit 84: Chart on United Arab Emirates - Year-over-year growth 2021-2026 (%)
- Exhibit 85: Data Table on United Arab Emirates - Year-over-year growth 2021-2026 (%)
- 7.13 Market opportunity by geography
- Exhibit 86: Market opportunity by geography ($ million)
8 Drivers, Challenges, and Trends
- 8.3 Impact of drivers and challenges
- Exhibit 87: Impact of drivers and challenges in 2021 and 2026
9 Vendor Landscape
- 9.2 Vendor landscape
- Exhibit 88: Overview on Criticality of inputs and Factors of differentiation
- 9.3 Landscape disruption
- Exhibit 89: Overview on factors of disruption
- 9.4 Industry risks
- Exhibit 90: Impact of key risks on business
10 Vendor Analysis
- 10.1 Vendors covered
- Exhibit 91: Vendors covered
- 10.2 Market positioning of vendors
- Exhibit 92: Matrix on vendor position and classification
- 10.3 Bakkavor Group PLC
- Exhibit 93: Bakkavor Group PLC - Overview
- Exhibit 94: Bakkavor Group PLC - Business segments
- Exhibit 95: Bakkavor Group PLC - Key offerings
- Exhibit 96: Bakkavor Group PLC - Segment focus
- 10.4 Boars Head Brand
- Exhibit 97: Boars Head Brand - Overview
- Exhibit 98: Boars Head Brand - Product / Service
- Exhibit 99: Boars Head Brand - Key offerings
- 10.5 Cedars Mediterranean Foods Inc.
- Exhibit 100: Cedars Mediterranean Foods Inc. - Overview
- Exhibit 101: Cedars Mediterranean Foods Inc. - Product / Service
- Exhibit 102: Cedars Mediterranean Foods Inc. - Key offerings
- 10.6 Fountain of Health
- Exhibit 103: Fountain of Health - Overview
- Exhibit 104: Fountain of Health - Product / Service
- Exhibit 105: Fountain of Health - Key offerings
- 10.7 Hummus Goodness
- Exhibit 106: Hummus Goodness - Overview
- Exhibit 107: Hummus Goodness - Product / Service
- Exhibit 108: Hummus Goodness - Key offerings
- 10.8 Lakeview Farms LLC
- Exhibit 109: Lakeview Farms LLC - Overview
- Exhibit 110: Lakeview Farms LLC - Product / Service
- Exhibit 111: Lakeview Farms LLC - Key offerings
- 10.9 Nestle SA
- Exhibit 112: Nestle SA - Overview
- Exhibit 113: Nestle SA - Business segments
- Exhibit 114: Nestle SA - Key news
- Exhibit 115: Nestle SA - Key offerings
- Exhibit 116: Nestle SA - Segment focus
- 10.10 Sabra Dipping Co. LLC
- Exhibit 117: Sabra Dipping Co. LLC - Overview
- Exhibit 118: Sabra Dipping Co. LLC - Product / Service
- Exhibit 119: Sabra Dipping Co. LLC - Key offerings
- 10.11 Strauss Group Ltd.
- Exhibit 120: Strauss Group Ltd. - Overview
- Exhibit 121: Strauss Group Ltd. - Business segments
- Exhibit 122: Strauss Group Ltd. - Key offerings
- Exhibit 123: Strauss Group Ltd. - Segment focus
- 10.12 T. Marzetti Co.
- Exhibit 124: T. Marzetti Co. - Overview
- Exhibit 125: T. Marzetti Co. - Product / Service
- Exhibit 126: T. Marzetti Co. - Key offerings
11 Appendix
- 11.2 Inclusions and exclusions checklist
- Exhibit 127: Inclusions checklist
- Exhibit 128: Exclusions checklist
- 11.3 Currency conversion rates for US$
- Exhibit 129: Currency conversion rates for US$
- 11.4 Research methodology
- Exhibit 130: Research methodology
- Exhibit 131: Validation techniques employed for market sizing
- Exhibit 132: Information sources
- 11.5 List of abbreviations
- Exhibit 133: List of abbreviations
About Us
Technavio is a leading global technology research and advisory company. Their research and analysis focus on emerging market trends and provide actionable insights to help businesses identify market opportunities and develop effective strategies to optimize their market positions. With over 500 specialized analysts, Technavio's report library consists of more than 17,000 reports and counting, covering 800 technologies, spanning across 50 countries. Their client base consists of enterprises of all sizes, including more than 100 Fortune 500 companies. This growing client base relies on Technavio's comprehensive coverage, extensive research, and actionable market insights to identify opportunities in existing and potential markets and assess their competitive positions within changing market scenarios.
Contact
Technavio Research
Jesse Maida
Media & Marketing Executive
US: +1 844 364 1100
UK: +44 203 893 3200
Email: media@technavio.com
Website: www.technavio.com/
View original content to download multimedia:https://www.prnewswire.com/news-releases/hummus-market-to-grow-at-a-cagr-of-10-41-from-2021-to-2026-insights-on-key-players-like-bakkavor-group-plc-boars-head-brand-technavio-301749575.html
SOURCE Technavio


