International
Guest Contribution: “Is China’s growth rate negative?”
Today, we are pleased to present a guest contribution written by John G. Fernald, Jack Mueller, and Mark M. Spiegel (all of the Federal Reserve Bank of San Francisco). Our views are our own, and not necessarily those of the Federal Board of Governors…
Share this:


Today, we are pleased to present a guest contribution written by John G. Fernald, Jack Mueller, and Mark M. Spiegel (all of the Federal Reserve Bank of San Francisco). Our views are our own, and not necessarily those of the Federal Board of Governors or the Federal Reserve Bank of San Francisco.
China has announced, through the third quarter, quarterly growth figures for 2021 that are far below its robust pre-pandemic trend. In the first half of 2021, published quarterly growth averaged an annual rate of 2.8 percent, but the pace slowed to an annual rate of just 0.8% in the third quarter. It is no surprise that these figures are well below the outsized growth rates in the final three quarters of 2020, when the economy grew at a 24 percent annual rate as it rebounded from the deep pandemic trough. The 2021 figures are also well below China’s pre-pandemic trend pace of around 6%.
In this Econbrowser article, we use a quarterly version of the FRBSF China Cyclical Activity Tracker (China CAT) to evaluate the recent pace of China’s slowdown. Chinn (2021) discusses inconsistencies between China’s reported quarter-to-quarter GDP growth (the figures we annualized and cited above) and other published GDP data. Moreover, several studies have raised broader concerns about the accuracy of China’s GDP data. Nakamura, et al (2016) find that official aggregate consumption data are “too smooth” relative to levels expected from standard theory. Pinovsky and Sala-i-Martin (2016) find that China’s reported GDP growth rate appears to be exceptionally high relative to its growth in light emissions, as measured from satellite data. Chen, Chen, Hsieh and Song (2019) use both value-added tax data and local indicators less conducive to manipulation and estimate that GDP growth from 2010-2016 was 1.8 percentage points lower than reported.
The FRBSF China CAT [Fernald, Hsu, and Spiegel (2021)] examines the accuracy of Chinese statistics using indices of economic activity, such as electricity, rail shipments, and industrial production, converted into weighted averages of data on a broad range of measures of economic activity in China. The statistical technique we use to create these weighted averages, known as principal components (PC), provides an index capturing as much of the variability as possible in the individual series. Conceptually, this index is like the Chicago Fed National Activity Index (see, e.g., Brave 2008) for the United States.
To choose among the large number of possible combinations of indicators of activity, Fernald, Hsu, and Spiegel (2021) consider the relationship of various combinations of indicators with China’s real imports, as measured by trading-partner exports to China. For countries with reliable statistical agencies, real imports comove closely with real GDP. Importantly, our approach provides external validation, as trading-partner exports are not subject to manipulation or statistical error by Chinese authorities. (We estimate all relationships prior to the U.S.-China trade disputes of the late 2010s as well as the pandemic.)
The resulting China CAT series is updated quarterly, with the data and additional documentation (available on the Federal Reserve Bank of San Francisco web site). The series uses year-over-year data and has mean zero and unit standard deviation. (Hence, the series focuses on fluctuations, and is silent on whether the trend is appropriately measured.)
However, we are currently interested in the most recent turndown in China growth, and year-over-year data are heavily influenced by the substantial volatility in levels that occurred a year ago. Hence, we have now constructed a new quarter-on-quarter version of the China CAT, which we term the “QCAT”. Although the underlying series is normalized to have mean zero and unit standard deviation, we report them here in “GDP units,” by scaling by the standard deviation of GDP and adding back the estimated trend in reported GDP.
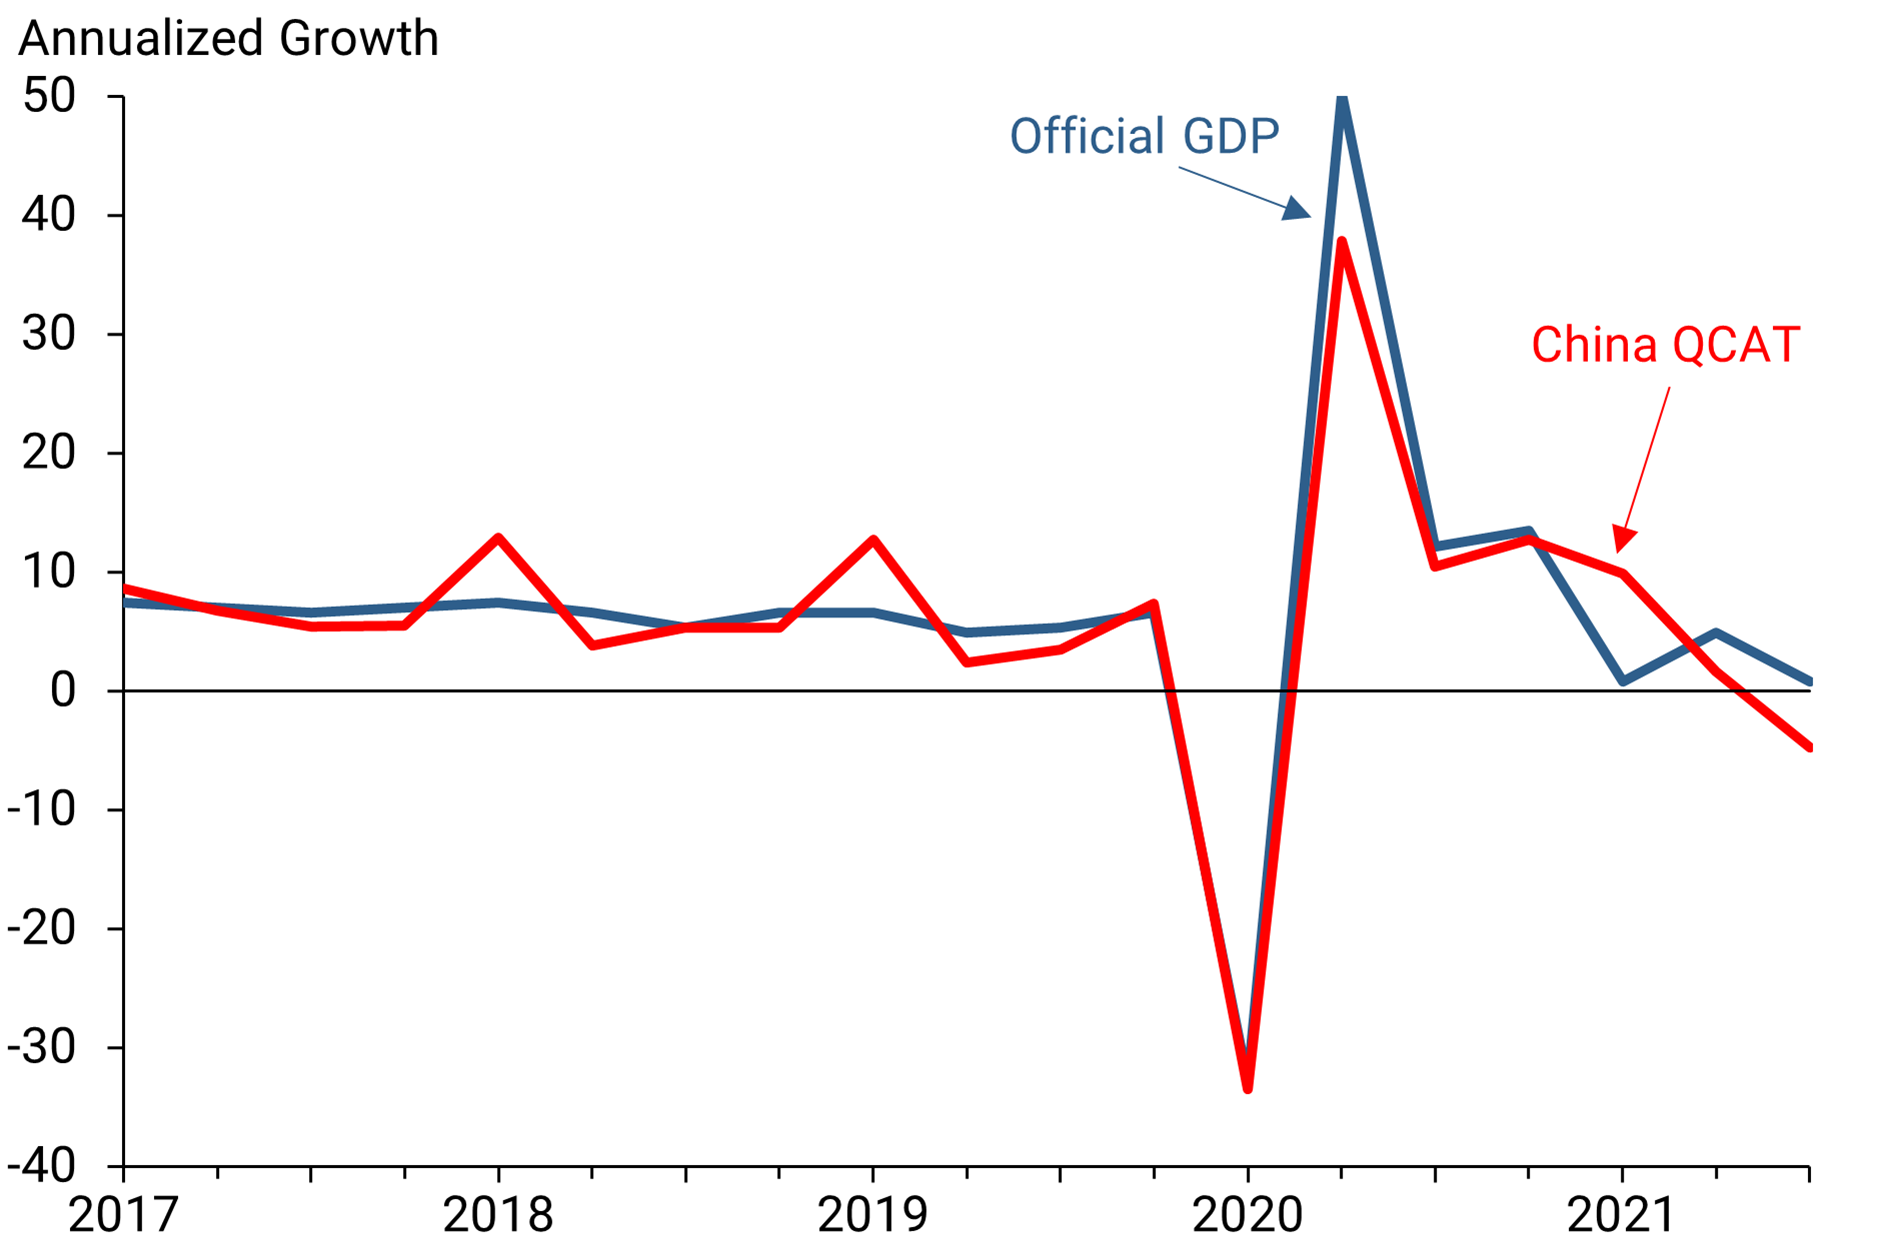
Our results are shown in the figure above. Prior to the pandemic, GDP was somewhat smoother than the QCAT value, consistent with the “excessive smoothness” of the published GDP data since 2013 (see Fernald et al, 2020). But in 2020, during the most volatile period of the pandemic, the QCAT yields similar quarterly results to the official GDP growth figures.
However, we begin to see marked discrepancies in 2021. For the first quarter of this year, the QCAT corresponded to GDP growth of nearly 10% at an annual rate, well above the tepid 0.8% annualized official growth figure. But the QCAT for the second quarter comes in much lower, at 1.6% annualized, compared with the official figure of 4.8%. Most recently, in the third quarter, the QCAT is sharply negative, at -5%—only the second time since 2000 (when our data began), apart from the pandemic, that China’s GDP growth has been negative (the other being -4% growth in the fourth quarter of 2008, during the Great Recession). The official third-quarter figure, while weak, was still positive, albeit under 1%.
Among the individual components of the QCAT, growth was particularly low for freight and retail growth during the quarter, corresponding to GDP growth of -6.1% and -5.9% respectively. There were brighter spots, such as fixed asset investment, which entered with growth 1.9% above trend. Yet, more recent figures for October and November show a net decline in fixed asset investment over those months.
Conclusion
Prior to the pandemic, the China CAT index of non-GDP indicators suggested published GDP was “excessively smooth.” Nevertheless, during the worst of the pandemic in 2020, our quarterly QCAT tracked quarterly GDP closely.
However, in the second and third quarters of 2021, a notable gap has opened up: non-GDP indicators, as captured by the QCAT, appear much more concerning than the (already weak) GDP figures. In fact, the QCAT suggests that China’s economy is actually contracting. These findings are broadly consistent with Chinn (2021), who also finds evidence that, with typical seasonal adjustment methods, other published GDP data for China imply negative growth in the third quarter. In this light, perhaps it is no surprise that China recently announced measures to provide additional monetary stimulus through cuts in required reserve ratios, even as other central banks around the world move towards tightening.
John G. Fernald is a senior research advisor in the Economic Research Department of the Federal Reserve Bank of San Francisco and professor of economics at INSEAD.
Jack Mueller is a research associate in the Economic Research Department of the Federal Reserve Bank of San Francisco.
Mark M. Spiegel is a senior policy advisor in the Economic Research Department of the Federal Reserve Bank of San Francisco.
References
Brave, Scott (2008). “Economic trends and the Chicago Fed National Activity Index.” Chicago Fed Letter No. 250, May.
Chen, Wei, Xilu Chen, Chang-Tai Hsieh and Zheng Song, (2019), “A Forensic Examination of China’s National Accounts, NBER Working Paper No. 25754, April.
Chinn, Menzie, 2021.“The Extent and Implications of the China Slowdown.“ Econbrowser, October 25, 2021. http://econbrowser.com/archives/2021/10/the-extent-and-implications-of-the-china-slowdown.
Fernald, John G., Eric Hsu, and Mark M. Spiegel, (2021), “Is China fudging its GDP figures? Evidence from trading partner data,” Journal of International Money and Finance, 114, June, 102406. [ungated working paper version]
Nakamura, Emi, Jon Steinsson, and Miao Liu, (2016), “Are Chinese Growth and Inflation Too Smooth?: Evidence from Engel Curves,” American Economic Journal: Macroeconomics. 8(3): 113–144.
Pinovsky, Maxim and Xavier Sala-i-Martin (2016). “Lights, Camera, … Income! Illuminating the National Accounts-Household Surveys Debate.” The Quarterly Journal of Economics, 131 (2): 579-631, May.
Stock, James H., and Mark W. Watson, (2016), “Dynamic Factor Models, Factor Augmented Vector Autoregressions, and Structural Vector Autoregressions in Macroeconomics.” In Handbook of Macroeconomics, Volume 2A, edited by John B. Taylor and Harald Uhlig. Amsterdam: North-Holland.
Wikileaks (2007). http://wikileaks.org/cable/2007/03/07BEIJING1760.html.
recession pandemic stimulus fed federal reserve gdp stimulus china
International
Fuel poverty in England is probably 2.5 times higher than government statistics show
The top 40% most energy efficient homes aren’t counted as being in fuel poverty, no matter what their bills or income are.
Share this:


The cap set on how much UK energy suppliers can charge for domestic gas and electricity is set to fall by 15% from April 1 2024. Despite this, prices remain shockingly high. The average household energy bill in 2023 was £2,592 a year, dwarfing the pre-pandemic average of £1,308 in 2019.
The term “fuel poverty” refers to a household’s ability to afford the energy required to maintain adequate warmth and the use of other essential appliances. Quite how it is measured varies from country to country. In England, the government uses what is known as the low income low energy efficiency (Lilee) indicator.
Since energy costs started rising sharply in 2021, UK households’ spending powers have plummeted. It would be reasonable to assume that these increasingly hostile economic conditions have caused fuel poverty rates to rise.
However, according to the Lilee fuel poverty metric, in England there have only been modest changes in fuel poverty incidence year on year. In fact, government statistics show a slight decrease in the nationwide rate, from 13.2% in 2020 to 13.0% in 2023.
Our recent study suggests that these figures are incorrect. We estimate the rate of fuel poverty in England to be around 2.5 times higher than what the government’s statistics show, because the criteria underpinning the Lilee estimation process leaves out a large number of financially vulnerable households which, in reality, are unable to afford and maintain adequate warmth.

Energy security
In 2022, we undertook an in-depth analysis of Lilee fuel poverty in Greater London. First, we combined fuel poverty, housing and employment data to provide an estimate of vulnerable homes which are omitted from Lilee statistics.
We also surveyed 2,886 residents of Greater London about their experiences of fuel poverty during the winter of 2022. We wanted to gauge energy security, which refers to a type of self-reported fuel poverty. Both parts of the study aimed to demonstrate the potential flaws of the Lilee definition.
Introduced in 2019, the Lilee metric considers a household to be “fuel poor” if it meets two criteria. First, after accounting for energy expenses, its income must fall below the poverty line (which is 60% of median income).
Second, the property must have an energy performance certificate (EPC) rating of D–G (the lowest four ratings). The government’s apparent logic for the Lilee metric is to quicken the net-zero transition of the housing sector.
In Sustainable Warmth, the policy paper that defined the Lilee approach, the government says that EPC A–C-rated homes “will not significantly benefit from energy-efficiency measures”. Hence, the focus on fuel poverty in D–G-rated properties.
Generally speaking, EPC A–C-rated homes (those with the highest three ratings) are considered energy efficient, while D–G-rated homes are deemed inefficient. The problem with how Lilee fuel poverty is measured is that the process assumes that EPC A–C-rated homes are too “energy efficient” to be considered fuel poor: the main focus of the fuel poverty assessment is a characteristic of the property, not the occupant’s financial situation.
In other words, by this metric, anyone living in an energy-efficient home cannot be considered to be in fuel poverty, no matter their financial situation. There is an obvious flaw here.
Around 40% of homes in England have an EPC rating of A–C. According to the Lilee definition, none of these homes can or ever will be classed as fuel poor. Even though energy prices are going through the roof, a single-parent household with dependent children whose only income is universal credit (or some other form of benefits) will still not be considered to be living in fuel poverty if their home is rated A-C.
The lack of protection afforded to these households against an extremely volatile energy market is highly concerning.
In our study, we estimate that 4.4% of London’s homes are rated A-C and also financially vulnerable. That is around 171,091 households, which are currently omitted by the Lilee metric but remain highly likely to be unable to afford adequate energy.
In most other European nations, what is known as the 10% indicator is used to gauge fuel poverty. This metric, which was also used in England from the 1990s until the mid 2010s, considers a home to be fuel poor if more than 10% of income is spent on energy. Here, the main focus of the fuel poverty assessment is the occupant’s financial situation, not the property.
Were such alternative fuel poverty metrics to be employed, a significant portion of those 171,091 households in London would almost certainly qualify as fuel poor.
This is confirmed by the findings of our survey. Our data shows that 28.2% of the 2,886 people who responded were “energy insecure”. This includes being unable to afford energy, making involuntary spending trade-offs between food and energy, and falling behind on energy payments.
Worryingly, we found that the rate of energy insecurity in the survey sample is around 2.5 times higher than the official rate of fuel poverty in London (11.5%), as assessed according to the Lilee metric.
It is likely that this figure can be extrapolated for the rest of England. If anything, energy insecurity may be even higher in other regions, given that Londoners tend to have higher-than-average household income.
The UK government is wrongly omitting hundreds of thousands of English households from fuel poverty statistics. Without a more accurate measure, vulnerable households will continue to be overlooked and not get the assistance they desperately need to stay warm.
Torran Semple receives funding from Engineering and Physical Sciences Research Council (EPSRC) grant EP/S023305/1.
John Harvey does not work for, consult, own shares in or receive funding from any company or organisation that would benefit from this article, and has disclosed no relevant affiliations beyond their academic appointment.
european uk pandemicInternational
Looking Back At COVID’s Authoritarian Regimes
After having moved from Canada to the United States, partly to be wealthier and partly to be freer (those two are connected, by the way), I was shocked,…
Share this:


After having moved from Canada to the United States, partly to be wealthier and partly to be freer (those two are connected, by the way), I was shocked, in March 2020, when President Trump and most US governors imposed heavy restrictions on people’s freedom. The purpose, said Trump and his COVID-19 advisers, was to “flatten the curve”: shut down people’s mobility for two weeks so that hospitals could catch up with the expected demand from COVID patients. In her book Silent Invasion, Dr. Deborah Birx, the coordinator of the White House Coronavirus Task Force, admitted that she was scrambling during those two weeks to come up with a reason to extend the lockdowns for much longer. As she put it, “I didn’t have the numbers in front of me yet to make the case for extending it longer, but I had two weeks to get them.” In short, she chose the goal and then tried to find the data to justify the goal. This, by the way, was from someone who, along with her task force colleague Dr. Anthony Fauci, kept talking about the importance of the scientific method. By the end of April 2020, the term “flatten the curve” had all but disappeared from public discussion.
Now that we are four years past that awful time, it makes sense to look back and see whether those heavy restrictions on the lives of people of all ages made sense. I’ll save you the suspense. They didn’t. The damage to the economy was huge. Remember that “the economy” is not a term used to describe a big machine; it’s a shorthand for the trillions of interactions among hundreds of millions of people. The lockdowns and the subsequent federal spending ballooned the budget deficit and consequent federal debt. The effect on children’s learning, not just in school but outside of school, was huge. These effects will be with us for a long time. It’s not as if there wasn’t another way to go. The people who came up with the idea of lockdowns did so on the basis of abstract models that had not been tested. They ignored a model of human behavior, which I’ll call Hayekian, that is tested every day.
These are the opening two paragraphs of my latest Defining Ideas article, “Looking Back at COVID’s Authoritarian Regimes,” Defining Ideas, March 14, 2024.
Another excerpt:
That wasn’t the only uncertainty. My daughter Karen lived in San Francisco and made her living teaching Pilates. San Francisco mayor London Breed shut down all the gyms, and so there went my daughter’s business. (The good news was that she quickly got online and shifted many of her clients to virtual Pilates. But that’s another story.) We tried to see her every six weeks or so, whether that meant our driving up to San Fran or her driving down to Monterey. But were we allowed to drive to see her? In that first month and a half, we simply didn’t know.
Read the whole thing, which is longer than usual.
(0 COMMENTS) budget deficit coronavirus covid-19 white house fauci trump canadaInternational
Problems After COVID-19 Vaccination More Prevalent Among Naturally Immune: Study
Problems After COVID-19 Vaccination More Prevalent Among Naturally Immune: Study
Authored by Zachary Stieber via The Epoch Times (emphasis…
Share this:

Authored by Zachary Stieber via The Epoch Times (emphasis ours),
People who recovered from COVID-19 and received a COVID-19 shot were more likely to suffer adverse reactions, researchers in Europe are reporting.
Participants in the study were more likely to experience an adverse reaction after vaccination regardless of the type of shot, with one exception, the researchers found.
Across all vaccine brands, people with prior COVID-19 were 2.6 times as likely after dose one to suffer an adverse reaction, according to the new study. Such people are commonly known as having a type of protection known as natural immunity after recovery.
People with previous COVID-19 were also 1.25 times as likely after dose 2 to experience an adverse reaction.
The findings held true across all vaccine types following dose one.
Of the female participants who received the Pfizer-BioNTech vaccine, for instance, 82 percent who had COVID-19 previously experienced an adverse reaction after their first dose, compared to 59 percent of females who did not have prior COVID-19.
The only exception to the trend was among males who received a second AstraZeneca dose. The percentage of males who suffered an adverse reaction was higher, 33 percent to 24 percent, among those without a COVID-19 history.
“Participants who had a prior SARS-CoV-2 infection (confirmed with a positive test) experienced at least one adverse reaction more often after the 1st dose compared to participants who did not have prior COVID-19. This pattern was observed in both men and women and across vaccine brands,” Florence van Hunsel, an epidemiologist with the Netherlands Pharmacovigilance Centre Lareb, and her co-authors wrote.
There were only slightly higher odds of the naturally immune suffering an adverse reaction following receipt of a Pfizer or Moderna booster, the researchers also found.
The researchers performed what’s known as a cohort event monitoring study, following 29,387 participants as they received at least one dose of a COVID-19 vaccine. The participants live in a European country such as Belgium, France, or Slovakia.
Overall, three-quarters of the participants reported at least one adverse reaction, although some were minor such as injection site pain.
Adverse reactions described as serious were reported by 0.24 percent of people who received a first or second dose and 0.26 percent for people who received a booster. Different examples of serious reactions were not listed in the study.
Participants were only specifically asked to record a range of minor adverse reactions (ADRs). They could provide details of other reactions in free text form.
“The unsolicited events were manually assessed and coded, and the seriousness was classified based on international criteria,” researchers said.
The free text answers were not provided by researchers in the paper.
“The authors note, ‘In this manuscript, the focus was not on serious ADRs and adverse events of special interest.’” Yet, in their highlights section they state, “The percentage of serious ADRs in the study is low for 1st and 2nd vaccination and booster.”
Dr. Joel Wallskog, co-chair of the group React19, which advocates for people who were injured by vaccines, told The Epoch Times: “It is intellectually dishonest to set out to study minor adverse events after COVID-19 vaccination then make conclusions about the frequency of serious adverse events. They also fail to provide the free text data.” He added that the paper showed “yet another study that is in my opinion, deficient by design.”
Ms. Hunsel did not respond to a request for comment.
She and other researchers listed limitations in the paper, including how they did not provide data broken down by country.
The paper was published by the journal Vaccine on March 6.
The study was funded by the European Medicines Agency and the Dutch government.
No authors declared conflicts of interest.
Some previous papers have also found that people with prior COVID-19 infection had more adverse events following COVID-19 vaccination, including a 2021 paper from French researchers. A U.S. study identified prior COVID-19 as a predictor of the severity of side effects.
Some other studies have determined COVID-19 vaccines confer little or no benefit to people with a history of infection, including those who had received a primary series.
The U.S. Centers for Disease Control and Prevention still recommends people who recovered from COVID-19 receive a COVID-19 vaccine, although a number of other health authorities have stopped recommending the shot for people who have prior COVID-19.
Another New Study
In another new paper, South Korean researchers outlined how they found people were more likely to report certain adverse reactions after COVID-19 vaccination than after receipt of another vaccine.
The reporting of myocarditis, a form of heart inflammation, or pericarditis, a related condition, was nearly 20 times as high among children as the reporting odds following receipt of all other vaccines, the researchers found.
The reporting odds were also much higher for multisystem inflammatory syndrome or Kawasaki disease among adolescent COVID-19 recipients.
Researchers analyzed reports made to VigiBase, which is run by the World Health Organization.
“Based on our results, close monitoring for these rare but serious inflammatory reactions after COVID-19 vaccination among adolescents until definitive causal relationship can be established,” the researchers wrote.
The study was published by the Journal of Korean Medical Science in its March edition.
Limitations include VigiBase receiving reports of problems, with some reports going unconfirmed.
Funding came from the South Korean government. One author reported receiving grants from pharmaceutical companies, including Pfizer.


Net Zero, The Digital Panopticon, & The Future Of Food


Problems After COVID-19 Vaccination More Prevalent Among Naturally Immune: Study


For-profit nursing homes are cutting corners on safety and draining resources with financial shenanigans − especially at midsize chains that dodge public scrutiny


Trump nearly derailed democracy once − here’s what to watch out for in reelection campaign


‘Excess Mortality Skyrocketed’: Tucker Carlson and Dr. Pierre Kory Unpack ‘Criminal’ COVID Response


Looking Back At COVID’s Authoritarian Regimes


Riley Gaines Explains How Women’s Sports Are Rigged To Promote The Trans Agenda


Health Officials: Man Dies From Bubonic Plague In New Mexico


MIPIM 2024 Reflects Mixed Feelings on CRE Recovery


Stock Market Today: Stocks turn lower as factory inflation spikes, retail sales miss target
-

 Uncategorized3 weeks ago
All Of The Elements Are In Place For An Economic Crisis Of Staggering Proportions
-

 International1 week ago
EyePoint poaches medical chief from Apellis; Sandoz CFO, longtime BioNTech exec to retire
-

 Uncategorized4 weeks ago
California Counties Could Be Forced To Pay $300 Million To Cover COVID-Era Program
-

 Uncategorized3 weeks ago
Apparel Retailer Express Moving Toward Bankruptcy
-

 Uncategorized4 weeks ago
Industrial Production Decreased 0.1% in January
-

 International7 days ago
Walmart launches clever answer to Target’s new membership program
-

 Spread & Containment2 days ago
IFM’s Hat Trick and Reflections On Option-To-Buy M&A
-

 Uncategorized4 weeks ago
RFK Jr: The Wuhan Cover-Up & The Rise Of The Biowarfare-Industrial Complex