Government
Goldman’s Clients Are Freaking Out About A Stock Bubble: Here Is The Bank’s Response
Goldman’s Clients Are Freaking Out About A Stock Bubble: Here Is The Bank’s Response
One doesn’t have to be a "legendary" investor to call out bubbles, especially once who correctly called the excesses of the dot com and housing eras, but…
Share this:


One doesn't have to be a "legendary" investor to call out bubbles, especially once who correctly called the excesses of the dot com and housing eras, but it helps and it's probably why Jeremy Grantham had such conviction last week when he said that not only is the market currently an "epic" bubble but that it will suffer a "spectacular" crash in "the next few months." Needless to say, such an alarmist view is hardly in the best interests of banks who make commissions on two-way trades instead of outright sales (or liquidations), but in a notable departure from tradition, several banks have joined Grantham in calling for a sharp market correction either imminently (Bank of America) or in the second half of the year (Wells Fargo).
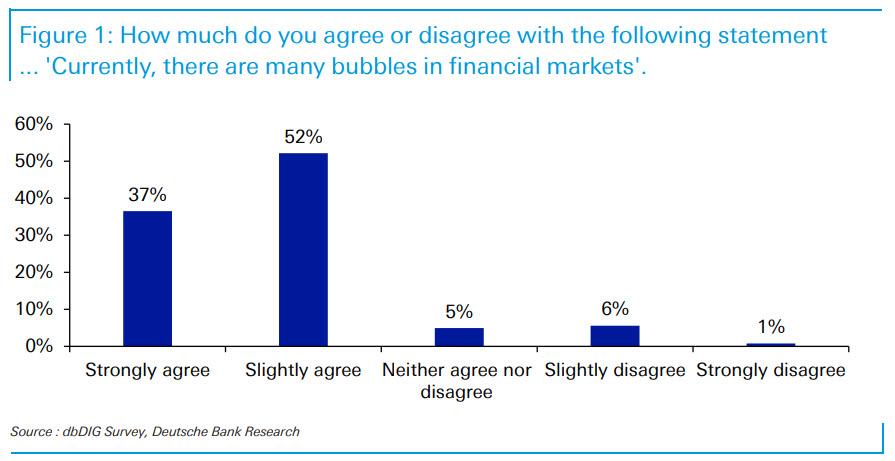
To be sure, concerns about an asset bubble have grown so widespread, with the latest Deutsche Bank survey finding the the vast majority of respondents (89%) see some bubbles in financial markets currently...
... that even Goldman's clients - traditionally among the most cheerful and optimistic of all, pied pipered by the perpetually bullish view of Goldman strategists - are starting to freak out.
As Goldman's chief equity strategist David Kostin writes in his latest Weekly Kickstart report, "among the questions we receive most frequently from clients is whether US stocks trade at unsustainably high levels (read: “Bubble”)."
So how can Goldman answer without sounding completely idiotic and disingenuous on one hand, denying that valuations are massively stretch and euphoria is everywhere as the latest Citi panic/euphoria model shows...

... yet without sparking a liquidation-driven market crash by admitting that it is in fact, a "massive bubble":
Well here's how Kostin delicately threads the needle: first, he admits that valuations have indeed rarely (read never) been higher, writing that "on an absolute basis there is no doubt that valuations are extremely elevated. The index trades at the upper end of the historical range when measured using a variety of metrics, including P/E, P/B, EV/sales, EV/EBITDA, and market cap/GDP. These measures point to equity valuation ranking in the 96th historical percentile (Exhibit 2)."

"However", he then quickly counters before readers call their favorite Goldman salesman and bark the "sell all" order, when "taking into account the yield on Treasuries, corporate credit, or cash, the aggregate stock market index trades at below-average historical valuation." Kostin then tries to ease lingering concerns that stocks are in a massive bubble (which they are), writing that "in fact, as economist Robert Shiller recently pointed out, his oft-cited CyclicallyAdjusted P/E Ratio (“CAPE”) shows that equity valuations are “not as absurd as some people think,” provided interest rates remain relatively low. Our economists forecast the 10-year Treasury yield will rise to just 1.5% at the end of 2021 and only exceed 2% in mid-2023."
Kostin here falls back to the only partially credible justification he can make for exorbitant valuations, namely that near-record low yields means that stocks are cheap compared to bonds, and thus deserving of high multiples.
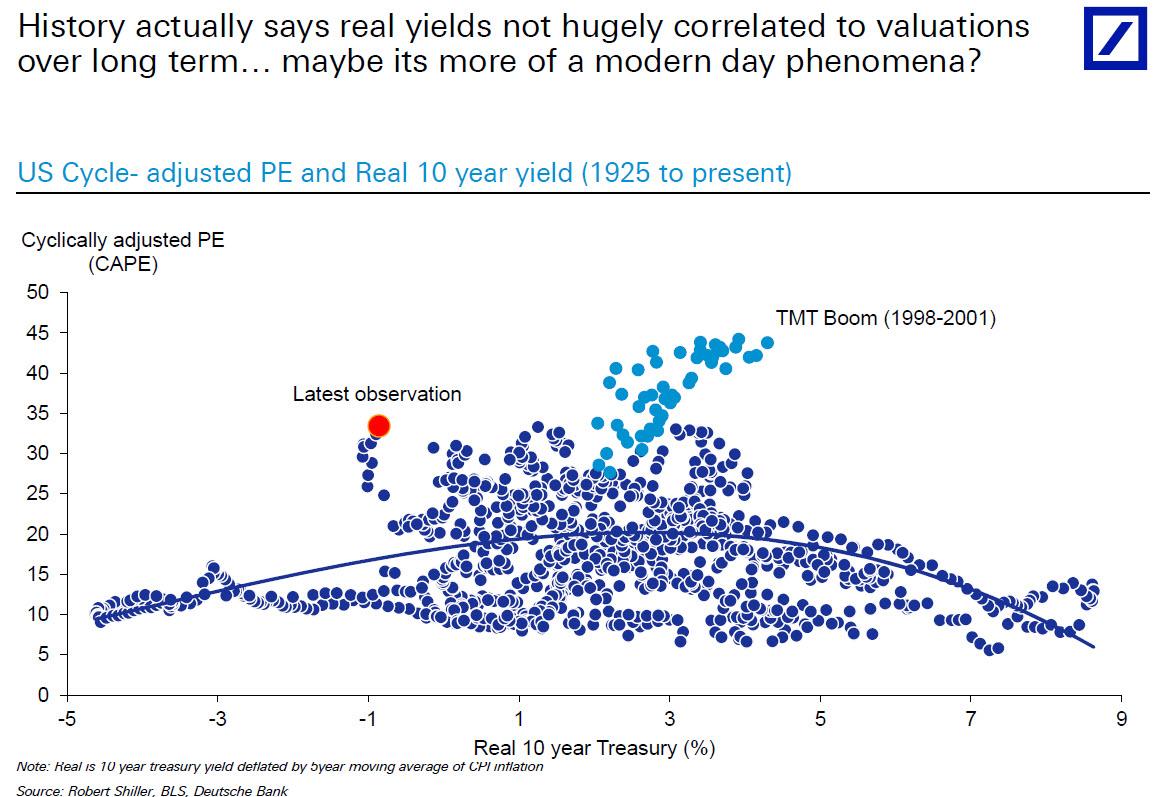
This, as we explained last December in "No, Low Rates Do Not Lead To Higher Earnings Multiples", is total rubbish since over time low real rates have never led to - or justified - the record market multiples except for cases when the market was infact in a bubble, and it's not just us making this observation but last week, Deutsche Bank's Jim Reid did too showing the following chart (which was adopted from Jerry Minack and which we first showed on Dec 5):
But why does Kostin, knowing well that his argument has already been debunked, keep making this ridiculous justification for continued buying of risk? Simple, because as he says in the very next sentence, "we expect modestly higher rates will be offset by a declining equity risk premium, leaving the S&P 500 P/E effectively unchanged and allowing strong EPS growth to drive the market towards our year-end target of 4300."
And there you have it: it's kinda tough to agree there is a bubble when your own S&P price target in 11 months is almost 500 points higher at least when it comes to Goldman's clients; the answer to what Goldman's prop book is doing now will have to wait until the congressional hearings after the bubble bursts. As a reminder, back in the 2007 bubble, Goldman's desk was actively betting on a housing crash by selling CDOs to the very same clients it told to buy CDOs (sometimes in collusion with other major clients such as Pauslon), knowing well that the crash was imminent. But we digress.
Anyway, back to Kostin who naturally realizes that any "all clear" signal would be immediately laughed out by most sophisticated finance professionals (with 89% of them already believing there is a bubble as the DB survey showed, he is caught between a rock and a hard place), and so he is forced to strategically caveat his cheerful assessment, writing that "although the aggregate equity market appears reasonably valued, pockets of the market have recently appeared to demonstrate investor behavior consistent with bubble-like sentiment."
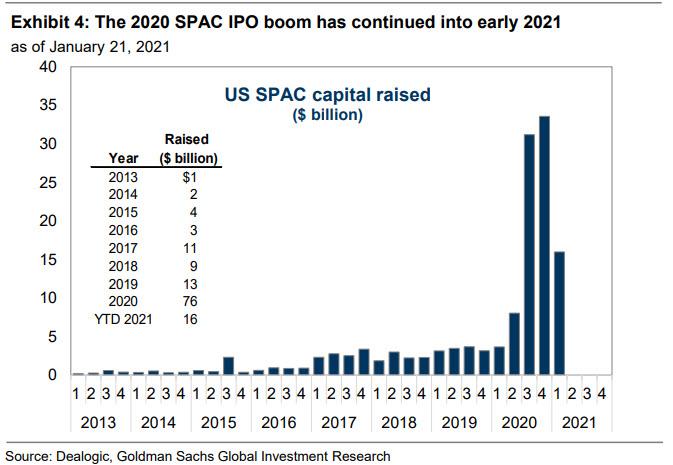
One such area is unbridled frowth is SPACs. As Kostin then notes, in 2020 (which he dubbed the “Year of the SPAC”), 229 US SPACs raised $76 billion, a figure 6 times greater than in 2019. During the first three weeks of 2021, another 56 SPACs have raised $16 billion, already half the total raised in all of Q4 2020.
According to Goldman calculations (which we presented previously), "if the 5x ratio of equity capital to target M&A enterprise value persists, the $80 billion of uncommitted SPAC capital would drive $400 billion in M&A during the next two years." However, as he also notes, that is conditional on each of those SPACs finding a suitable private company target and negotiating a merger.
Yet even as Kostin warns that Spacs are clearly one aspect of a market bubble, he doesn't see it as having dire consequences, to wit:
Low interest rates, the flexible structure, and the two-year window to find a target before returning capital suggest the popularity of SPACs will continue in the near term. Importantly, we see little risk to public equity markets should investor enthusiasm for SPACs subside.
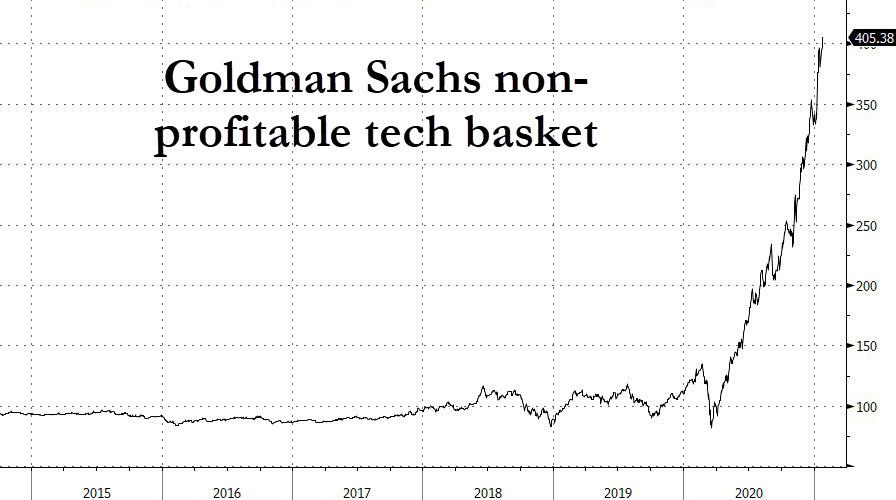
It's not just SPACs, however, that Goldman is telling its clients to be ware of - as the bank notes next, "the sharp recent outperformance of stocks with negative earnings is another potentially bubble-like phenomenon that many clients have highlighted. During the last 12 months, the shares of firms with negative LTM EBITDA have outpaced the average stock by 40 percentage points (82% vs. 42%), a 97th percentile ranking since 1985. By comparison, negative EBITDA stocks outperformed by a similar 30 pp following the Financial Crisis but by 140 pp in 1999-2000 during the Tech Bubble." This unprecedented surge in the stock prices of non-profitable tech companies is shown below. If anyone looks at this chart and says no bubble, they should never be allowed to opine on anything finance-related ever again.
Ok fine, at least Goldman admits that there are two clear bubble signs. Wait, wait... there's a third: as Kostin continues, even "more than the outperformance of negative earners, the recent surge in trading volumes of negative earnings stocks registers as a historical extreme. These firms account for 16% of equity trading volumes, exceeding the 15% share in 2000." Yet like above, Kostin is reduced to pleading with clients not to worry about this clear and grotesque bubble indicator either, because "although this surge appears unsustainable, it also appears to pose little risk to the broad market because these companies account for just 5% of total market cap." And just in case you start worrying about the insanity that has gripped retail daytrading, Kostin has some encouragement there too: "Similarly, the share of trading volumes in stocks with share prices below $1.00 has doubled in the last two months and ranks in the 99th historical percentile. But these firms only account for 1% of trading volume and less than half of 1% of market value."
Realizing that he has to expend on why he is dismissing all these clear bubble indicators so generously - or suffer total loss of credibility - Kostin then attempt to do just that, with the following two-paragraph "bubblesplainer":
Just like in past economic cycles, many stocks with negative earnings today were profitable companies that dipped into unprofitability during the recession.During economic recoveries investors often rotate their portfolios toward firms whose earnings and share prices suffered most during the downturns, particularly in a low interest rate environment that increases the present value of distant future cash flows. Trading activity in stocks with persistently negative earnings during the last three years – unprofitability that cannot be attributed to the pandemic recession –has also been extreme, but these firms amount to just 2% of equity market cap.
Today’s market also lacks the extreme investor leverage that is typical of bubbles. Due in large part to fiscal stimulus, US household disposable income growth was strong in 2020, and the outlook remains positive with further stimulus likely on the way. Excess savings remain elevated and the aggregate US household debt service ratio is nearly the lowest in at least 40 years. As a result, the strong recent inflows to US equities have apparently been funded by cash rather than leverage. While US margin debt has certainly risen in recent months, it currently registers a smaller share of market cap than it has as recently as during 2017-2018. And money market fund assets remain elevated after large inflows in 2020.
In short, yes - the chronic retail momentum-chasers are clearly scrambling to bid up bubble assets, but this in itself is not a risk as they haven't taken out a third mortgage to do it. Well, let's wait and see just how much leverage said Robinhooders and redditors have put on as they ravage shorts up and down the market. And that will become apparent only after the crash once the bubble pops, but there's no need to worry about that happening according to Kostin, because this time is different.
Yet one place where not even Kostin can't talk down the sheer bubbly euphoria is in high-multiple stocks. As the Goldman strategist admits, "one part of the market that appears frothy and may pose a broader risk is extremely high-growth, high-multiple stocks. Like negative earners and penny stocks, trading volumes and share prices of stocks with EV/sales multiples over 20x have soared. However, these firms are much larger, collectively accounting for 23% of trading volumes during the past month (96th percentile since 1985) and 9% of market cap."
Of course, even here Kostin has to provide some optimism, and does so by writing that some of this appreciation is appropriate "given record low interest rates. Firms with EV/sales ratios greater than 20x accounted for 2% of trading volumes in 2019. That share rose to 10% in August 2020 as interest rates plunged." However, with their share of volumes having doubled again during the most recent market rally...
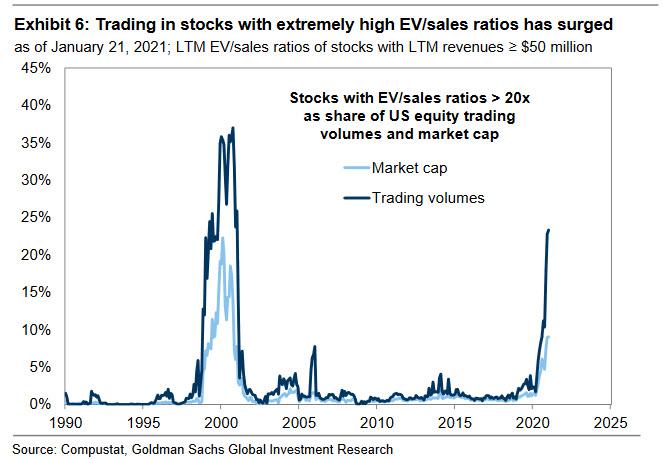
... Kostin concedes that "history shows investors face long odds of outperforming when buying the most extremely-valued firms." Why? Because since 1985, the median stock trading at an EV/sales multiple above 20x has generated a subsequent 12-month return of -1%, compared with +6% for the median US stock. The average stock trading above 20x has posted a stronger return, but still fared worse than the broad market average (+6% vs. +16%).

And just to placate all those Goldman clients who are calling bullshit on everything Kostin just said, he provides them with a handy screen of the 39 US stocks with market caps above $10 billion with both trailing and consensus 2022 EV/sales ratios greater than 20x.
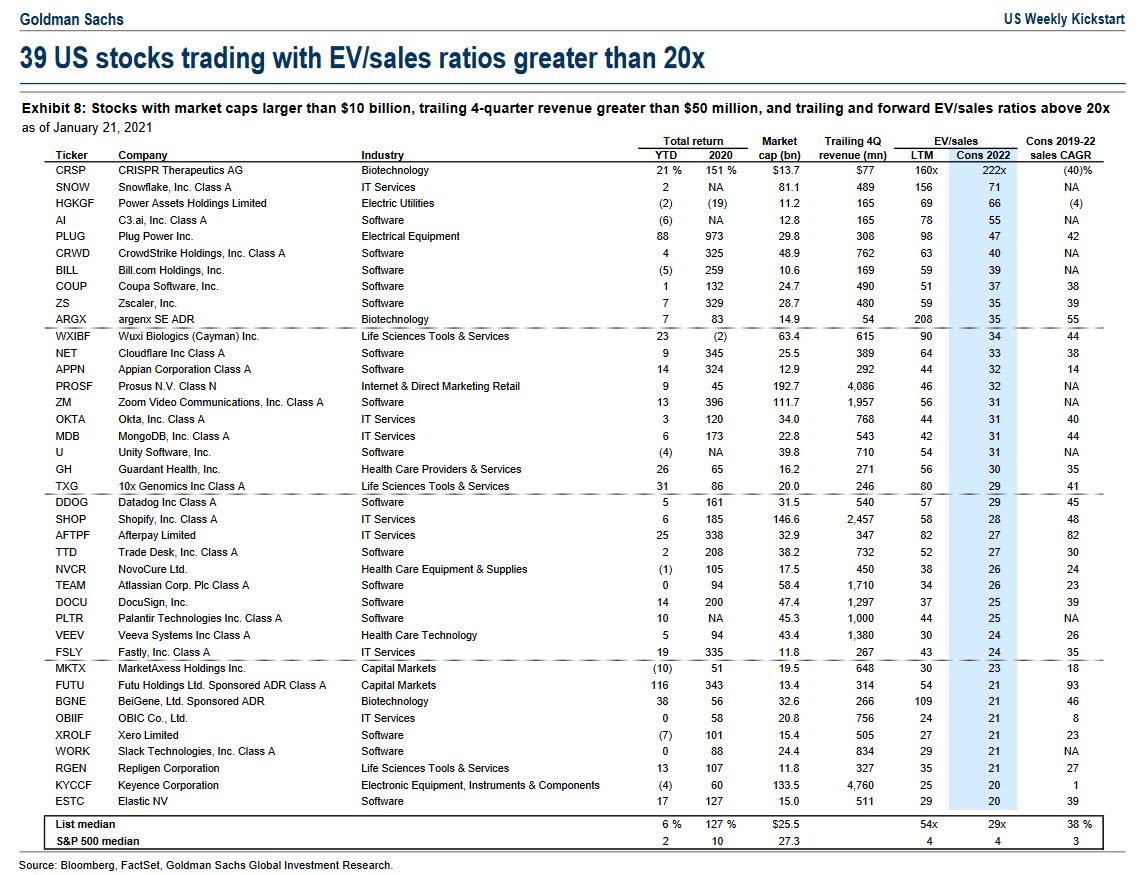
What Goldman is telling its clients here is "short these names if you are so worried about bubbles." Of course, what will ironically happen in the real world is that as another round of hedge funds piles into these berserker bubble names, the retail and reddit daytrading army will rush into them, forcing another epic short squeeze, and sending this basket of 39 stocks soaring to new even more berserker highs.
Why? Because of the very same entity we have been consistently bashing since our inception 12 years ago: the Federal Reserve of the United States, which first destroyed only capital markets, and is now set to finalize its real mandate - the destruction of not only the middle class but the United States itself, while unleashing what even Ray Dalio now admits will be a "terrible civil war."
International
Illegal Immigrants Leave US Hospitals With Billions In Unpaid Bills
Illegal Immigrants Leave US Hospitals With Billions In Unpaid Bills
By Autumn Spredemann of The Epoch Times
Tens of thousands of illegal…
Share this:

By Autumn Spredemann of The Epoch Times
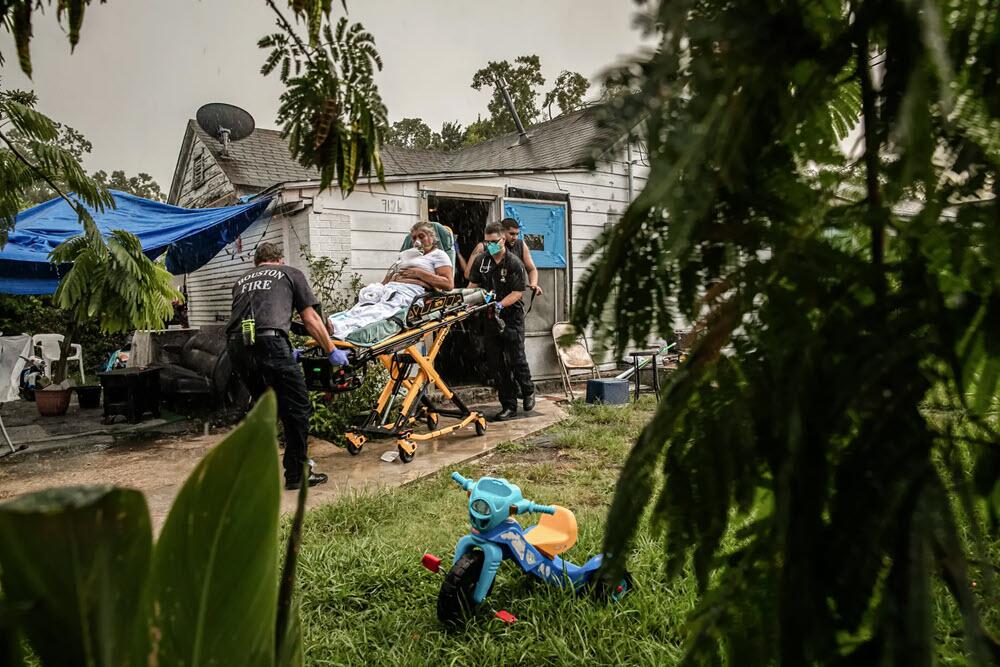
Tens of thousands of illegal immigrants are flooding into U.S. hospitals for treatment and leaving billions in uncompensated health care costs in their wake.
The House Committee on Homeland Security recently released a report illustrating that from the estimated $451 billion in annual costs stemming from the U.S. border crisis, a significant portion is going to health care for illegal immigrants.
With the majority of the illegal immigrant population lacking any kind of medical insurance, hospitals and government welfare programs such as Medicaid are feeling the weight of these unanticipated costs.
Apprehensions of illegal immigrants at the U.S. border have jumped 48 percent since the record in fiscal year 2021 and nearly tripled since fiscal year 2019, according to Customs and Border Protection data.
Last year broke a new record high for illegal border crossings, surpassing more than 3.2 million apprehensions.
And with that sea of humanity comes the need for health care and, in most cases, the inability to pay for it.
In January, CEO of Denver Health Donna Lynne told reporters that 8,000 illegal immigrants made roughly 20,000 visits to the city’s health system in 2023.
The total bill for uncompensated care costs last year to the system totaled $140 million, said Dane Roper, public information officer for Denver Health. More than $10 million of it was attributed to “care for new immigrants,” he told The Epoch Times.
Though the amount of debt assigned to illegal immigrants is a fraction of the total, uncompensated care costs in the Denver Health system have risen dramatically over the past few years.
The total uncompensated costs in 2020 came to $60 million, Mr. Roper said. In 2022, the number doubled, hitting $120 million.
He also said their city hospitals are treating issues such as “respiratory illnesses, GI [gastro-intenstinal] illnesses, dental disease, and some common chronic illnesses such as asthma and diabetes.”
“The perspective we’ve been trying to emphasize all along is that providing healthcare services for an influx of new immigrants who are unable to pay for their care is adding additional strain to an already significant uncompensated care burden,” Mr. Roper said.
He added this is why a local, state, and federal response to the needs of the new illegal immigrant population is “so important.”
Colorado is far from the only state struggling with a trail of unpaid hospital bills.
Dr. Robert Trenschel, CEO of the Yuma Regional Medical Center situated on the Arizona–Mexico border, said on average, illegal immigrants cost up to three times more in human resources to resolve their cases and provide a safe discharge.
“Some [illegal] migrants come with minor ailments, but many of them come in with significant disease,” Dr. Trenschel said during a congressional hearing last year.
“We’ve had migrant patients on dialysis, cardiac catheterization, and in need of heart surgery. Many are very sick.”
He said many illegal immigrants who enter the country and need medical assistance end up staying in the ICU ward for 60 days or more.
A large portion of the patients are pregnant women who’ve had little to no prenatal treatment. This has resulted in an increase in babies being born that require neonatal care for 30 days or longer.
Dr. Trenschel told The Epoch Times last year that illegal immigrants were overrunning healthcare services in his town, leaving the hospital with $26 million in unpaid medical bills in just 12 months.
ER Duty to Care
The Emergency Medical Treatment and Labor Act of 1986 requires that public hospitals participating in Medicare “must medically screen all persons seeking emergency care … regardless of payment method or insurance status.”
The numbers are difficult to gauge as the policy position of the Centers for Medicare & Medicaid Services (CMS) is that it “will not require hospital staff to ask patients directly about their citizenship or immigration status.”
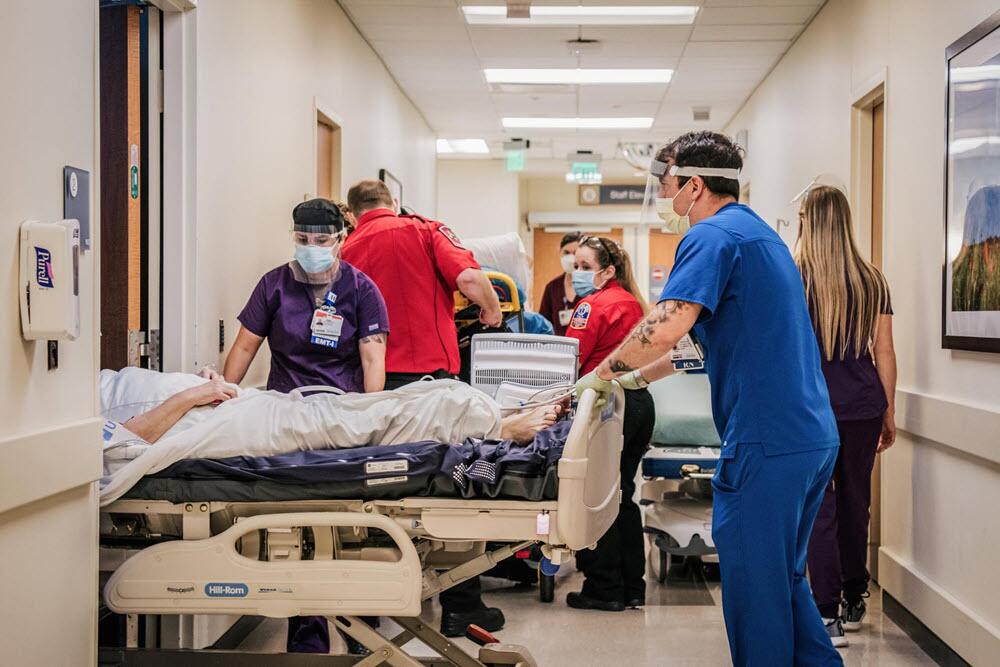
In southern California, again close to the border with Mexico, some hospitals are struggling with an influx of illegal immigrants.
American patients are enduring longer wait times for doctor appointments due to a nursing shortage in the state, two health care professionals told The Epoch Times in January.
A health care worker at a hospital in Southern California, who asked not to be named for fear of losing her job, told The Epoch Times that “the entire health care system is just being bombarded” by a steady stream of illegal immigrants.
“Our healthcare system is so overwhelmed, and then add on top of that tuberculosis, COVID-19, and other diseases from all over the world,” she said.

A newly-enacted law in California provides free healthcare for all illegal immigrants residing in the state. The law could cost taxpayers between $3 billion and $6 billion per year, according to recent estimates by state and federal lawmakers.
In New York, where the illegal immigration crisis has manifested most notably beyond the southern border, city and state officials have long been accommodating of illegal immigrants’ healthcare costs.
Since June 2014, when then-mayor Bill de Blasio set up The Task Force on Immigrant Health Care Access, New York City has worked to expand avenues for illegal immigrants to get free health care.
“New York City has a moral duty to ensure that all its residents have meaningful access to needed health care, regardless of their immigration status or ability to pay,” Mr. de Blasio stated in a 2015 report.
The report notes that in 2013, nearly 64 percent of illegal immigrants were uninsured. Since then, tens of thousands of illegal immigrants have settled in the city.
“The uninsured rate for undocumented immigrants is more than three times that of other noncitizens in New York City (20 percent) and more than six times greater than the uninsured rate for the rest of the city (10 percent),” the report states.
The report states that because healthcare providers don’t ask patients about documentation status, the task force lacks “data specific to undocumented patients.”
Some health care providers say a big part of the issue is that without a clear path to insurance or payment for non-emergency services, illegal immigrants are going to the hospital due to a lack of options.
“It’s insane, and it has been for years at this point,” Dana, a Texas emergency room nurse who asked to have her full name omitted, told The Epoch Times.
Working for a major hospital system in the greater Houston area, Dana has seen “a zillion” migrants pass through under her watch with “no end in sight.” She said many who are illegal immigrants arrive with treatable illnesses that require simple antibiotics. “Not a lot of GPs [general practitioners] will see you if you can’t pay and don’t have insurance.”
She said the “undocumented crowd” tends to arrive with a lot of the same conditions. Many find their way to Houston not long after crossing the southern border. Some of the common health issues Dana encounters include dehydration, unhealed fractures, respiratory illnesses, stomach ailments, and pregnancy-related concerns.
“This isn’t a new problem, it’s just worse now,” Dana said.
Medicaid Factor
One of the main government healthcare resources illegal immigrants use is Medicaid.
All those who don’t qualify for regular Medicaid are eligible for Emergency Medicaid, regardless of immigration status. By doing this, the program helps pay for the cost of uncompensated care bills at qualifying hospitals.
However, some loopholes allow access to the regular Medicaid benefits. “Qualified noncitizens” who haven’t been granted legal status within five years still qualify if they’re listed as a refugee, an asylum seeker, or a Cuban or Haitian national.
Yet the lion’s share of Medicaid usage by illegal immigrants still comes through state-level benefits and emergency medical treatment.
A Congressional report highlighted data from the CMS, which showed total Medicaid costs for “emergency services for undocumented aliens” in fiscal year 2021 surpassed $7 billion, and totaled more than $5 billion in fiscal 2022.
Both years represent a significant spike from the $3 billion in fiscal 2020.
An employee working with Medicaid who asked to be referred to only as Jennifer out of concern for her job, told The Epoch Times that at a state level, it’s easy for an illegal immigrant to access the program benefits.
Jennifer said that when exceptions are sent from states to CMS for approval, “denial is actually super rare. It’s usually always approved.”
She also said it comes as no surprise that many of the states with the highest amount of Medicaid spending are sanctuary states, which tend to have policies and laws that shield illegal immigrants from federal immigration authorities.
Moreover, Jennifer said there are ways for states to get around CMS guidelines. “It’s not easy, but it can and has been done.”
The first generation of illegal immigrants who arrive to the United States tend to be healthy enough to pass any pre-screenings, but Jennifer has observed that the subsequent generations tend to be sicker and require more access to care. If a family is illegally present, they tend to use Emergency Medicaid or nothing at all.
The Epoch Times asked Medicaid Services to provide the most recent data for the total uncompensated care that hospitals have reported. The agency didn’t respond.
Continue reading over at The Epoch Times
International
Fuel poverty in England is probably 2.5 times higher than government statistics show
The top 40% most energy efficient homes aren’t counted as being in fuel poverty, no matter what their bills or income are.
Share this:


The cap set on how much UK energy suppliers can charge for domestic gas and electricity is set to fall by 15% from April 1 2024. Despite this, prices remain shockingly high. The average household energy bill in 2023 was £2,592 a year, dwarfing the pre-pandemic average of £1,308 in 2019.
The term “fuel poverty” refers to a household’s ability to afford the energy required to maintain adequate warmth and the use of other essential appliances. Quite how it is measured varies from country to country. In England, the government uses what is known as the low income low energy efficiency (Lilee) indicator.
Since energy costs started rising sharply in 2021, UK households’ spending powers have plummeted. It would be reasonable to assume that these increasingly hostile economic conditions have caused fuel poverty rates to rise.
However, according to the Lilee fuel poverty metric, in England there have only been modest changes in fuel poverty incidence year on year. In fact, government statistics show a slight decrease in the nationwide rate, from 13.2% in 2020 to 13.0% in 2023.
Our recent study suggests that these figures are incorrect. We estimate the rate of fuel poverty in England to be around 2.5 times higher than what the government’s statistics show, because the criteria underpinning the Lilee estimation process leaves out a large number of financially vulnerable households which, in reality, are unable to afford and maintain adequate warmth.

Energy security
In 2022, we undertook an in-depth analysis of Lilee fuel poverty in Greater London. First, we combined fuel poverty, housing and employment data to provide an estimate of vulnerable homes which are omitted from Lilee statistics.
We also surveyed 2,886 residents of Greater London about their experiences of fuel poverty during the winter of 2022. We wanted to gauge energy security, which refers to a type of self-reported fuel poverty. Both parts of the study aimed to demonstrate the potential flaws of the Lilee definition.
Introduced in 2019, the Lilee metric considers a household to be “fuel poor” if it meets two criteria. First, after accounting for energy expenses, its income must fall below the poverty line (which is 60% of median income).
Second, the property must have an energy performance certificate (EPC) rating of D–G (the lowest four ratings). The government’s apparent logic for the Lilee metric is to quicken the net-zero transition of the housing sector.
In Sustainable Warmth, the policy paper that defined the Lilee approach, the government says that EPC A–C-rated homes “will not significantly benefit from energy-efficiency measures”. Hence, the focus on fuel poverty in D–G-rated properties.
Generally speaking, EPC A–C-rated homes (those with the highest three ratings) are considered energy efficient, while D–G-rated homes are deemed inefficient. The problem with how Lilee fuel poverty is measured is that the process assumes that EPC A–C-rated homes are too “energy efficient” to be considered fuel poor: the main focus of the fuel poverty assessment is a characteristic of the property, not the occupant’s financial situation.
In other words, by this metric, anyone living in an energy-efficient home cannot be considered to be in fuel poverty, no matter their financial situation. There is an obvious flaw here.
Around 40% of homes in England have an EPC rating of A–C. According to the Lilee definition, none of these homes can or ever will be classed as fuel poor. Even though energy prices are going through the roof, a single-parent household with dependent children whose only income is universal credit (or some other form of benefits) will still not be considered to be living in fuel poverty if their home is rated A-C.
The lack of protection afforded to these households against an extremely volatile energy market is highly concerning.
In our study, we estimate that 4.4% of London’s homes are rated A-C and also financially vulnerable. That is around 171,091 households, which are currently omitted by the Lilee metric but remain highly likely to be unable to afford adequate energy.
In most other European nations, what is known as the 10% indicator is used to gauge fuel poverty. This metric, which was also used in England from the 1990s until the mid 2010s, considers a home to be fuel poor if more than 10% of income is spent on energy. Here, the main focus of the fuel poverty assessment is the occupant’s financial situation, not the property.
Were such alternative fuel poverty metrics to be employed, a significant portion of those 171,091 households in London would almost certainly qualify as fuel poor.
This is confirmed by the findings of our survey. Our data shows that 28.2% of the 2,886 people who responded were “energy insecure”. This includes being unable to afford energy, making involuntary spending trade-offs between food and energy, and falling behind on energy payments.
Worryingly, we found that the rate of energy insecurity in the survey sample is around 2.5 times higher than the official rate of fuel poverty in London (11.5%), as assessed according to the Lilee metric.
It is likely that this figure can be extrapolated for the rest of England. If anything, energy insecurity may be even higher in other regions, given that Londoners tend to have higher-than-average household income.
The UK government is wrongly omitting hundreds of thousands of English households from fuel poverty statistics. Without a more accurate measure, vulnerable households will continue to be overlooked and not get the assistance they desperately need to stay warm.
Torran Semple receives funding from Engineering and Physical Sciences Research Council (EPSRC) grant EP/S023305/1.
John Harvey does not work for, consult, own shares in or receive funding from any company or organisation that would benefit from this article, and has disclosed no relevant affiliations beyond their academic appointment.
european uk pandemicGovernment
Looking Back At COVID’s Authoritarian Regimes
After having moved from Canada to the United States, partly to be wealthier and partly to be freer (those two are connected, by the way), I was shocked,…
Share this:


After having moved from Canada to the United States, partly to be wealthier and partly to be freer (those two are connected, by the way), I was shocked, in March 2020, when President Trump and most US governors imposed heavy restrictions on people’s freedom. The purpose, said Trump and his COVID-19 advisers, was to “flatten the curve”: shut down people’s mobility for two weeks so that hospitals could catch up with the expected demand from COVID patients. In her book Silent Invasion, Dr. Deborah Birx, the coordinator of the White House Coronavirus Task Force, admitted that she was scrambling during those two weeks to come up with a reason to extend the lockdowns for much longer. As she put it, “I didn’t have the numbers in front of me yet to make the case for extending it longer, but I had two weeks to get them.” In short, she chose the goal and then tried to find the data to justify the goal. This, by the way, was from someone who, along with her task force colleague Dr. Anthony Fauci, kept talking about the importance of the scientific method. By the end of April 2020, the term “flatten the curve” had all but disappeared from public discussion.
Now that we are four years past that awful time, it makes sense to look back and see whether those heavy restrictions on the lives of people of all ages made sense. I’ll save you the suspense. They didn’t. The damage to the economy was huge. Remember that “the economy” is not a term used to describe a big machine; it’s a shorthand for the trillions of interactions among hundreds of millions of people. The lockdowns and the subsequent federal spending ballooned the budget deficit and consequent federal debt. The effect on children’s learning, not just in school but outside of school, was huge. These effects will be with us for a long time. It’s not as if there wasn’t another way to go. The people who came up with the idea of lockdowns did so on the basis of abstract models that had not been tested. They ignored a model of human behavior, which I’ll call Hayekian, that is tested every day.
These are the opening two paragraphs of my latest Defining Ideas article, “Looking Back at COVID’s Authoritarian Regimes,” Defining Ideas, March 14, 2024.
Another excerpt:
That wasn’t the only uncertainty. My daughter Karen lived in San Francisco and made her living teaching Pilates. San Francisco mayor London Breed shut down all the gyms, and so there went my daughter’s business. (The good news was that she quickly got online and shifted many of her clients to virtual Pilates. But that’s another story.) We tried to see her every six weeks or so, whether that meant our driving up to San Fran or her driving down to Monterey. But were we allowed to drive to see her? In that first month and a half, we simply didn’t know.
Read the whole thing, which is longer than usual.
(0 COMMENTS) budget deficit coronavirus covid-19 white house fauci trump canada

Problems After COVID-19 Vaccination More Prevalent Among Naturally Immune: Study


For-profit nursing homes are cutting corners on safety and draining resources with financial shenanigans − especially at midsize chains that dodge public scrutiny


Looking Back At COVID’s Authoritarian Regimes


Trump nearly derailed democracy once − here’s what to watch out for in reelection campaign


Health Officials: Man Dies From Bubonic Plague In New Mexico


The SNF Institute for Global Infectious Disease Research announces new advisory board


Five Aerospace Investments to Buy as Wars Worsen Copy


Stock Market Today: Stocks turn lower as factory inflation spikes, retail sales miss target


COVID-19 vaccines: CDC says people ages 65 and up should get a shot this spring – a geriatrician explains why it’s vitally important


RFK Jr. Reveals Vice President Contenders
-

 Uncategorized3 weeks ago
All Of The Elements Are In Place For An Economic Crisis Of Staggering Proportions
-

 International1 week ago
EyePoint poaches medical chief from Apellis; Sandoz CFO, longtime BioNTech exec to retire
-

 Uncategorized4 weeks ago
California Counties Could Be Forced To Pay $300 Million To Cover COVID-Era Program
-

 Uncategorized3 weeks ago
Apparel Retailer Express Moving Toward Bankruptcy
-

 Uncategorized4 weeks ago
Industrial Production Decreased 0.1% in January
-

 International1 week ago
Walmart launches clever answer to Target’s new membership program
-

 Spread & Containment2 days ago
IFM’s Hat Trick and Reflections On Option-To-Buy M&A
-

 Uncategorized4 weeks ago
RFK Jr: The Wuhan Cover-Up & The Rise Of The Biowarfare-Industrial Complex