Uncategorized
Global Safes and Vaults Market to Reach $13.8 Billion by 2030
Global Safes and Vaults Market to Reach $13.8 Billion by 2030
PR Newswire
NEW YORK, March 14, 2023
NEW YORK, March 14, 2023 /PRNewswire/ — The global economy is at a critical crossroads with a number of interlocking challenges and crises running i…
Share this:

Global Safes and Vaults Market to Reach $13.8 Billion by 2030
PR Newswire
NEW YORK, March 14, 2023
NEW YORK, March 14, 2023 /PRNewswire/ -- The global economy is at a critical crossroads with a number of interlocking challenges and crises running in parallel. The uncertainty around how Russia`s war on Ukraine will play out this year and the war`s role in creating global instability means that the trouble on the inflation front is not over yet. Food and fuel inflation will remain a persistent economic problem. Higher retail inflation will impact consumer confidence and spending. As governments combat inflation by raising interest rates, new job creation will slowdown and impact economic activity and growth. Lower capital expenditure is in the offing as companies go slow on investments, held back by inflation worries and weaker demand. With slower growth and high inflation, developed markets seem primed to enter into a recession. Fears of new COVID outbreaks and China's already uncertain post-pandemic path poses a real risk of the world experiencing more acute supply chain pain and manufacturing disruptions this year. Volatile financial markets, growing trade tensions, stricter regulatory environment and pressure to mainstream climate change into economic decisions will compound the complexity of challenges faced. Year 2023 is expected to be tough year for most markets, investors and consumers. Nevertheless, there is always opportunity for businesses and their leaders who can chart a path forward with resilience and adaptability.
Read the full report: https://www.reportlinker.com/p090635/?utm_source=PRN
Global Safes and Vaults Market to Reach $13.8 Billion by 2030
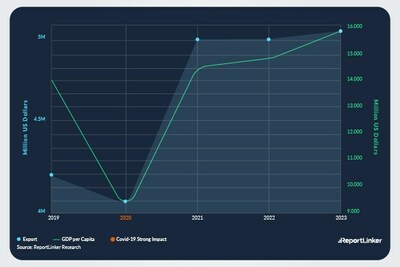
In the changed post COVID-19 business landscape, the global market for Safes and Vaults estimated at US$7.9 Billion in the year 2022, is projected to reach a revised size of US$13.8 Billion by 2030, growing at aCAGR of 7.3% over the period 2022-2030. Safes, one of the segments analyzed in the report, is projected to record 8.3% CAGR and reach US$9.5 Billion by the end of the analysis period. Taking into account the ongoing post pandemic recovery, growth in the Vaults segment is readjusted to a revised 5.3% CAGR for the next 8-year period.
The U.S. Market is Estimated at $2.1 Billion, While China is Forecast to Grow at 12.5% CAGR
The Safes and Vaults market in the U.S. is estimated at US$2.1 Billion in the year 2022. China, the world`s second largest economy, is forecast to reach a projected market size of US$3.4 Billion by the year 2030 trailing a CAGR of 12.5% over the analysis period 2022 to 2030. Among the other noteworthy geographic markets are Japan and Canada, each forecast to grow at 2.5% and 6.1% respectively over the 2022-2030 period. Within Europe, Germany is forecast to grow at approximately 3.8% CAGR.
Select Competitors (Total 137 Featured)
- Access Security Products Ltd.
- Acme Safe Company
- Allied Fire & Security
- Alpha Safe & Vault, Inc.
- ASSA ABLOY Hospitality
- BJARSTAL sarl
- Bode-Panzer GmbH
- Bordogna S.r.l
- Brown Safe Manufacturing, Inc.
- Cannon Safe, Inc.
- Citysafe
- Diebold Nixdorf
- dormakaba Holding AG
- FireKing Security Group
- Firelock Fireproof Modular Vaults
- Format Tresorbau GmbH & Co. KG
- Fort Knox Inc.
- Godrej & Boyce Mfg. Co., Ltd.
- Gunnebo AB
- Hall`s Safe Company
- Hayman Safe Company, Inc.
- Juwel Srl
- KASO Oy
- Liberty Safe and Security Products, Inc.
- Onity
- Phoenix Safe Company Limited
- Technomax Srl
Read the full report: https://www.reportlinker.com/p090635/?utm_source=PRN
I. METHODOLOGY
II. EXECUTIVE SUMMARY
1. MARKET OVERVIEW
Influencer Market Insights
World Market Trajectories
Safes and Vaults: Safeguarding and Securing Assets for a Safer
Future
Recent Market Activity
Rising Asset Safety Concerns & an Increasingly Security-
Conscious Society: Foundation for Market Growth
Important Factors Driving Widespread Adoption over the Years
Consumer Perception of Crime
Regulatory Mandates
Product Innovations & Introductions
Global Market Outlook
Developing Countries Continue to Power Current and Future
Market Growth
Rise of Agency Banking Channel Propels Demand for Small and
Mid-Sized Safes and Vaults
Stable Growth Fundamentals Present Optimistic Market Outlook
Safes and Vaults - Global Key Competitors Percentage Market
Share in 2022 (E)
Competitive Market Presence - Strong/Active/Niche/Trivial for
Players Worldwide in 2022 (E)
Impact of Covid-19 and a Looming Global Recession
2. FOCUS ON SELECT PLAYERS
Access Security Products Ltd. (Canada)
Acme Safe Company (USA)
Allied Fire & Security (USA)
Amsec (USA)
Gardall Safe Corporation (USA)
Alpha Safe & Vault, Inc. (USA)
ASSA ABLOY Hospitality (USA)
BJARSTAL sarl (France)
Bode-Panzer GmbH (Germany)
Bordogna S.r.l (Italy)
Brown Safe Manufacturing, Inc. (USA)
Bumil Safe Mfg. Co., Ltd. (Korea)
Cannon Safe, Inc. (USA)
Citysafe (USA)
Diebold Nixdorf (USA)
dormakaba Holding AG (Switzerland)
Firelock Fireproof Modular Vaults (USA)
FireKing Security Group (USA)
Format Tresorbau GmbH & Co. KG (Germany)
Fort Knox Inc. (USA)
GARDEX Inc. (Canada)
Godrej & Boyce Mfg. Co., Ltd. (India)
Gunnebo AB (Sweden)
Chubb Safes Ltd. (UK)
Hamilton Safe (USA)
Fichet-Bauche SA (France)
Hall?s Safe Company (USA)
Hayman Safe Company, Inc. (USA)
Juwel Srl (Italy)
KASO Oy (Finland)
Liberty Safe and Security Products, Inc. (USA)
Onity (USA)
Phoenix Safe Company Limited (UK)
Sentry Group, Inc. (USA)
Stark Safes Srl (Italy)
Technomax Srl (Italy)
3. MARKET TRENDS & DRIVERS
Non-Banking Safes to Witness Higher Growth
Government Regulations Drive Innovations in Data Vaults
Surging Demand for Biometric Safes and Vaults Drives Healthy
Market Growth
Market Drivers
Market Inhibitors
Myriad Benefits of Biometric Safes over Traditional Safes Lead
to Widespread Market Adoption
Limitations of Traditional Lock Systems
Benefits of Fingerprint Recognition
Legal Considerations
Growing Popularity of Smart Safes in Retail Outlets Benefits
Market Expansion
Key Benefits Offered by Smart Safes to Retailers
Increasing ATM Deployments Drive Strong Growth in Demand for
Cash Safes
Multi-Purpose ATMs Spur Demand for Depository Safes
Dial Locks Versus Electronics Locks: Where Does the Future Lie?
Convergence with Advanced Communication Technologies Set to
Become a Norm
Sophisticated Gun Safes and Vaults for Home Defense
Vault Management Systems
Automatic Safe Dialer
Portable Teller Units
Controlled Environment Vault (CEV)
Specialized Vaults with Computerized Locks
Urgent Need to Manage Firearms Possession Boosts Demand for Gun
Safes
Government Compliance Regulations Power Growth for Gun Safes
and Vaults
Key Considerations while Selecting Gun Safe Models
Gun Safes Manufacturers Innovate to Stay Ahead of the Game
Steel
More Stylish Designs
Improved Locking Systems
Alarms and Additional Features
Faster Access
Multifunctional Use
Discrete Concealment
Mounting Digital Media Penetration Augurs Well for Data Media
Safes
Safes and Vaults Emerge as Key Customer Service Strategy in
Hospitality Industry
Portable Safes Emerge as a Potent Instrument of Security for
Frequent Travelers
Government, Military & Security Services: Dominant Users of
Safes and Vaults
Wall & Floor Safes Continue to Remain a Popular Option
Sales of Home Safes Gain Momentum
Modular Safes Offer Easy Portability and Installation
Fireproof Safes Provide Efficient Protection from Intense Heat
Custom Safes: A Suitable Option for Addressing Diverse Needs
Housing Construction & Renovation: An Important Growth Driver
Safes and Vaults Standards: Essential for High-end Security Models
Safes and Vaults Innovations and Advancements: Spearheading Growth
Internet Protocol (IP) Enabled Safes: The Next Big Thing in
Safe Technology
Next-Generation Gun Safes and Vaults for Vehicles
Advanced Storage Options from Tuffy Security Products
TrunkVault and TruckTuff Dog Kennel by TruckVault
Smart Vaults: The Future of Bank Vaults
Sensor Integration Remains Key to Ensuring Security
Portable Safe for Diamonds and Jewelry
Unbreakable Piggy Bank
Select Innovative and Advanced Gun Safes and Vaults
1420M Bundle by Tactical Walls
Beast Safe by Browning
Biometric Pistol Vault by Bulldog
Biometric Wall Safe by Barska
Digital Personal Vault by Bulldog Cases
Hawk Secure-it
Knight TAC-75 by Pendleton
Magnum RFID/LED Quick Vault by Bulldog Cases
PV1000 by Browning
Quick Access Rifle Safe by Barska
Quick Vent and QuickShelf Safes by QuickSafes
RAPiD Safe and RAPiD Safe 2600 by Hornady
Revolution Safe Stronghold XL Tactical Edition
Slide Away Safe by V-Line
SpeedVault by GunVault
Super-Size Biometric Safe by Stack-On
The GunBox
4. GLOBAL MARKET PERSPECTIVE
Table 1: World Recent Past, Current & Future Analysis for Safes
and Vaults by Geographic Region - USA, Canada, Japan, China,
Europe, Asia-Pacific, Latin America, Middle East and Africa
Markets - Independent Analysis of Annual Sales in US$ Million
for Years 2022 through 2030 and % CAGR
Table 2: World Historic Review for Safes and Vaults by
Geographic Region - USA, Canada, Japan, China, Europe,
Asia-Pacific, Latin America, Middle East and Africa Markets -
Independent Analysis of Annual Sales in US$ Million for Years
2014 through 2021 and % CAGR
Table 3: World 16-Year Perspective for Safes and Vaults by
Geographic Region - Percentage Breakdown of Value Sales for
USA, Canada, Japan, China, Europe, Asia-Pacific, Latin America,
Middle East and Africa Markets for Years 2014, 2023 & 2030
Table 4: World Recent Past, Current & Future Analysis for Safes
by Geographic Region - USA, Canada, Japan, China, Europe,
Asia-Pacific, Latin America, Middle East and Africa Markets -
Independent Analysis of Annual Sales in US$ Million for Years
2022 through 2030 and % CAGR
Table 5: World Historic Review for Safes by Geographic Region -
USA, Canada, Japan, China, Europe, Asia-Pacific, Latin America,
Middle East and Africa Markets - Independent Analysis of Annual
Sales in US$ Million for Years 2014 through 2021 and % CAGR
Table 6: World 16-Year Perspective for Safes by Geographic
Region - Percentage Breakdown of Value Sales for USA, Canada,
Japan, China, Europe, Asia-Pacific, Latin America, Middle East
and Africa for Years 2014, 2023 & 2030
Table 7: World Recent Past, Current & Future Analysis for
Vaults by Geographic Region - USA, Canada, Japan, China,
Europe, Asia-Pacific, Latin America, Middle East and Africa
Markets - Independent Analysis of Annual Sales in US$ Million
for Years 2022 through 2030 and % CAGR
Table 8: World Historic Review for Vaults by Geographic Region -
USA, Canada, Japan, China, Europe, Asia-Pacific, Latin
America, Middle East and Africa Markets - Independent Analysis
of Annual Sales in US$ Million for Years 2014 through 2021 and
% CAGR
Table 9: World 16-Year Perspective for Vaults by Geographic
Region - Percentage Breakdown of Value Sales for USA, Canada,
Japan, China, Europe, Asia-Pacific, Latin America, Middle East
and Africa for Years 2014, 2023 & 2030
Table 10: World Safes and Vaults Market Analysis of Annual
Sales in US$ Million for Years 2014 through 2030
III. MARKET ANALYSIS
UNITED STATES
Safes and Vaults Market Presence - Strong/Active/Niche/Trivial -
Key Competitors in the United States for 2023 (E)
Table 11: USA Recent Past, Current & Future Analysis for Safes
and Vaults by Segment - Safes and Vaults - Independent Analysis
of Annual Sales in US$ Million for the Years 2022 through 2030
and % CAGR
Table 12: USA Historic Review for Safes and Vaults by Segment -
Safes and Vaults Markets - Independent Analysis of Annual Sales
in US$ Million for Years 2014 through 2021 and % CAGR
Table 13: USA 16-Year Perspective for Safes and Vaults by
Segment - Percentage Breakdown of Value Sales for Safes and
Vaults for the Years 2014, 2023 & 2030
CANADA
Table 14: Canada Recent Past, Current & Future Analysis for
Safes and Vaults by Segment - Safes and Vaults - Independent
Analysis of Annual Sales in US$ Million for the Years 2022
through 2030 and % CAGR
Table 15: Canada Historic Review for Safes and Vaults by
Segment - Safes and Vaults Markets - Independent Analysis of
Annual Sales in US$ Million for Years 2014 through 2021 and %
CAGR
Table 16: Canada 16-Year Perspective for Safes and Vaults by
Segment - Percentage Breakdown of Value Sales for Safes and
Vaults for the Years 2014, 2023 & 2030
JAPAN
Safes and Vaults Market Presence - Strong/Active/Niche/Trivial -
Key Competitors in Japan for 2023 (E)
Table 17: Japan Recent Past, Current & Future Analysis for
Safes and Vaults by Segment - Safes and Vaults - Independent
Analysis of Annual Sales in US$ Million for the Years 2022
through 2030 and % CAGR
Table 18: Japan Historic Review for Safes and Vaults by Segment -
Safes and Vaults Markets - Independent Analysis of Annual
Sales in US$ Million for Years 2014 through 2021 and % CAGR
Table 19: Japan 16-Year Perspective for Safes and Vaults by
Segment - Percentage Breakdown of Value Sales for Safes and
Vaults for the Years 2014, 2023 & 2030
CHINA
Safes and Vaults Market Presence - Strong/Active/Niche/Trivial -
Key Competitors in China for 2023 (E)
Table 20: China Recent Past, Current & Future Analysis for
Safes and Vaults by Segment - Safes and Vaults - Independent
Analysis of Annual Sales in US$ Million for the Years 2022
through 2030 and % CAGR
Table 21: China Historic Review for Safes and Vaults by Segment -
Safes and Vaults Markets - Independent Analysis of Annual
Sales in US$ Million for Years 2014 through 2021 and % CAGR
Table 22: China 16-Year Perspective for Safes and Vaults by
Segment - Percentage Breakdown of Value Sales for Safes and
Vaults for the Years 2014, 2023 & 2030
EUROPE
Safes and Vaults Market Presence - Strong/Active/Niche/Trivial -
Key Competitors in Europe for 2023 (E)
Table 23: Europe Recent Past, Current & Future Analysis for
Safes and Vaults by Geographic Region - France, Germany, Italy,
UK, Spain, Russia and Rest of Europe Markets - Independent
Analysis of Annual Sales in US$ Million for Years 2022 through
2030 and % CAGR
Table 24: Europe Historic Review for Safes and Vaults by
Geographic Region - France, Germany, Italy, UK, Spain, Russia
and Rest of Europe Markets - Independent Analysis of Annual
Sales in US$ Million for Years 2014 through 2021 and % CAGR
Table 25: Europe 16-Year Perspective for Safes and Vaults by
Geographic Region - Percentage Breakdown of Value Sales for
France, Germany, Italy, UK, Spain, Russia and Rest of Europe
Markets for Years 2014, 2023 & 2030
Table 26: Europe Recent Past, Current & Future Analysis for
Safes and Vaults by Segment - Safes and Vaults - Independent
Analysis of Annual Sales in US$ Million for the Years 2022
through 2030 and % CAGR
Table 27: Europe Historic Review for Safes and Vaults by
Segment - Safes and Vaults Markets - Independent Analysis of
Annual Sales in US$ Million for Years 2014 through 2021 and %
CAGR
Table 28: Europe 16-Year Perspective for Safes and Vaults by
Segment - Percentage Breakdown of Value Sales for Safes and
Vaults for the Years 2014, 2023 & 2030
FRANCE
Safes and Vaults Market Presence - Strong/Active/Niche/Trivial -
Key Competitors in France for 2023 (E)
Table 29: France Recent Past, Current & Future Analysis for
Safes and Vaults by Segment - Safes and Vaults - Independent
Analysis of Annual Sales in US$ Million for the Years 2022
through 2030 and % CAGR
Table 30: France Historic Review for Safes and Vaults by
Segment - Safes and Vaults Markets - Independent Analysis of
Annual Sales in US$ Million for Years 2014 through 2021 and %
CAGR
Table 31: France 16-Year Perspective for Safes and Vaults by
Segment - Percentage Breakdown of Value Sales for Safes and
Vaults for the Years 2014, 2023 & 2030
GERMANY
Safes and Vaults Market Presence - Strong/Active/Niche/Trivial -
Key Competitors in Germany for 2023 (E)
Table 32: Germany Recent Past, Current & Future Analysis for
Safes and Vaults by Segment - Safes and Vaults - Independent
Analysis of Annual Sales in US$ Million for the Years 2022
through 2030 and % CAGR
Table 33: Germany Historic Review for Safes and Vaults by
Segment - Safes and Vaults Markets - Independent Analysis of
Annual Sales in US$ Million for Years 2014 through 2021 and %
CAGR
Table 34: Germany 16-Year Perspective for Safes and Vaults by
Segment - Percentage Breakdown of Value Sales for Safes and
Vaults for the Years 2014, 2023 & 2030
ITALY
Table 35: Italy Recent Past, Current & Future Analysis for
Safes and Vaults by Segment - Safes and Vaults - Independent
Analysis of Annual Sales in US$ Million for the Years 2022
through 2030 and % CAGR
Table 36: Italy Historic Review for Safes and Vaults by Segment -
Safes and Vaults Markets - Independent Analysis of Annual
Sales in US$ Million for Years 2014 through 2021 and % CAGR
Table 37: Italy 16-Year Perspective for Safes and Vaults by
Segment - Percentage Breakdown of Value Sales for Safes and
Vaults for the Years 2014, 2023 & 2030
UNITED KINGDOM
Safes and Vaults Market Presence - Strong/Active/Niche/Trivial -
Key Competitors in the United Kingdom for 2023 (E)
Table 38: UK Recent Past, Current & Future Analysis for Safes
and Vaults by Segment - Safes and Vaults - Independent Analysis
of Annual Sales in US$ Million for the Years 2022 through 2030
and % CAGR
Table 39: UK Historic Review for Safes and Vaults by Segment -
Safes and Vaults Markets - Independent Analysis of Annual Sales
in US$ Million for Years 2014 through 2021 and % CAGR
Table 40: UK 16-Year Perspective for Safes and Vaults by
Segment - Percentage Breakdown of Value Sales for Safes and
Vaults for the Years 2014, 2023 & 2030
SPAIN
Table 41: Spain Recent Past, Current & Future Analysis for
Safes and Vaults by Segment - Safes and Vaults - Independent
Analysis of Annual Sales in US$ Million for the Years 2022
through 2030 and % CAGR
Table 42: Spain Historic Review for Safes and Vaults by Segment -
Safes and Vaults Markets - Independent Analysis of Annual
Sales in US$ Million for Years 2014 through 2021 and % CAGR
Table 43: Spain 16-Year Perspective for Safes and Vaults by
Segment - Percentage Breakdown of Value Sales for Safes and
Vaults for the Years 2014, 2023 & 2030
RUSSIA
Table 44: Russia Recent Past, Current & Future Analysis for
Safes and Vaults by Segment - Safes and Vaults - Independent
Analysis of Annual Sales in US$ Million for the Years 2022
through 2030 and % CAGR
Table 45: Russia Historic Review for Safes and Vaults by
Segment - Safes and Vaults Markets - Independent Analysis of
Annual Sales in US$ Million for Years 2014 through 2021 and %
CAGR
Table 46: Russia 16-Year Perspective for Safes and Vaults by
Segment - Percentage Breakdown of Value Sales for Safes and
Vaults for the Years 2014, 2023 & 2030
REST OF EUROPE
Table 47: Rest of Europe Recent Past, Current & Future Analysis
for Safes and Vaults by Segment - Safes and Vaults -
Independent Analysis of Annual Sales in US$ Million for the
Years 2022 through 2030 and % CAGR
Table 48: Rest of Europe Historic Review for Safes and Vaults
by Segment - Safes and Vaults Markets - Independent Analysis of
Annual Sales in US$ Million for Years 2014 through 2021 and %
CAGR
Table 49: Rest of Europe 16-Year Perspective for Safes and
Vaults by Segment - Percentage Breakdown of Value Sales for
Safes and Vaults for the Years 2014, 2023 & 2030
ASIA-PACIFIC
Safes and Vaults Market Presence - Strong/Active/Niche/Trivial -
Key Competitors in Asia-Pacific for 2023 (E)
Table 50: Asia-Pacific Recent Past, Current & Future Analysis
for Safes and Vaults by Geographic Region - Australia, India,
South Korea and Rest of Asia-Pacific Markets - Independent
Analysis of Annual Sales in US$ Million for Years 2022 through
2030 and % CAGR
Table 51: Asia-Pacific Historic Review for Safes and Vaults by
Geographic Region - Australia, India, South Korea and Rest of
Asia-Pacific Markets - Independent Analysis of Annual Sales in
US$ Million for Years 2014 through 2021 and % CAGR
Table 52: Asia-Pacific 16-Year Perspective for Safes and Vaults
by Geographic Region - Percentage Breakdown of Value Sales for
Australia, India, South Korea and Rest of Asia-Pacific Markets
for Years 2014, 2023 & 2030
Table 53: Asia-Pacific Recent Past, Current & Future Analysis
for Safes and Vaults by Segment - Safes and Vaults -
Independent Analysis of Annual Sales in US$ Million for the
Years 2022 through 2030 and % CAGR
Table 54: Asia-Pacific Historic Review for Safes and Vaults by
Segment - Safes and Vaults Markets - Independent Analysis of
Annual Sales in US$ Million for Years 2014 through 2021 and %
CAGR
Table 55: Asia-Pacific 16-Year Perspective for Safes and Vaults
by Segment - Percentage Breakdown of Value Sales for Safes and
Vaults for the Years 2014, 2023 & 2030
AUSTRALIA
Safes and Vaults Market Presence - Strong/Active/Niche/Trivial -
Key Competitors in Australia for 2023 (E)
Table 56: Australia Recent Past, Current & Future Analysis for
Safes and Vaults by Segment - Safes and Vaults - Independent
Analysis of Annual Sales in US$ Million for the Years 2022
through 2030 and % CAGR
Table 57: Australia Historic Review for Safes and Vaults by
Segment - Safes and Vaults Markets - Independent Analysis of
Annual Sales in US$ Million for Years 2014 through 2021 and %
CAGR
Table 58: Australia 16-Year Perspective for Safes and Vaults by
Segment - Percentage Breakdown of Value Sales for Safes and
Vaults for the Years 2014, 2023 & 2030
INDIA
Safes and Vaults Market Presence - Strong/Active/Niche/Trivial -
Key Competitors in India for 2023 (E)
Table 59: India Recent Past, Current & Future Analysis for
Safes and Vaults by Segment - Safes and Vaults - Independent
Analysis of Annual Sales in US$ Million for the Years 2022
through 2030 and % CAGR
Table 60: India Historic Review for Safes and Vaults by Segment -
Safes and Vaults Markets - Independent Analysis of Annual
Sales in US$ Million for Years 2014 through 2021 and % CAGR
Table 61: India 16-Year Perspective for Safes and Vaults by
Segment - Percentage Breakdown of Value Sales for Safes and
Vaults for the Years 2014, 2023 & 2030
SOUTH KOREA
Table 62: South Korea Recent Past, Current & Future Analysis
for Safes and Vaults by Segment - Safes and Vaults -
Independent Analysis of Annual Sales in US$ Million for the
Years 2022 through 2030 and % CAGR
Table 63: South Korea Historic Review for Safes and Vaults by
Segment - Safes and Vaults Markets - Independent Analysis of
Annual Sales in US$ Million for Years 2014 through 2021 and %
CAGR
Table 64: South Korea 16-Year Perspective for Safes and Vaults
by Segment - Percentage Breakdown of Value Sales for Safes and
Vaults for the Years 2014, 2023 & 2030
REST OF ASIA-PACIFIC
Table 65: Rest of Asia-Pacific Recent Past, Current & Future
Analysis for Safes and Vaults by Segment - Safes and Vaults -
Independent Analysis of Annual Sales in US$ Million for the
Years 2022 through 2030 and % CAGR
Table 66: Rest of Asia-Pacific Historic Review for Safes and
Vaults by Segment - Safes and Vaults Markets - Independent
Analysis of Annual Sales in US$ Million for Years 2014 through
2021 and % CAGR
Table 67: Rest of Asia-Pacific 16-Year Perspective for Safes
and Vaults by Segment - Percentage Breakdown of Value Sales for
Safes and Vaults for the Years 2014, 2023 & 2030
LATIN AMERICA
Safes and Vaults Market Presence - Strong/Active/Niche/Trivial -
Key Competitors in Latin America for 2023 (E)
Table 68: Latin America Recent Past, Current & Future Analysis
for Safes and Vaults by Geographic Region - Argentina, Brazil,
Mexico and Rest of Latin America Markets - Independent Analysis
of Annual Sales in US$ Million for Years 2022 through 2030 and
% CAGR
Table 69: Latin America Historic Review for Safes and Vaults by
Geographic Region - Argentina, Brazil, Mexico and Rest of Latin
America Markets - Independent Analysis of Annual Sales in US$
Million for Years 2014 through 2021 and % CAGR
Table 70: Latin America 16-Year Perspective for Safes and
Vaults by Geographic Region - Percentage Breakdown of Value
Sales for Argentina, Brazil, Mexico and Rest of Latin America
Markets for Years 2014, 2023 & 2030
Table 71: Latin America Recent Past, Current & Future Analysis
for Safes and Vaults by Segment - Safes and Vaults -
Independent Analysis of Annual Sales in US$ Million for the
Years 2022 through 2030 and % CAGR
Table 72: Latin America Historic Review for Safes and Vaults by
Segment - Safes and Vaults Markets - Independent Analysis of
Annual Sales in US$ Million for Years 2014 through 2021 and %
CAGR
Table 73: Latin America 16-Year Perspective for Safes and
Vaults by Segment - Percentage Breakdown of Value Sales for
Safes and Vaults for the Years 2014, 2023 & 2030
ARGENTINA
Table 74: Argentina Recent Past, Current & Future Analysis for
Safes and Vaults by Segment - Safes and Vaults - Independent
Analysis of Annual Sales in US$ Million for the Years 2022
through 2030 and % CAGR
Table 75: Argentina Historic Review for Safes and Vaults by
Segment - Safes and Vaults Markets - Independent Analysis of
Annual Sales in US$ Million for Years 2014 through 2021 and %
CAGR
Table 76: Argentina 16-Year Perspective for Safes and Vaults by
Segment - Percentage Breakdown of Value Sales for Safes and
Vaults for the Years 2014, 2023 & 2030
BRAZIL
Table 77: Brazil Recent Past, Current & Future Analysis for
Safes and Vaults by Segment - Safes and Vaults - Independent
Analysis of Annual Sales in US$ Million for the Years 2022
through 2030 and % CAGR
Table 78: Brazil Historic Review for Safes and Vaults by
Segment - Safes and Vaults Markets - Independent Analysis of
Annual Sales in US$ Million for Years 2014 through 2021 and %
CAGR
Table 79: Brazil 16-Year Perspective for Safes and Vaults by
Segment - Percentage Breakdown of Value Sales for Safes and
Vaults for the Years 2014, 2023 & 2030
MEXICO
Table 80: Mexico Recent Past, Current & Future Analysis for
Safes and Vaults by Segment - Safes and Vaults - Independent
Analysis of Annual Sales in US$ Million for the Years 2022
through 2030 and % CAGR
Table 81: Mexico Historic Review for Safes and Vaults by
Segment - Safes and Vaults Markets - Independent Analysis of
Annual Sales in US$ Million for Years 2014 through 2021 and %
CAGR
Table 82: Mexico 16-Year Perspective for Safes and Vaults by
Segment - Percentage Breakdown of Value Sales for Safes and
Vaults for the Years 2014, 2023 & 2030
REST OF LATIN AMERICA
Table 83: Rest of Latin America Recent Past, Current & Future
Analysis for Safes and Vaults by Segment - Safes and Vaults -
Independent Analysis of Annual Sales in US$ Million for the
Years 2022 through 2030 and % CAGR
Table 84: Rest of Latin America Historic Review for Safes and
Vaults by Segment - Safes and Vaults Markets - Independent
Analysis of Annual Sales in US$ Million for Years 2014 through
2021 and % CAGR
Table 85: Rest of Latin America 16-Year Perspective for Safes
and Vaults by Segment - Percentage Breakdown of Value Sales for
Safes and Vaults for the Years 2014, 2023 & 2030
MIDDLE EAST
Safes and Vaults Market Presence - Strong/Active/Niche/Trivial -
Key Competitors in Middle East for 2023 (E)
Table 86: Middle East Recent Past, Current & Future Analysis
for Safes and Vaults by Geographic Region - Iran, Israel, Saudi
Arabia, UAE and Rest of Middle East Markets - Independent
Analysis of Annual Sales in US$ Million for Years 2022 through
2030 and % CAGR
Table 87: Middle East Historic Review for Safes and Vaults by
Geographic Region - Iran, Israel, Saudi Arabia, UAE and Rest of
Middle East Markets - Independent Analysis of Annual Sales in
US$ Million for Years 2014 through 2021 and % CAGR
Table 88: Middle East 16-Year Perspective for Safes and Vaults
by Geographic Region - Percentage Breakdown of Value Sales for
Iran, Israel, Saudi Arabia, UAE and Rest of Middle East Markets
for Years 2014, 2023 & 2030
Table 89: Middle East Recent Past, Current & Future Analysis
for Safes and Vaults by Segment - Safes and Vaults -
Independent Analysis of Annual Sales in US$ Million for the
Years 2022 through 2030 and % CAGR
Table 90: Middle East Historic Review for Safes and Vaults by
Segment - Safes and Vaults Markets - Independent Analysis of
Annual Sales in US$ Million for Years 2014 through 2021 and %
CAGR
Table 91: Middle East 16-Year Perspective for Safes and Vaults
by Segment - Percentage Breakdown of Value Sales for Safes and
Vaults for the Years 2014, 2023 & 2030
IRAN
Table 92: Iran Recent Past, Current & Future Analysis for Safes
and Vaults by Segment - Safes and Vaults - Independent Analysis
of Annual Sales in US$ Million for the Years 2022 through 2030
and % CAGR
Table 93: Iran Historic Review for Safes and Vaults by Segment -
Safes and Vaults Markets - Independent Analysis of Annual
Sales in US$ Million for Years 2014 through 2021 and % CAGR
Table 94: Iran 16-Year Perspective for Safes and Vaults by
Segment - Percentage Breakdown of Value Sales for Safes and
Vaults for the Years 2014, 2023 & 2030
ISRAEL
Table 95: Israel Recent Past, Current & Future Analysis for
Safes and Vaults by Segment - Safes and Vaults - Independent
Analysis of Annual Sales in US$ Million for the Years 2022
through 2030 and % CAGR
Table 96: Israel Historic Review for Safes and Vaults by
Segment - Safes and Vaults Markets - Independent Analysis of
Annual Sales in US$ Million for Years 2014 through 2021 and %
CAGR
Table 97: Israel 16-Year Perspective for Safes and Vaults by
Segment - Percentage Breakdown of Value Sales for Safes and
Vaults for the Years 2014, 2023 & 2030
SAUDI ARABIA
Table 98: Saudi Arabia Recent Past, Current & Future Analysis
for Safes and Vaults by Segment - Safes and Vaults -
Independent Analysis of Annual Sales in US$ Million for the
Years 2022 through 2030 and % CAGR
Table 99: Saudi Arabia Historic Review for Safes and Vaults by
Segment - Safes and Vaults Markets - Independent Analysis of
Annual Sales in US$ Million for Years 2014 through 2021 and %
CAGR
Table 100: Saudi Arabia 16-Year Perspective for Safes and
Vaults by Segment - Percentage Breakdown of Value Sales for
Safes and Vaults for the Years 2014, 2023 & 2030
UNITED ARAB EMIRATES
Table 101: UAE Recent Past, Current & Future Analysis for Safes
and Vaults by Segment - Safes and Vaults - Independent Analysis
of Annual Sales in US$ Million for the Years 2022 through 2030
and % CAGR
Table 102: UAE Historic Review for Safes and Vaults by Segment -
Safes and Vaults Markets - Independent Analysis of Annual
Sales in US$ Million for Years 2014 through 2021 and % CAGR
Table 103: UAE 16-Year Perspective for Safes and Vaults by
Segment - Percentage Breakdown of Value Sales for Safes and
Vaults for the Years 2014, 2023 & 2030
REST OF MIDDLE EAST
Table 104: Rest of Middle East Recent Past, Current & Future
Analysis for Safes and Vaults by Segment - Safes and Vaults -
Independent Analysis of Annual Sales in US$ Million for the
Years 2022 through 2030 and % CAGR
Table 105: Rest of Middle East Historic Review for Safes and
Vaults by Segment - Safes and Vaults Markets - Independent
Analysis of Annual Sales in US$ Million for Years 2014 through
2021 and % CAGR
Table 106: Rest of Middle East 16-Year Perspective for Safes
and Vaults by Segment - Percentage Breakdown of Value Sales for
Safes and Vaults for the Years 2014, 2023 & 2030
AFRICA
Safes and Vaults Market Presence - Strong/Active/Niche/Trivial -
Key Competitors in Africa for 2023 (E)
Table 107: Africa Recent Past, Current & Future Analysis for
Safes and Vaults by Segment - Safes and Vaults - Independent
Analysis of Annual Sales in US$ Million for the Years 2022
through 2030 and % CAGR
Table 108: Africa Historic Review for Safes and Vaults by
Segment - Safes and Vaults Markets - Independent Analysis of
Annual Sales in US$ Million for Years 2014 through 2021 and %
CAGR
Table 109: Africa 16-Year Perspective for Safes and Vaults by
Segment - Percentage Breakdown of Value Sales for Safes and
Vaults for the Years 2014, 2023 & 2030
IV. COMPETITION
Read the full report: https://www.reportlinker.com/p090635/?utm_source=PRN
About Reportlinker
ReportLinker is an award-winning market research solution. Reportlinker finds and organizes the latest industry data so you get all the market research you need - instantly, in one place.
Contact Clare: clare@reportlinker.com
US: (339)-368-6001
Intl: +1 339-368-6001
View original content to download multimedia:https://www.prnewswire.com/news-releases/global-safes-and-vaults-market-to-reach-13-8-billion-by-2030--301768792.html
SOURCE Reportlinker
Uncategorized
Fast-food chain closes restaurants after Chapter 11 bankruptcy
Several major fast-food chains recently have struggled to keep restaurants open.
Share this:


Competition in the fast-food space has been brutal as operators deal with inflation, consumers who are worried about the economy and their jobs and, in recent months, the falling cost of eating at home.
Add in that many fast-food chains took on more debt during the covid pandemic and that labor costs are rising, and you have a perfect storm of problems.
It's a situation where Restaurant Brands International (QSR) has suffered as much as any company.
Related: Wendy's menu drops a fan favorite item, adds something new
Three major Burger King franchise operators filed for bankruptcy in 2023, and the chain saw hundreds of stores close. It also saw multiple Popeyes franchisees move into bankruptcy, with dozens of locations closing.
RBI also stepped in and purchased one of its key franchisees.
"Carrols is the largest Burger King franchisee in the United States today, operating 1,022 Burger King restaurants in 23 states that generated approximately $1.8 billion of system sales during the 12 months ended Sept. 30, 2023," RBI said in a news release. Carrols also owns and operates 60 Popeyes restaurants in six states."
The multichain company made the move after two of its large franchisees, Premier Kings and Meridian, saw multiple locations not purchased when they reached auction after Chapter 11 bankruptcy filings. In that case, RBI bought select locations but allowed others to close.

Image source: Chen Jianli/Xinhua via Getty
Another fast-food chain faces bankruptcy problems
Bojangles may not be as big a name as Burger King or Popeye's, but it's a popular chain with more than 800 restaurants in eight states.
"Bojangles is a Carolina-born restaurant chain specializing in craveable Southern chicken, biscuits and tea made fresh daily from real recipes, and with a friendly smile," the chain says on its website. "Founded in 1977 as a single location in Charlotte, our beloved brand continues to grow nationwide."
Like RBI, Bojangles uses a franchise model, which makes it dependent on the financial health of its operators. The company ultimately saw all its Maryland locations close due to the financial situation of one of its franchisees.
Unlike. RBI, Bojangles is not public — it was taken private by Durational Capital Management LP and Jordan Co. in 2018 — which means the company does not disclose its financial information to the public.
That makes it hard to know whether overall softness for the brand contributed to the chain seeing its five Maryland locations after a Chapter 11 bankruptcy filing.
Bojangles has a messy bankruptcy situation
Even though the locations still appear on the Bojangles website, they have been shuttered since late 2023. The locations were operated by Salim Kakakhail and Yavir Akbar Durranni. The partners operated under a variety of LLCs, including ABS Network, according to local news channel WUSA9.
The station reported that the owners face a state investigation over complaints of wage theft and fraudulent W2s. In November Durranni and ABS Network filed for bankruptcy in New Jersey, WUSA9 reported.
"Not only do former employees say these men owe them money, WUSA9 learned the former owners owe the state, too, and have over $69,000 in back property taxes."
Former employees also say that the restaurant would regularly purchase fried chicken from Popeyes and Safeway when it ran out in their stores, the station reported.
Bojangles sent the station a comment on the situation.
"The franchisee is no longer in the Bojangles system," the company said. "However, it is important to note in your coverage that franchisees are independent business owners who are licensed to operate a brand but have autonomy over many aspects of their business, including hiring employees and payroll responsibilities."
Kakakhail and Durranni did not respond to multiple requests for comment from WUSA9.
bankruptcy pandemicUncategorized
Industrial Production Increased 0.1% in February
From the Fed: Industrial Production and Capacity Utilization
Industrial production edged up 0.1 percent in February after declining 0.5 percent in January. In February, the output of manufacturing rose 0.8 percent and the index for mining climbed 2.2 p…
Share this:


Industrial production edged up 0.1 percent in February after declining 0.5 percent in January. In February, the output of manufacturing rose 0.8 percent and the index for mining climbed 2.2 percent. Both gains partly reflected recoveries from weather-related declines in January. The index for utilities fell 7.5 percent in February because of warmer-than-typical temperatures. At 102.3 percent of its 2017 average, total industrial production in February was 0.2 percent below its year-earlier level. Capacity utilization for the industrial sector remained at 78.3 percent in February, a rate that is 1.3 percentage points below its long-run (1972–2023) average.Click on graph for larger image.
emphasis added
This graph shows Capacity Utilization. This series is up from the record low set in April 2020, and above the level in February 2020 (pre-pandemic).
Capacity utilization at 78.3% is 1.3% below the average from 1972 to 2022. This was below consensus expectations.
Note: y-axis doesn't start at zero to better show the change.
 The second graph shows industrial production since 1967.
Industrial production increased to 102.3. This is above the pre-pandemic level.
Industrial production was above consensus expectations.
Uncategorized
Southwest and United Airlines have bad news for passengers
Both airlines are facing the same problem, one that could lead to higher airfares and fewer flight options.
Share this:

Airlines operate in a market that's dictated by supply and demand: If more people want to fly a specific route than there are available seats, then tickets on those flights cost more.
That makes scheduling and predicting demand a huge part of maximizing revenue for airlines. There are, however, numerous factors that go into how airlines decide which flights to put on the schedule.
Related: Major airline faces Chapter 11 bankruptcy concerns
Every airport has only a certain number of gates, flight slots and runway capacity, limiting carriers' flexibility. That's why during times of high demand — like flights to Las Vegas during Super Bowl week — do not usually translate to airlines sending more planes to and from that destination.
Airlines generally do try to add capacity every year. That's become challenging as Boeing has struggled to keep up with demand for new airplanes. If you can't add airplanes, you can't grow your business. That's caused problems for the entire industry.
Every airline retires planes each year. In general, those get replaced by newer, better models that offer more efficiency and, in most cases, better passenger amenities.
If an airline can't get the planes it had hoped to add to its fleet in a given year, it can face capacity problems. And it's a problem that both Southwest Airlines (LUV) and United Airlines have addressed in a way that's inevitable but bad for passengers.
Image source: Kevin Dietsch/Getty Images
Southwest slows down its pilot hiring
In 2023, Southwest made a huge push to hire pilots. The airline lost thousands of pilots to retirement during the covid pandemic and it needed to replace them in order to build back to its 2019 capacity.
The airline successfully did that but will not continue that trend in 2024.
"Southwest plans to hire approximately 350 pilots this year, and no new-hire classes are scheduled after this month," Travel Weekly reported. "Last year, Southwest hired 1,916 pilots, according to pilot recruitment advisory firm Future & Active Pilot Advisors. The airline hired 1,140 pilots in 2022."
The slowdown in hiring directly relates to the airline expecting to grow capacity only in the low-single-digits percent in 2024.
"Moving into 2024, there is continued uncertainty around the timing of expected Boeing deliveries and the certification of the Max 7 aircraft. Our fleet plans remain nimble and currently differs from our contractual order book with Boeing," Southwest Airlines Chief Financial Officer Tammy Romo said during the airline's fourth-quarter-earnings call.
"We are planning for 79 aircraft deliveries this year and expect to retire roughly 45 700 and 4 800, resulting in a net expected increase of 30 aircraft this year."
That's very modest growth, which should not be enough of an increase in capacity to lower prices in any significant way.
United Airlines pauses pilot hiring
Boeing's (BA) struggles have had wide impact across the industry. United Airlines has also said it was going to pause hiring new pilots through the end of May.
United (UAL) Fight Operations Vice President Marc Champion explained the situation in a memo to the airline's staff.
"As you know, United has hundreds of new planes on order, and while we remain on path to be the fastest-growing airline in the industry, we just won't grow as fast as we thought we would in 2024 due to continued delays at Boeing," he said.
"For example, we had contractual deliveries for 80 Max 10s this year alone, but those aircraft aren't even certified yet, and it's impossible to know when they will arrive."
That's another blow to consumers hoping that multiple major carriers would grow capacity, putting pressure on fares. Until Boeing can get back on track, it's unlikely that competition between the large airlines will lead to lower fares.
In fact, it's possible that consumer demand will grow more than airline capacity which could push prices higher.
Related: Veteran fund manager picks favorite stocks for 2024
bankruptcy pandemic stocks

Key shipping company files for Chapter 11 bankruptcy


Pharma industry reputation remains steady at a ‘new normal’ after Covid, Harris Poll finds


These Cities Have The Highest (And Lowest) Share Of Unaffordable Neighborhoods In 2024


Tight inventory and frustrated buyers challenge agents in Virginia


Part 1: Current State of the Housing Market; Overview for mid-March 2024


The Question You Should Ask Whenever You’re Wrong


Walmart and Target make key self-checkout changes to fight theft


Industrial Production Increased 0.1% in February
Key shipping company files Chapter 11 bankruptcy


The best real estate coaching programs for 2024
-

 Uncategorized3 weeks ago
All Of The Elements Are In Place For An Economic Crisis Of Staggering Proportions
-

 International1 week ago
EyePoint poaches medical chief from Apellis; Sandoz CFO, longtime BioNTech exec to retire
-

 Uncategorized4 weeks ago
California Counties Could Be Forced To Pay $300 Million To Cover COVID-Era Program
-

 Uncategorized3 weeks ago
Apparel Retailer Express Moving Toward Bankruptcy
-

 Uncategorized4 weeks ago
Industrial Production Decreased 0.1% in January
-

 International7 days ago
Walmart launches clever answer to Target’s new membership program
-

 Spread & Containment2 days ago
IFM’s Hat Trick and Reflections On Option-To-Buy M&A
-

 Uncategorized4 weeks ago
RFK Jr: The Wuhan Cover-Up & The Rise Of The Biowarfare-Industrial Complex