Uncategorized
Global Baby Toiletries Market to Reach $14.5 Billion by 2030
Global Baby Toiletries Market to Reach $14.5 Billion by 2030
PR Newswire
NEW YORK, Feb. 14, 2023
NEW YORK, Feb. 14, 2023 /PRNewswire/ — The global economy is at a critical crossroads with a number of interlocking challenges and crises running in p…
Share this:

Global Baby Toiletries Market to Reach $14.5 Billion by 2030
PR Newswire
NEW YORK, Feb. 14, 2023
NEW YORK, Feb. 14, 2023 /PRNewswire/ -- The global economy is at a critical crossroads with a number of interlocking challenges and crises running in parallel. The uncertainty around how Russia`s war on Ukraine will play out this year and the war`s role in creating global instability means that the trouble on the inflation front is not over yet. Food and fuel inflation will remain a persistent economic problem. Higher retail inflation will impact consumer confidence and spending. As governments combat inflation by raising interest rates, new job creation will slowdown and impact economic activity and growth. Lower capital expenditure is in the offing as companies go slow on investments, held back by inflation worries and weaker demand. With slower growth and high inflation, developed markets seem primed to enter into a recession. Fears of new COVID outbreaks and China's already uncertain post-pandemic path poses a real risk of the world experiencing more acute supply chain pain and manufacturing disruptions this year. Volatile financial markets, growing trade tensions, stricter regulatory environment and pressure to mainstream climate change into economic decisions will compound the complexity of challenges faced. Year 2023 is expected to be tough year for most markets, investors and consumers. Nevertheless, there is always opportunity for businesses and their leaders who can chart a path forward with resilience and adaptability.
Read the full report: https://www.reportlinker.com/p04089506/?utm_source=PRN
Global Baby Toiletries Market to Reach $14.5 Billion by 2030
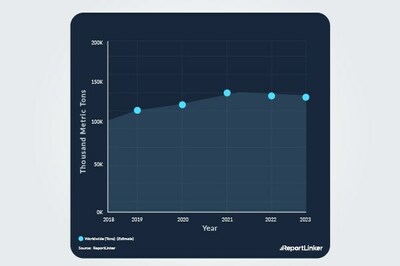
In the changed post COVID-19 business landscape, the global market for Baby Toiletries estimated at US$10.3 Billion in the year 2022, is projected to reach a revised size of US$14.5 Billion by 2030, growing at a CAGR of 4.4% over the analysis period 2022-2030. Skincare Products, one of the segments analyzed in the report, is projected to record a 5.4% CAGR and reach US$5.2 Billion by the end of the analysis period. Taking into account the ongoing post pandemic recovery, growth in the Bathing Products segment is readjusted to a revised 4.5% CAGR for the next 8-year period.
The U.S. Market is Estimated at $2.8 Billion, While China is Forecast to Grow at 7.6% CAGR
The Baby Toiletries market in the U.S. is estimated at US$2.8 Billion in the year 2022. China, the world`s second largest economy, is forecast to reach a projected market size of US$3.1 Billion by the year 2030 trailing a CAGR of 7.6% over the analysis period 2022 to 2030. Among the other noteworthy geographic markets are Japan and Canada, each forecast to grow at 2.3% and 3.6% respectively over the 2022-2030 period. Within Europe, Germany is forecast to grow at approximately 2.9% CAGR. Led by countries such as Australia, India, and South Korea, the market in Asia-Pacific is forecast to reach US$1.9 Billion by the year 2030.
Select Competitors (Total 23 Featured)
- Artsana S.p.A.
- Beiersdorf A.G.
- Beiersdorf S.p.A.
- Burt`s Bees
- California Baby
- Dabur India Ltd.
- First Quality Enterprises
- Johnson & Johnson
- Johnson & Johnson S.p.A.
- Kimberly-Clark Corp.
- Laboratoires Expanscience S.A.
- L`Oréal S.A.
- Me n Moms Pvt. Ltd.
- Naterra International, Inc.
- Nestlé Deutschland A.G.
- Noodle & Boo, LLC
- Ontex Group NV
- Procter & Gamble Company
- Sebapharma GmbH & Co. KG
- Sodalco s.r.l.
- The Himalaya Drug Company
- The Johnson & Johnson K.K. Corporation
- Unicharm Corporation
- Unilever
- Wakodo Co., Ltd.
- Weleda
Read the full report: https://www.reportlinker.com/p04089506/?utm_source=PRN
I. METHODOLOGY
II. EXECUTIVE SUMMARY
1. MARKET OVERVIEW
Influencer Market Insights
World Market Trajectories
Global Baby Toiletries Market Witnesses Robust Growth
Recent Market Activity
Asia-Pacific Leads the Global Baby Toiletries Market
Baby Skin Care Products Segment Dominates the Market
Baby Wipes Segment Presents Favorable Growth Prospects
Baby Soaps - Highly Lucrative Segment in Baby Toiletries Market
Baby Shampoo: One of the Major Segments in Baby Toiletries Market
Baby Powders Market: A Small Yet Fast Growing Segment
Baby Toiletries - Global Key Competitors Percentage Market
Share in 2022 (E)
Competitive Market Presence - Strong/Active/Niche/Trivial for
Players Worldwide in 2022 (E)
Impact of Covid-19 and a Looming Global Recession
2. FOCUS ON SELECT PLAYERS
Artsana S.p.A. (Italy)
Chicco (Italy)
Beiersdorf A.G. (Germany)
Beiersdorf S.p.A. (Italy)
Burt's Bees (USA)
California Baby (USA)
Dabur India Ltd. (India)
Earth Mama Organics (USA)
First Quality Enterprises (USA)
Johnson & Johnson (USA)
Aveeno (USA)
The Johnson & Johnson K.K. Corporation (Japan)
Johnson & Johnson S.p.A. (Italy)
Kimberly-Clark Corp. (USA)
Laboratoires Expanscience S.A. (France)
Laboratoires Sante Beaute (France)
L'Oréal S.A. (France)
Me n Moms Pvt. Ltd. (India)
Naterra International, Inc. (USA)
Nestlé Deutschland A.G. (Germany)
Noodle & Boo, LLC (USA)
Ontex N.V. (Belgium)
Pigeon Corp. (Japan)
Procter & Gamble Company (USA)
Sebapharma GmbH & Co. KG (Germany)
Sodalco s.r.l. (Italy)
The Himalaya Drug Company (India)
Unicharm Corporation (Japan)
Unilever (UK)
Wakodo Co., Ltd. (Japan)
Weleda (Switzerland)
3. MARKET TRENDS & DRIVERS
Increasing Global Population and Rise in Number of New Births:
Opportunity Galore for Baby Toiletries
Rising Women Workforce: A Business Case for Baby Toiletries
Rising Middle Class Population in Emerging Markets Offer
Increased Growth Prospects
Rising Disposable Incomes Propel Market Growth
Expanding Urban Population Spurs Growth
Drifting Demographics: A Threat to Baby Toiletries Market?
Demand for Natural and Organic Products to Boost Global Baby
Toiletries Market
Private Label Baby Toiletries Gain Popularity
Adoption of Various Marketing Strategies Drive Sales
Baby-Specific Skin Care Products Drive Baby Care Market
Rising Popularity of Online Retailing Lends Traction to Market
Growth
Emerging Trends Favoring Baby Wipes Market
Product Innovation & Focus on R&D
Innovative Marketing Strategies
Baby Toiletries Brands Gear Up to Avoid Using Harmful Chemicals
4. GLOBAL MARKET PERSPECTIVE
Table 1: World Recent Past, Current & Future Analysis for Baby
Toiletries by Geographic Region - USA, Canada, Japan, China,
Europe, Asia-Pacific, Latin America, Middle East and Africa
Markets - Independent Analysis of Annual Sales in US$ Million
for Years 2022 through 2030 and % CAGR
Table 2: World Historic Review for Baby Toiletries by
Geographic Region - USA, Canada, Japan, China, Europe,
Asia-Pacific, Latin America, Middle East and Africa Markets -
Independent Analysis of Annual Sales in US$ Million for Years
2012 through 2021 and % CAGR
Table 3: World 18-Year Perspective for Baby Toiletries by
Geographic Region - Percentage Breakdown of Value Sales for
USA, Canada, Japan, China, Europe, Asia-Pacific, Latin America,
Middle East and Africa Markets for Years 2012, 2023 & 2030
Table 4: World Recent Past, Current & Future Analysis for
Skincare Products by Geographic Region - USA, Canada, Japan,
China, Europe, Asia-Pacific, Latin America, Middle East and
Africa Markets - Independent Analysis of Annual Sales in US$
Million for Years 2022 through 2030 and % CAGR
Table 5: World Historic Review for Skincare Products by
Geographic Region - USA, Canada, Japan, China, Europe,
Asia-Pacific, Latin America, Middle East and Africa Markets -
Independent Analysis of Annual Sales in US$ Million for Years
2012 through 2021 and % CAGR
Table 6: World 18-Year Perspective for Skincare Products by
Geographic Region - Percentage Breakdown of Value Sales for
USA, Canada, Japan, China, Europe, Asia-Pacific, Latin America,
Middle East and Africa for Years 2012, 2023 & 2030
Table 7: World Recent Past, Current & Future Analysis for
Bathing Products by Geographic Region - USA, Canada, Japan,
China, Europe, Asia-Pacific, Latin America, Middle East and
Africa Markets - Independent Analysis of Annual Sales in US$
Million for Years 2022 through 2030 and % CAGR
Table 8: World Historic Review for Bathing Products by
Geographic Region - USA, Canada, Japan, China, Europe,
Asia-Pacific, Latin America, Middle East and Africa Markets -
Independent Analysis of Annual Sales in US$ Million for Years
2012 through 2021 and % CAGR
Table 9: World 18-Year Perspective for Bathing Products by
Geographic Region - Percentage Breakdown of Value Sales for
USA, Canada, Japan, China, Europe, Asia-Pacific, Latin America,
Middle East and Africa for Years 2012, 2023 & 2030
Table 10: World Recent Past, Current & Future Analysis for
Haircare Products by Geographic Region - USA, Canada, Japan,
China, Europe, Asia-Pacific, Latin America, Middle East and
Africa Markets - Independent Analysis of Annual Sales in US$
Million for Years 2022 through 2030 and % CAGR
Table 11: World Historic Review for Haircare Products by
Geographic Region - USA, Canada, Japan, China, Europe,
Asia-Pacific, Latin America, Middle East and Africa Markets -
Independent Analysis of Annual Sales in US$ Million for Years
2012 through 2021 and % CAGR
Table 12: World 18-Year Perspective for Haircare Products by
Geographic Region - Percentage Breakdown of Value Sales for
USA, Canada, Japan, China, Europe, Asia-Pacific, Latin America,
Middle East and Africa for Years 2012, 2023 & 2030
Table 13: World Recent Past, Current & Future Analysis for
Wipes by Geographic Region - USA, Canada, Japan, China, Europe,
Asia-Pacific, Latin America, Middle East and Africa Markets -
Independent Analysis of Annual Sales in US$ Million for Years
2022 through 2030 and % CAGR
Table 14: World Historic Review for Wipes by Geographic Region -
USA, Canada, Japan, China, Europe, Asia-Pacific, Latin
America, Middle East and Africa Markets - Independent Analysis
of Annual Sales in US$ Million for Years 2012 through 2021 and
% CAGR
Table 15: World 18-Year Perspective for Wipes by Geographic
Region - Percentage Breakdown of Value Sales for USA, Canada,
Japan, China, Europe, Asia-Pacific, Latin America, Middle East
and Africa for Years 2012, 2023 & 2030
Table 16: World Recent Past, Current & Future Analysis for
Other Product Types by Geographic Region - USA, Canada, Japan,
China, Europe, Asia-Pacific, Latin America, Middle East and
Africa Markets - Independent Analysis of Annual Sales in US$
Million for Years 2022 through 2030 and % CAGR
Table 17: World Historic Review for Other Product Types by
Geographic Region - USA, Canada, Japan, China, Europe,
Asia-Pacific, Latin America, Middle East and Africa Markets -
Independent Analysis of Annual Sales in US$ Million for Years
2012 through 2021 and % CAGR
Table 18: World 18-Year Perspective for Other Product Types by
Geographic Region - Percentage Breakdown of Value Sales for
USA, Canada, Japan, China, Europe, Asia-Pacific, Latin America,
Middle East and Africa for Years 2012, 2023 & 2030
Table 19: World Recent Past, Current & Future Analysis for
Hypermarkets & Supermarkets by Geographic Region - USA, Canada,
Japan, China, Europe, Asia-Pacific, Latin America, Middle East
and Africa Markets - Independent Analysis of Annual Sales in
US$ Million for Years 2022 through 2030 and % CAGR
Table 20: World Historic Review for Hypermarkets & Supermarkets
by Geographic Region - USA, Canada, Japan, China, Europe,
Asia-Pacific, Latin America, Middle East and Africa Markets -
Independent Analysis of Annual Sales in US$ Million for Years
2012 through 2021 and % CAGR
Table 21: World 18-Year Perspective for Hypermarkets &
Supermarkets by Geographic Region - Percentage Breakdown of
Value Sales for USA, Canada, Japan, China, Europe,
Asia-Pacific, Latin America, Middle East and Africa for Years
2012, 2023 & 2030
Table 22: World Recent Past, Current & Future Analysis for
eCommerce by Geographic Region - USA, Canada, Japan, China,
Europe, Asia-Pacific, Latin America, Middle East and Africa
Markets - Independent Analysis of Annual Sales in US$ Million
for Years 2022 through 2030 and % CAGR
Table 23: World Historic Review for eCommerce by Geographic
Region - USA, Canada, Japan, China, Europe, Asia-Pacific, Latin
America, Middle East and Africa Markets - Independent Analysis
of Annual Sales in US$ Million for Years 2012 through 2021 and
% CAGR
Table 24: World 18-Year Perspective for eCommerce by Geographic
Region - Percentage Breakdown of Value Sales for USA, Canada,
Japan, China, Europe, Asia-Pacific, Latin America, Middle East
and Africa for Years 2012, 2023 & 2030
Table 25: World Recent Past, Current & Future Analysis for
Specialty Store by Geographic Region - USA, Canada, Japan,
China, Europe, Asia-Pacific, Latin America, Middle East and
Africa Markets - Independent Analysis of Annual Sales in US$
Million for Years 2022 through 2030 and % CAGR
Table 26: World Historic Review for Specialty Store by
Geographic Region - USA, Canada, Japan, China, Europe,
Asia-Pacific, Latin America, Middle East and Africa Markets -
Independent Analysis of Annual Sales in US$ Million for Years
2012 through 2021 and % CAGR
Table 27: World 18-Year Perspective for Specialty Store by
Geographic Region - Percentage Breakdown of Value Sales for
USA, Canada, Japan, China, Europe, Asia-Pacific, Latin America,
Middle East and Africa for Years 2012, 2023 & 2030
Table 28: World Recent Past, Current & Future Analysis for
Other Distribution Channels by Geographic Region - USA, Canada,
Japan, China, Europe, Asia-Pacific, Latin America, Middle East
and Africa Markets - Independent Analysis of Annual Sales in
US$ Million for Years 2022 through 2030 and % CAGR
Table 29: World Historic Review for Other Distribution Channels
by Geographic Region - USA, Canada, Japan, China, Europe,
Asia-Pacific, Latin America, Middle East and Africa Markets -
Independent Analysis of Annual Sales in US$ Million for Years
2012 through 2021 and % CAGR
Table 30: World 18-Year Perspective for Other Distribution
Channels by Geographic Region - Percentage Breakdown of Value
Sales for USA, Canada, Japan, China, Europe, Asia-Pacific,
Latin America, Middle East and Africa for Years 2012, 2023 &
2030
Table 31: World Baby Toiletries Market Analysis of Annual Sales
in US$ Million for Years 2012 through 2030
III. MARKET ANALYSIS
UNITED STATES
Baby Toiletries Market Presence - Strong/Active/Niche/Trivial -
Key Competitors in the United States for 2023 (E)
Table 32: USA Recent Past, Current & Future Analysis for Baby
Toiletries by Product Type - Skincare Products, Bathing
Products, Haircare Products, Wipes and Other Product Types -
Independent Analysis of Annual Sales in US$ Million for the
Years 2022 through 2030 and % CAGR
Table 33: USA Historic Review for Baby Toiletries by Product
Type - Skincare Products, Bathing Products, Haircare Products,
Wipes and Other Product Types Markets - Independent Analysis of
Annual Sales in US$ Million for Years 2012 through 2021 and %
CAGR
Table 34: USA 18-Year Perspective for Baby Toiletries by
Product Type - Percentage Breakdown of Value Sales for Skincare
Products, Bathing Products, Haircare Products, Wipes and Other
Product Types for the Years 2012, 2023 & 2030
Table 35: USA Recent Past, Current & Future Analysis for Baby
Toiletries by Distribution Channel - Hypermarkets &
Supermarkets, eCommerce, Specialty Store and Other Distribution
Channels - Independent Analysis of Annual Sales in US$ Million
for the Years 2022 through 2030 and % CAGR
Table 36: USA Historic Review for Baby Toiletries by
Distribution Channel - Hypermarkets & Supermarkets, eCommerce,
Specialty Store and Other Distribution Channels Markets -
Independent Analysis of Annual Sales in US$ Million for Years
2012 through 2021 and % CAGR
Table 37: USA 18-Year Perspective for Baby Toiletries by
Distribution Channel - Percentage Breakdown of Value Sales for
Hypermarkets & Supermarkets, eCommerce, Specialty Store and
Other Distribution Channels for the Years 2012, 2023 & 2030
CANADA
Table 38: Canada Recent Past, Current & Future Analysis for
Baby Toiletries by Product Type - Skincare Products, Bathing
Products, Haircare Products, Wipes and Other Product Types -
Independent Analysis of Annual Sales in US$ Million for the
Years 2022 through 2030 and % CAGR
Table 39: Canada Historic Review for Baby Toiletries by Product
Type - Skincare Products, Bathing Products, Haircare Products,
Wipes and Other Product Types Markets - Independent Analysis of
Annual Sales in US$ Million for Years 2012 through 2021 and %
CAGR
Table 40: Canada 18-Year Perspective for Baby Toiletries by
Product Type - Percentage Breakdown of Value Sales for Skincare
Products, Bathing Products, Haircare Products, Wipes and Other
Product Types for the Years 2012, 2023 & 2030
Table 41: Canada Recent Past, Current & Future Analysis for
Baby Toiletries by Distribution Channel - Hypermarkets &
Supermarkets, eCommerce, Specialty Store and Other Distribution
Channels - Independent Analysis of Annual Sales in US$ Million
for the Years 2022 through 2030 and % CAGR
Table 42: Canada Historic Review for Baby Toiletries by
Distribution Channel - Hypermarkets & Supermarkets, eCommerce,
Specialty Store and Other Distribution Channels Markets -
Independent Analysis of Annual Sales in US$ Million for Years
2012 through 2021 and % CAGR
Table 43: Canada 18-Year Perspective for Baby Toiletries by
Distribution Channel - Percentage Breakdown of Value Sales for
Hypermarkets & Supermarkets, eCommerce, Specialty Store and
Other Distribution Channels for the Years 2012, 2023 & 2030
JAPAN
Baby Toiletries Market Presence - Strong/Active/Niche/Trivial -
Key Competitors in Japan for 2023 (E)
Table 44: Japan Recent Past, Current & Future Analysis for Baby
Toiletries by Product Type - Skincare Products, Bathing
Products, Haircare Products, Wipes and Other Product Types -
Independent Analysis of Annual Sales in US$ Million for the
Years 2022 through 2030 and % CAGR
Table 45: Japan Historic Review for Baby Toiletries by Product
Type - Skincare Products, Bathing Products, Haircare Products,
Wipes and Other Product Types Markets - Independent Analysis of
Annual Sales in US$ Million for Years 2012 through 2021 and %
CAGR
Table 46: Japan 18-Year Perspective for Baby Toiletries by
Product Type - Percentage Breakdown of Value Sales for Skincare
Products, Bathing Products, Haircare Products, Wipes and Other
Product Types for the Years 2012, 2023 & 2030
Table 47: Japan Recent Past, Current & Future Analysis for Baby
Toiletries by Distribution Channel - Hypermarkets &
Supermarkets, eCommerce, Specialty Store and Other Distribution
Channels - Independent Analysis of Annual Sales in US$ Million
for the Years 2022 through 2030 and % CAGR
Table 48: Japan Historic Review for Baby Toiletries by
Distribution Channel - Hypermarkets & Supermarkets, eCommerce,
Specialty Store and Other Distribution Channels Markets -
Independent Analysis of Annual Sales in US$ Million for Years
2012 through 2021 and % CAGR
Table 49: Japan 18-Year Perspective for Baby Toiletries by
Distribution Channel - Percentage Breakdown of Value Sales for
Hypermarkets & Supermarkets, eCommerce, Specialty Store and
Other Distribution Channels for the Years 2012, 2023 & 2030
CHINA
Baby Toiletries Market Presence - Strong/Active/Niche/Trivial -
Key Competitors in China for 2023 (E)
Table 50: China Recent Past, Current & Future Analysis for Baby
Toiletries by Product Type - Skincare Products, Bathing
Products, Haircare Products, Wipes and Other Product Types -
Independent Analysis of Annual Sales in US$ Million for the
Years 2022 through 2030 and % CAGR
Table 51: China Historic Review for Baby Toiletries by Product
Type - Skincare Products, Bathing Products, Haircare Products,
Wipes and Other Product Types Markets - Independent Analysis of
Annual Sales in US$ Million for Years 2012 through 2021 and %
CAGR
Table 52: China 18-Year Perspective for Baby Toiletries by
Product Type - Percentage Breakdown of Value Sales for Skincare
Products, Bathing Products, Haircare Products, Wipes and Other
Product Types for the Years 2012, 2023 & 2030
Table 53: China Recent Past, Current & Future Analysis for Baby
Toiletries by Distribution Channel - Hypermarkets &
Supermarkets, eCommerce, Specialty Store and Other Distribution
Channels - Independent Analysis of Annual Sales in US$ Million
for the Years 2022 through 2030 and % CAGR
Table 54: China Historic Review for Baby Toiletries by
Distribution Channel - Hypermarkets & Supermarkets, eCommerce,
Specialty Store and Other Distribution Channels Markets -
Independent Analysis of Annual Sales in US$ Million for Years
2012 through 2021 and % CAGR
Table 55: China 18-Year Perspective for Baby Toiletries by
Distribution Channel - Percentage Breakdown of Value Sales for
Hypermarkets & Supermarkets, eCommerce, Specialty Store and
Other Distribution Channels for the Years 2012, 2023 & 2030
EUROPE
Baby Toiletries Market Presence - Strong/Active/Niche/Trivial -
Key Competitors in Europe for 2023 (E)
Table 56: Europe Recent Past, Current & Future Analysis for
Baby Toiletries by Geographic Region - France, Germany, Italy,
UK, Spain, Russia and Rest of Europe Markets - Independent
Analysis of Annual Sales in US$ Million for Years 2022 through
2030 and % CAGR
Table 57: Europe Historic Review for Baby Toiletries by
Geographic Region - France, Germany, Italy, UK, Spain, Russia
and Rest of Europe Markets - Independent Analysis of Annual
Sales in US$ Million for Years 2012 through 2021 and % CAGR
Table 58: Europe 18-Year Perspective for Baby Toiletries by
Geographic Region - Percentage Breakdown of Value Sales for
France, Germany, Italy, UK, Spain, Russia and Rest of Europe
Markets for Years 2012, 2023 & 2030
Table 59: Europe Recent Past, Current & Future Analysis for
Baby Toiletries by Product Type - Skincare Products, Bathing
Products, Haircare Products, Wipes and Other Product Types -
Independent Analysis of Annual Sales in US$ Million for the
Years 2022 through 2030 and % CAGR
Table 60: Europe Historic Review for Baby Toiletries by Product
Type - Skincare Products, Bathing Products, Haircare Products,
Wipes and Other Product Types Markets - Independent Analysis of
Annual Sales in US$ Million for Years 2012 through 2021 and %
CAGR
Table 61: Europe 18-Year Perspective for Baby Toiletries by
Product Type - Percentage Breakdown of Value Sales for Skincare
Products, Bathing Products, Haircare Products, Wipes and Other
Product Types for the Years 2012, 2023 & 2030
Table 62: Europe Recent Past, Current & Future Analysis for
Baby Toiletries by Distribution Channel - Hypermarkets &
Supermarkets, eCommerce, Specialty Store and Other Distribution
Channels - Independent Analysis of Annual Sales in US$ Million
for the Years 2022 through 2030 and % CAGR
Table 63: Europe Historic Review for Baby Toiletries by
Distribution Channel - Hypermarkets & Supermarkets, eCommerce,
Specialty Store and Other Distribution Channels Markets -
Independent Analysis of Annual Sales in US$ Million for Years
2012 through 2021 and % CAGR
Table 64: Europe 18-Year Perspective for Baby Toiletries by
Distribution Channel - Percentage Breakdown of Value Sales for
Hypermarkets & Supermarkets, eCommerce, Specialty Store and
Other Distribution Channels for the Years 2012, 2023 & 2030
FRANCE
Baby Toiletries Market Presence - Strong/Active/Niche/Trivial -
Key Competitors in France for 2023 (E)
Table 65: France Recent Past, Current & Future Analysis for
Baby Toiletries by Product Type - Skincare Products, Bathing
Products, Haircare Products, Wipes and Other Product Types -
Independent Analysis of Annual Sales in US$ Million for the
Years 2022 through 2030 and % CAGR
Table 66: France Historic Review for Baby Toiletries by Product
Type - Skincare Products, Bathing Products, Haircare Products,
Wipes and Other Product Types Markets - Independent Analysis of
Annual Sales in US$ Million for Years 2012 through 2021 and %
CAGR
Table 67: France 18-Year Perspective for Baby Toiletries by
Product Type - Percentage Breakdown of Value Sales for Skincare
Products, Bathing Products, Haircare Products, Wipes and Other
Product Types for the Years 2012, 2023 & 2030
Table 68: France Recent Past, Current & Future Analysis for
Baby Toiletries by Distribution Channel - Hypermarkets &
Supermarkets, eCommerce, Specialty Store and Other Distribution
Channels - Independent Analysis of Annual Sales in US$ Million
for the Years 2022 through 2030 and % CAGR
Table 69: France Historic Review for Baby Toiletries by
Distribution Channel - Hypermarkets & Supermarkets, eCommerce,
Specialty Store and Other Distribution Channels Markets -
Independent Analysis of Annual Sales in US$ Million for Years
2012 through 2021 and % CAGR
Table 70: France 18-Year Perspective for Baby Toiletries by
Distribution Channel - Percentage Breakdown of Value Sales for
Hypermarkets & Supermarkets, eCommerce, Specialty Store and
Other Distribution Channels for the Years 2012, 2023 & 2030
GERMANY
Baby Toiletries Market Presence - Strong/Active/Niche/Trivial -
Key Competitors in Germany for 2023 (E)
Table 71: Germany Recent Past, Current & Future Analysis for
Baby Toiletries by Product Type - Skincare Products, Bathing
Products, Haircare Products, Wipes and Other Product Types -
Independent Analysis of Annual Sales in US$ Million for the
Years 2022 through 2030 and % CAGR
Table 72: Germany Historic Review for Baby Toiletries by
Product Type - Skincare Products, Bathing Products, Haircare
Products, Wipes and Other Product Types Markets - Independent
Analysis of Annual Sales in US$ Million for Years 2012 through
2021 and % CAGR
Table 73: Germany 18-Year Perspective for Baby Toiletries by
Product Type - Percentage Breakdown of Value Sales for Skincare
Products, Bathing Products, Haircare Products, Wipes and Other
Product Types for the Years 2012, 2023 & 2030
Table 74: Germany Recent Past, Current & Future Analysis for
Baby Toiletries by Distribution Channel - Hypermarkets &
Supermarkets, eCommerce, Specialty Store and Other Distribution
Channels - Independent Analysis of Annual Sales in US$ Million
for the Years 2022 through 2030 and % CAGR
Table 75: Germany Historic Review for Baby Toiletries by
Distribution Channel - Hypermarkets & Supermarkets, eCommerce,
Specialty Store and Other Distribution Channels Markets -
Independent Analysis of Annual Sales in US$ Million for Years
2012 through 2021 and % CAGR
Table 76: Germany 18-Year Perspective for Baby Toiletries by
Distribution Channel - Percentage Breakdown of Value Sales for
Hypermarkets & Supermarkets, eCommerce, Specialty Store and
Other Distribution Channels for the Years 2012, 2023 & 2030
ITALY
Table 77: Italy Recent Past, Current & Future Analysis for Baby
Toiletries by Product Type - Skincare Products, Bathing
Products, Haircare Products, Wipes and Other Product Types -
Independent Analysis of Annual Sales in US$ Million for the
Years 2022 through 2030 and % CAGR
Table 78: Italy Historic Review for Baby Toiletries by Product
Type - Skincare Products, Bathing Products, Haircare Products,
Wipes and Other Product Types Markets - Independent Analysis of
Annual Sales in US$ Million for Years 2012 through 2021 and %
CAGR
Table 79: Italy 18-Year Perspective for Baby Toiletries by
Product Type - Percentage Breakdown of Value Sales for Skincare
Products, Bathing Products, Haircare Products, Wipes and Other
Product Types for the Years 2012, 2023 & 2030
Table 80: Italy Recent Past, Current & Future Analysis for Baby
Toiletries by Distribution Channel - Hypermarkets &
Supermarkets, eCommerce, Specialty Store and Other Distribution
Channels - Independent Analysis of Annual Sales in US$ Million
for the Years 2022 through 2030 and % CAGR
Table 81: Italy Historic Review for Baby Toiletries by
Distribution Channel - Hypermarkets & Supermarkets, eCommerce,
Specialty Store and Other Distribution Channels Markets -
Independent Analysis of Annual Sales in US$ Million for Years
2012 through 2021 and % CAGR
Table 82: Italy 18-Year Perspective for Baby Toiletries by
Distribution Channel - Percentage Breakdown of Value Sales for
Hypermarkets & Supermarkets, eCommerce, Specialty Store and
Other Distribution Channels for the Years 2012, 2023 & 2030
UNITED KINGDOM
Baby Toiletries Market Presence - Strong/Active/Niche/Trivial -
Key Competitors in the United Kingdom for 2023 (E)
Table 83: UK Recent Past, Current & Future Analysis for Baby
Toiletries by Product Type - Skincare Products, Bathing
Products, Haircare Products, Wipes and Other Product Types -
Independent Analysis of Annual Sales in US$ Million for the
Years 2022 through 2030 and % CAGR
Table 84: UK Historic Review for Baby Toiletries by Product
Type - Skincare Products, Bathing Products, Haircare Products,
Wipes and Other Product Types Markets - Independent Analysis of
Annual Sales in US$ Million for Years 2012 through 2021 and %
CAGR
Table 85: UK 18-Year Perspective for Baby Toiletries by Product
Type - Percentage Breakdown of Value Sales for Skincare
Products, Bathing Products, Haircare Products, Wipes and Other
Product Types for the Years 2012, 2023 & 2030
Table 86: UK Recent Past, Current & Future Analysis for Baby
Toiletries by Distribution Channel - Hypermarkets &
Supermarkets, eCommerce, Specialty Store and Other Distribution
Channels - Independent Analysis of Annual Sales in US$ Million
for the Years 2022 through 2030 and % CAGR
Table 87: UK Historic Review for Baby Toiletries by
Distribution Channel - Hypermarkets & Supermarkets, eCommerce,
Specialty Store and Other Distribution Channels Markets -
Independent Analysis of Annual Sales in US$ Million for Years
2012 through 2021 and % CAGR
Table 88: UK 18-Year Perspective for Baby Toiletries by
Distribution Channel - Percentage Breakdown of Value Sales for
Hypermarkets & Supermarkets, eCommerce, Specialty Store and
Other Distribution Channels for the Years 2012, 2023 & 2030
SPAIN
Table 89: Spain Recent Past, Current & Future Analysis for Baby
Toiletries by Product Type - Skincare Products, Bathing
Products, Haircare Products, Wipes and Other Product Types -
Independent Analysis of Annual Sales in US$ Million for the
Years 2022 through 2030 and % CAGR
Table 90: Spain Historic Review for Baby Toiletries by Product
Type - Skincare Products, Bathing Products, Haircare Products,
Wipes and Other Product Types Markets - Independent Analysis of
Annual Sales in US$ Million for Years 2012 through 2021 and %
CAGR
Table 91: Spain 18-Year Perspective for Baby Toiletries by
Product Type - Percentage Breakdown of Value Sales for Skincare
Products, Bathing Products, Haircare Products, Wipes and Other
Product Types for the Years 2012, 2023 & 2030
Table 92: Spain Recent Past, Current & Future Analysis for Baby
Toiletries by Distribution Channel - Hypermarkets &
Supermarkets, eCommerce, Specialty Store and Other Distribution
Channels - Independent Analysis of Annual Sales in US$ Million
for the Years 2022 through 2030 and % CAGR
Table 93: Spain Historic Review for Baby Toiletries by
Distribution Channel - Hypermarkets & Supermarkets, eCommerce,
Specialty Store and Other Distribution Channels Markets -
Independent Analysis of Annual Sales in US$ Million for Years
2012 through 2021 and % CAGR
Table 94: Spain 18-Year Perspective for Baby Toiletries by
Distribution Channel - Percentage Breakdown of Value Sales for
Hypermarkets & Supermarkets, eCommerce, Specialty Store and
Other Distribution Channels for the Years 2012, 2023 & 2030
RUSSIA
Table 95: Russia Recent Past, Current & Future Analysis for
Baby Toiletries by Product Type - Skincare Products, Bathing
Products, Haircare Products, Wipes and Other Product Types -
Independent Analysis of Annual Sales in US$ Million for the
Years 2022 through 2030 and % CAGR
Table 96: Russia Historic Review for Baby Toiletries by Product
Type - Skincare Products, Bathing Products, Haircare Products,
Wipes and Other Product Types Markets - Independent Analysis of
Annual Sales in US$ Million for Years 2012 through 2021 and %
CAGR
Table 97: Russia 18-Year Perspective for Baby Toiletries by
Product Type - Percentage Breakdown of Value Sales for Skincare
Products, Bathing Products, Haircare Products, Wipes and Other
Product Types for the Years 2012, 2023 & 2030
Table 98: Russia Recent Past, Current & Future Analysis for
Baby Toiletries by Distribution Channel - Hypermarkets &
Supermarkets, eCommerce, Specialty Store and Other Distribution
Channels - Independent Analysis of Annual Sales in US$ Million
for the Years 2022 through 2030 and % CAGR
Table 99: Russia Historic Review for Baby Toiletries by
Distribution Channel - Hypermarkets & Supermarkets, eCommerce,
Specialty Store and Other Distribution Channels Markets -
Independent Analysis of Annual Sales in US$ Million for Years
2012 through 2021 and % CAGR
Table 100: Russia 18-Year Perspective for Baby Toiletries by
Distribution Channel - Percentage Breakdown of Value Sales for
Hypermarkets & Supermarkets, eCommerce, Specialty Store and
Other Distribution Channels for the Years 2012, 2023 & 2030
REST OF EUROPE
Table 101: Rest of Europe Recent Past, Current & Future
Analysis for Baby Toiletries by Product Type - Skincare
Products, Bathing Products, Haircare Products, Wipes and Other
Product Types - Independent Analysis of Annual Sales in US$
Million for the Years 2022 through 2030 and % CAGR
Table 102: Rest of Europe Historic Review for Baby Toiletries
by Product Type - Skincare Products, Bathing Products, Haircare
Products, Wipes and Other Product Types Markets - Independent
Analysis of Annual Sales in US$ Million for Years 2012 through
2021 and % CAGR
Table 103: Rest of Europe 18-Year Perspective for Baby
Toiletries by Product Type - Percentage Breakdown of Value
Sales for Skincare Products, Bathing Products, Haircare
Products, Wipes and Other Product Types for the Years 2012,
2023 & 2030
Table 104: Rest of Europe Recent Past, Current & Future
Analysis for Baby Toiletries by Distribution Channel -
Hypermarkets & Supermarkets, eCommerce, Specialty Store and
Other Distribution Channels - Independent Analysis of Annual
Sales in US$ Million for the Years 2022 through 2030 and % CAGR
Table 105: Rest of Europe Historic Review for Baby Toiletries
by Distribution Channel - Hypermarkets & Supermarkets,
eCommerce, Specialty Store and Other Distribution Channels
Markets - Independent Analysis of Annual Sales in US$ Million
for Years 2012 through 2021 and % CAGR
Table 106: Rest of Europe 18-Year Perspective for Baby
Toiletries by Distribution Channel - Percentage Breakdown of
Value Sales for Hypermarkets & Supermarkets, eCommerce,
Specialty Store and Other Distribution Channels for the Years
2012, 2023 & 2030
ASIA-PACIFIC
Baby Toiletries Market Presence - Strong/Active/Niche/Trivial -
Key Competitors in Asia-Pacific for 2023 (E)
Table 107: Asia-Pacific Recent Past, Current & Future Analysis
for Baby Toiletries by Geographic Region - Australia, India,
South Korea and Rest of Asia-Pacific Markets - Independent
Analysis of Annual Sales in US$ Million for Years 2022 through
2030 and % CAGR
Table 108: Asia-Pacific Historic Review for Baby Toiletries by
Geographic Region - Australia, India, South Korea and Rest of
Asia-Pacific Markets - Independent Analysis of Annual Sales in
US$ Million for Years 2012 through 2021 and % CAGR
Please contact our Customer Support Center to get the complete Table of Contents
Read the full report: https://www.reportlinker.com/p04089506/?utm_source=PRN
About Reportlinker
ReportLinker is an award-winning market research solution. Reportlinker finds and organizes the latest industry data so you get all the market research you need - instantly, in one place.
__________________________
Contact Clare: clare@reportlinker.com
US: (339)-368-6001
Intl: +1 339-368-6001
View original content to download multimedia:https://www.prnewswire.com/news-releases/global-baby-toiletries-market-to-reach-14-5-billion-by-2030--301745480.html
SOURCE Reportlinker
Uncategorized
Apartment permits are back to recession lows. Will mortgage rates follow?
If housing leads us into a recession in the near future, that means mortgage rates have stayed too high for too long.
Share this:

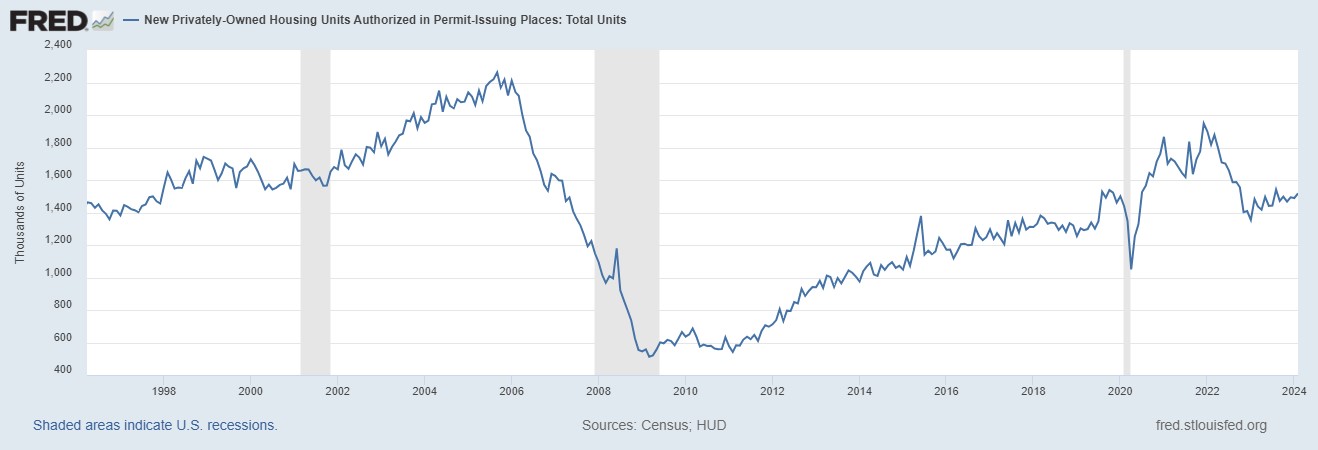
In Tuesday’s report, the 5-unit housing permits data hit the same levels we saw in the COVID-19 recession. Once the backlog of apartments is finished, those jobs will be at risk, which traditionally means mortgage rates would fall soon after, as they have in previous economic cycles.
However, this is happening while single-family permits are still rising as the rate of builder buy-downs and the backlog of single-family homes push single-family permits and starts higher. It is a tale of two markets — something I brought up on CNBC earlier this year to explain why this trend matters with housing starts data because the two marketplaces are heading in opposite directions.
The question is: Will the uptick in single-family permits keep mortgage rates higher than usual? As long as jobless claims stay low, the falling 5-unit apartment permit data might not lead to lower mortgage rates as it has in previous cycles.
From Census: Building Permits: Privately‐owned housing units authorized by building permits in February were at a seasonally adjusted annual rate of 1,518,000. This is 1.9 percent above the revised January rate of 1,489,000 and 2.4 percent above the February 2023 rate of 1,482,000.
When people say housing leads us in and out of a recession, it is a valid premise and that is why people carefully track housing permits. However, this housing cycle has been unique. Unfortunately, many people who have tracked this housing cycle are still stuck on 2008, believing that what happened during COVID-19 was rampant demand speculation that would lead to a massive supply of homes once home sales crashed. This would mean the builders couldn’t sell more new homes or have housing permits rise.
Housing permits, starts and new home sales were falling for a while, and in 2022, the data looked recessionary. However, new home sales were never near the 2005 peak, and the builders found a workable bottom in sales by paying down mortgage rates to boost demand. The first level of job loss recessionary data has been averted for now. Below is the chart of the building permits.
On the other hand, the apartment boom and bust has already happened. Permits are already back to the levels of the COVID-19 recession and have legs to move lower. Traditionally, when this data line gets this negative, a recession isn’t far off. But, as you can see in the chart below, there’s a big gap between the housing permit data for single-family and five units. Looking at this chart, the recession would only happen after single-family and 5-unit permits fall together, not when we have a gap like we see today.
From Census: Housing completions: Privately‐owned housing completions in February were at a seasonally adjusted annual rate of 1,729,000.
As we can see in the chart below, we had a solid month of housing completions. This was driven by 5-unit completions, which have been in the works for a while now. Also, this month’s report show a weather impact as progress in building was held up due to bad weather. However, the good news is that more supply of rental units will mean the fight against rent inflation will be positive as more supply is the best way to deal with inflation. In time, that is also good news for mortgage rates.
Housing Starts: Privately‐owned housing starts in February were at a seasonally adjusted annual rate of 1,521,000. This is 10.7 percent (±14.2 percent)* above the revised January estimate of 1,374,000 and is 5.9 percent (±10.0 percent)* above the February 2023 rate of 1,436,000.
Housing starts data beat to the upside, but the real story is that the marketplace has diverged into two different directions. The apartment boom is over and permits are heading below the COVID-19 recession, but as long as the builders can keep rates low enough to sell more new homes, single-family permits and starts can slowly move forward.
If we lose the single-family marketplace, expect the chart below to look like it always does before a recession — meaning residential construction workers lose their jobs. For now, the apartment construction workers are at the most risk once they finish the backlog of apartments under construction.

Overall, the housing starts beat to the upside. Still, the report’s internals show a marketplace with early recessionary data lines, which traditionally mean mortgage rates should go lower soon. If housing leads us into a recession in the near future, that means mortgage rates have stayed too high for too long and restrictive policy by the Fed created a recession as we have seen in previous economic cycles.
The builders have been paying down rates to keep construction workers employed, but if rates go higher, it will get more and more challenging to do this because not all builders have the capacity to buy down rates. Last year, we saw what 8% mortgage rates did to new home sales; they dropped before rates fell. So, this is something to keep track of, especially with a critical Federal Reserve meeting this week.
recession covid-19 fed federal reserve home sales mortgage rates recessionUncategorized
One more airline cracks down on lounge crowding in a way you won’t like
Qantas Airways is increasing the price of accessing its network of lounges by as much as 17%.
Share this:


Over the last two years, multiple airlines have dealt with crowding in their lounges. While they are designed as a luxury experience for a small subset of travelers, high numbers of people taking a trip post-pandemic as well as the different ways they are able to gain access through status or certain credit cards made it difficult for some airlines to keep up with keeping foods stocked, common areas clean and having enough staff to serve bar drinks at the rate that customers expect them.
In the fall of 2023, Delta Air Lines (DAL) caught serious traveler outcry after announcing that it was cracking down on crowding by raising how much one needs to spend for lounge access and limiting the number of times one can enter those lounges.
Related: Competitors pushed Delta to backtrack on its lounge and loyalty program changes
Some airlines saw the outcry with Delta as their chance to reassure customers that they would not raise their fees while others waited for the storm to pass to quietly implement their own increases.
Shutterstock
This is how much more you'll have to pay for Qantas lounge access
Australia's flagship carrier Qantas Airways (QUBSF) is the latest airline to announce that it would raise the cost accessing the 24 lounges across the country as well as the 600 international lounges available at airports across the world through partner airlines.
More Travel:
- A new travel term is taking over the internet (and reaching airlines and hotels)
- The 10 best airline stocks to buy now
- Airlines see a new kind of traveler at the front of the plane
Unlike other airlines which grant access primarily after reaching frequent flyer status, Qantas also sells it through a membership — starting from April 18, 2024, prices will rise from $600 Australian dollars ($392 USD) to $699 AUD ($456 USD) for one year, $1,100 ($718 USD) to $1,299 ($848 USD) for two years and $2,000 AUD ($1,304) to lock in the rate for four years.
Those signing up for lounge access for the first time also currently pay a joining fee of $99 AUD ($65 USD) that will rise to $129 AUD ($85 USD).
The airline also allows customers to purchase their membership with Qantas Points they collect through frequent travel; the membership fees are also being raised by the equivalent amount in points in what adds up to as much as 17% — from 308,000 to 399,900 to lock in access for four years.
Airline says hikes will 'cover cost increases passed on from suppliers'
"This is the first time the Qantas Club membership fees have increased in seven years and will help cover cost increases passed on from a range of suppliers over that time," a Qantas spokesperson confirmed to Simple Flying. "This follows a reduction in the membership fees for several years during the pandemic."
The spokesperson said the gains from the increases will go both towards making up for inflation-related costs and keeping existing lounges looking modern by updating features like furniture and décor.
While the price increases also do not apply for those who earned lounge access through frequent flyer status or change what it takes to earn that status, Qantas is also introducing even steeper increases for those renewing a membership or adding additional features such as spouse and partner memberships.
In some cases, the cost of these features will nearly double from what members are paying now.
stocks pandemicUncategorized
Star Wars icon gives his support to Disney, Bob Iger
Disney shareholders have a huge decision to make on April 3.
Share this:

Disney's (DIS) been facing some headwinds up top, but its leadership just got backing from one of the company's more prominent investors.
Star Wars creator George Lucas put out of statement in support of the company's current leadership team, led by CEO Bob Iger, ahead of the April 3 shareholders meeting which will see investors vote on the company's 12-member board.
"Creating magic is not for amateurs," Lucas said in a statement. "When I sold Lucasfilm just over a decade ago, I was delighted to become a Disney shareholder because of my long-time admiration for its iconic brand and Bob Iger’s leadership. When Bob recently returned to the company during a difficult time, I was relieved. No one knows Disney better. I remain a significant shareholder because I have full faith and confidence in the power of Disney and Bob’s track record of driving long-term value. I have voted all of my shares for Disney’s 12 directors and urge other shareholders to do the same."
Related: Disney stands against Nelson Peltz as leadership succession plan heats up
Lucasfilm was acquired by Disney for $4 billion in 2012 — notably under the first term of Iger. He received over 37 million in shares of Disney during the acquisition.
Lucas' statement seems to be an attempt to push investors away from the criticism coming from The Trian Partners investment group, led by Nelson Peltz. The group, owns about $3 million in shares of the media giant, is pushing two candidates for positions on the board, which are Peltz and former Disney CFO Jay Rasulo.
Peltz and Co. have called out a pair of Disney directors — Michael Froman and Maria Elena Lagomasino — for their lack of experience in the media space.
Related: Women's basketball is gaining ground, but is March Madness ready to rival the men's game?
Blackwells Capital is also pushing three of its candidates to take seats during the early April shareholder meeting, though Reuters has reported that the firm has been supportive of the company's current direction.
Disney has struggled in recent years amid the changes in media and the effects of the pandemic — which triggered the return of Iger at the helm in late 2022. After going through mass layoffs in the spring of 2023 and focusing on key growth brands, the company has seen a steady recovery with its stock up over 25% year-to-date and around 40% for the last six months.
Related: Veteran fund manager picks favorite stocks for 2024
stocks pandemic recovery

Apartment permits are back to recession lows. Will mortgage rates follow?


Manufacturing and construction vs. the still-inverted yield curve


When words make you sick


How much stress is too much? A psychiatrist explains the links between toxic stress and poor health − and how to get help


Caitlin Clark, Coach Prime, and Linsanity: The Anatomy of a Viewership ‘Craze’


PR55α-controlled PP2A Inhibits p16 Expression and Blocks Cellular Senescence Induction


US Economic Conditions Scream “Buy Gold”


Wall Street Bonuses Fall For Second Year To 2019 Lows Amid Capital Markets Freeze


Half Of Downtown Pittsburgh Office Space Could Be Empty In 4 Years


Airline, travel companies face Chapter 11 bankruptcy, default risk
-

 Spread & Containment7 days ago
IFM’s Hat Trick and Reflections On Option-To-Buy M&A
-

 Uncategorized4 weeks ago
All Of The Elements Are In Place For An Economic Crisis Of Staggering Proportions
-

 International2 weeks ago
EyePoint poaches medical chief from Apellis; Sandoz CFO, longtime BioNTech exec to retire
-

 Uncategorized1 month ago
California Counties Could Be Forced To Pay $300 Million To Cover COVID-Era Program
-

 Uncategorized4 weeks ago
Apparel Retailer Express Moving Toward Bankruptcy
-

 Uncategorized1 month ago
Industrial Production Decreased 0.1% in January
-

 International2 weeks ago
Walmart launches clever answer to Target’s new membership program
-

 Uncategorized1 month ago
RFK Jr: The Wuhan Cover-Up & The Rise Of The Biowarfare-Industrial Complex