Futures Reverse Earlier Stagflationary Losses As Dollar Dumps, Cryptos Soar
Futures Reverse Earlier Stagflationary Losses As Dollar Dumps, Cryptos Soar
In a mirror image of Thursday’s overnight action, US index futures reversed an early overnight drop, when sentiment was dented by growing concerns about the growing..
Share this:

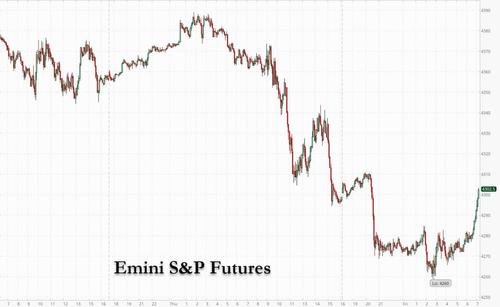
In a mirror image of Thursday's overnight action, US index futures reversed an early overnight drop, when sentiment was dented by growing concerns about the growing global energy crisis, which sent European gas prices to a record 100 euros, and a global stagflationary wave which overshadowed the positive sentiment from a short-term Congressional deal that averted a government shutdown. However as US traders arrived at their desks, what was earlier a drop of as much as 40 points reversed to a gain of 13 points with the Emini now trading up 14 points or 0.34% to 4,312, Dow eminis were up 47 at 745am, reversing an earlier loss, while Nasdaq 100 e-minis also turned higher and were last up 29.5 or 0.2%. As stocks bounced the dollar resumed its decline while oil’s rally stalled and Treasuries were steady.
Wall Street ended sharply lower on Thursday, closing below its 100-day moving average (DMA), and the S&P 500 posted its worst month since the onset of the global health crisis, following a tumultuous month and quarter wrecked by concerns over COVID-19, inflation fears and budget wrangling in Washington. President Joe Biden signed a measure to continue funding the government through Dec. 3, although congressional Democrats and Republicans continued brawling over raising the debt ceiling beyond $28.4 trillion to avert a U.S. credit default. As such, the short-term deal that averted a U.S. government shutdown was dwarfed by concern the crisis could return in weeks and also delay Biden’s $4 trillion economic vision.
On Friday, the first day of October, oil giants such as Exxon and Chevron slipped about 0.9% premarket, while the big banks dropped 1% each. Industrials Caterpillar, Deere and Nucor also came under pressure after Democratic leaders of the U.S. House of Representatives delayed a planned vote on a $1 trillion bipartisan infrastructure bill on Thursday. These are the stocks that would benefit the most from government spending on infrastructure.
The FAAMGs slipped 3.7% in Q3, breaking its five-quarter winning streak. Merck Inc jumped 4.7% after the drugmaker’s experimental oral drug for COVID-19, molnupiravir, reduced by around 50% the chance of hospitalization or death for patients at risk of severe disease in a study. Here are some of the other big movers.
- Lordstown Motors (RIDE US) gains 7% in premarket trading after confirming a pact with Foxconn Technology.
- Five9 (FIVN US) shares tick higher after co’s shareholders vote against Zoom’s takeover deal; analysts say it doesn’t come as a surprise and that both stocks have a strong appeal as standalone companies
- International Business Machines (IBM US) slightly higher after Jefferies initiates with buy and a $170 target, saying co. now has a clear path to outperform growth expectations after several years of transition
- IFF (IFF US) shares rose 2.5% in postmarket trading Thursday after the company announced Chairman and CEO Andreas Fibig’s retirement.
- Helbiz (HLBZ US) shares rose 5.6% premarket after the scooter-share startup announced that CEO Salvatore Palella bought $2 million of PIPE or private investment in public equity units, consisting of shares and warrant
“There’s certainly plenty to be concerned about,” said Michael Hewson, chief market analyst at CMC Markets in London. “The gains year-to-date are still pretty decent, which raises the question of how much more is left in the tank, and whether this October will live up to the reputation of Octobers past and deliver a huge curveball, as well as giving investors an anxiety attack.”
Meanwhile, the debate over whether rising inflation mixed with patchier growth was a recipe for stagflation continued. “You can argue whether it’s really stagflation or not, but the whole growth-inflation backdrop seems to have just tilted to a less favorable one,” said Rob Carnell, Asia-Pacific head of research at ING in Singapore.
All eyes are now on consumer spending, inflation and factory activity data later in the day for signs of economic health and clues regarding the Federal Reserve’s timeline for tapering its asset purchases and hiking key interest rates.
Meanwhile, with stellar economic growth figures now in the rear view mirror, markets were looking ugly going into October, Michael Hewson, chief markets analyst at CMC Markets, said. Data overnight showed that Asia’s manufacturing activity broadly stagnated in September as signs of slowing Chinese growth weighed on the region’s economies.
“There is a sense that with October’s reputation, worries about surging energy prices, supply chain disruptions, concerns about inflation and power shortages, October could be a fairly windy affair,” Hewson said.
In Europe, banks and energy companies led the Stoxx Europe 600 Index down, dragging it as much as 0.9% lower en route for the benchmark’s worst week since January, although a wave of buying has managed to cut the drop in half. Banks, oil & gas and mining stocks are the weakest performers. BMW shares dodged the trend, gaining 1.6% after the German carmaker raised its profit expectations for this year despite a worsening chip shortage.
Asian stocks fell on the first day of the new quarter amid concerns over a vote on a U.S. infrastructure bill and China’s order to top state-owned energy companies to secure supplies for this winter. The MSCI Asia Pacific Index slid as much as 1.3%, with tech stocks weighing most on the gauge. Taiwan Semiconductor Manufacturing, Samsung Electronics and Nintendo were among the biggest contributors to the drop. Markets in China and Hong Kong were closed for a holiday. Futures on the S&P 500 and Nasdaq 100 slumped during Asia trading hours after losses on Wall Street and as House Democrats delayed a vote on a bipartisan infrastructure deal. “I am surmising that Asia is responding to the terrible overnight session on Wall Street and the uncertainty surrounding the U.S. infrastructure vote,” said Jeffrey Halley, a senior market analyst at Oanda Corp. in Singapore. “Liquidity will be reduced with both Hong Kong and mainland China away.” Shares in Asia also fell following a report that China’s central government officials ordered energy companies -- from coal to electricity and oil -- to secure winter supplies at all costs. What China’s order means is that there “may be further input price pressures, which may weigh on firms’ margins ahead,” said Jun Rong Yeap, a market strategist at IG Asia Pte. Asian stocks capped the September quarter with a 5.2% slide, snapping a winning streak of five straight quarters. A mix of higher yields, China’s corporate crackdown and worry over its slowing economic growth have hurt sentiment. Investors are also bracing for the Federal Reserve to wind down its stimulus amid elevated inflation, supply-chain bottlenecks and a global energy crunch. “The ongoing Evergrande saga and increasing number of property firms that are facing liquidity issues is also weighing on sentiment,” said Justin Tang, head of Asian research at United First Partners. “All this comes amid the rise in bond yields, so plenty of things for investors to digest.” Chinese markets are closed for a week from Friday for the Golden Week holiday.
Japanese equities fell, capping their worst week since April 2020, amid mounting concerns over factors from stimulus cuts and supply-chain bottlenecks globally to new leadership at home. Electronics and chemicals makers were the biggest drags on the Topix, which fell 2.2%, with 32 of 33 industry groups in the red. The benchmark declined 5% on the week. Fast Retailing and Daikin were the largest contributors to a 2.3% daily loss in the Nikkei 225. “Investors are concerned about the impact of supply-chain issues in China, Vietnam and other Southeast Asian countries on the retail sector in the upcoming earnings season,” said Takashi Ito, an equity market strategist at Nomura Securities. U.S. stocks fell Thursday, capping their worst month since March 2020, as investors also eyed risks from inflation, slowing growth, the global energy crunch and regulatory risks emanating from China. U.S. index futures slid Friday as negotiations in Congress failed to produce an agreement on an infrastructure bill. Japanese stocks also reacted this week as Fumio Kishida emerged as the country’s likely next prime minister by winning leadership of the ruling Liberal Democratic Party. Expectations that a potential victory by vaccine czar Taro Kono would lead to favorable new policies had helped drive gains in local equities early last month in the wake of Yoshihide Suga’s resignation. Any change in finance minister under Kishida may pose uncertainties for the stock market, said Tomoichiro Kubota, a senior market analyst at Matsui Securities. Former Olympics minister Shunichi Suzuki -- reported by local media to be in line for the job -- may not be as strong in the position as current minister Taro Aso, he added.
Australian shares also tumbled, caping their fourth weekly loss led lower by banks. The S&P/ASX 200 index fell 2% to close at 7,185.50, dragged lower by weakness in the bank and mining sectors. For the week, the benchmark slipped 2.1%, its fourth consecutive week of losses. All industry groups closed lower, with the financials subgauge down 2.8% for the day, its biggest daily drop since Jun. 21. The broader problem is that Australian shares “have a greater exposure to sectors which are vulnerable to a slowdown in the global economy” said Shane Oliver, head of investment strategy and chief economist at AMP Capital. If the issues of “a debt-ceiling in the U.S., are not resolved and results in default, or the issues regarding energy shortages in Europe and China are not resolved,” Australia remains vulnerable to the fallout, he said. Domino’s Pizza was among the worst performers on the Australian benchmark Friday. Whitehaven was the strongest performer, joining the rally among Asia’s coal producers after China ordered the country’s top state-owned energy companies to secure supplies at all costs. In New Zealand, the S&P/NZX 50 index was little changed at 13,279.15.
In rates, the yield on 10-year Treasuries hovered around 1.48% after earlier dropping to the lowest level since Monday. Treasuries were mixed across the curve, with futures off session lows and curves steady, holding Thursday’s late-day flattening move into the 4pm New York month-end index rebalancing. US yields remained within 1bp of Thursday’s closing levels, the 10-year around 1.485%; bunds and gilts outperform by ~3bp and ~2bp. Focal points for U.S. trading include ISM manufacturing, while Fed’s Harker and Mester are scheduled to speak. Bunds and gilts bull flatten, long end Germany richer by ~1.5bps to gilts with yields off 3.6bps near 0.24%. Cash USTs drift higher. Peripheral and semi-core spreads widen a touch. Japanese government bonds advanced as stocks tumbled and dip buying emerged after a recent bout of selling.
In FX, it was a quiet session with NOK topping the leader board but ranges are generally narrow. The Bloomberg Dollar Spot Index was little changed and is on course for a fourth weekly advance. Demand for dollar long gamma exposure in the front-end persists as a U.S. jobs report due next week provides a fresh catalyst for one-week implieds among major currencies to hit multi-week highs.The euro was steady at around $1.1580, barely budging after data showed inflation in the euro area accelerated to 3.4% in September, compared with expected 3.3%, and the highest level in 13 years. A measure stripping out volatile components such as food and energy climbed to 1.9%, a rate not seen since 2008; yields on European bonds fell, led by the long end. Norway’s krone led G-10 gains as European gas surged to a record 100 euros as China stepped up a global fight for energy supplies, in a move that threatens to derail the economic recovery. Prices later retreated. Cable inched up while gilt yields fell. The U.K.’s Debt Management Office confirmed the nation’s next green gilt will be launched in the week starting Oct. 18, subject to market conditions. Australia’s dollar is headed for a fourth weekly decline as weak equities weigh on growth-linked currencies. A sovereign bond sale met strong investor appetite.
In commodities, crude futures drift lower, putting in a small bounce off the lows as the European session progresses. WTI is down 0.5% near $74.60, Brent is in the red but bounces to trade near $78. Spot gold holds a tight range, so far little changed from Monday’s levels near $1,754/oz. That said, it's only a matter of time before upward pressure on prices returns after China ordered its state-owned companies to secure energy supplies at all costs. Base metals are mostly in the green with LME copper the best performer, snapping back above the $9,000 mark. Gold steadied after posting the biggest gain since March after initial jobless claims in the U.S. climbed.
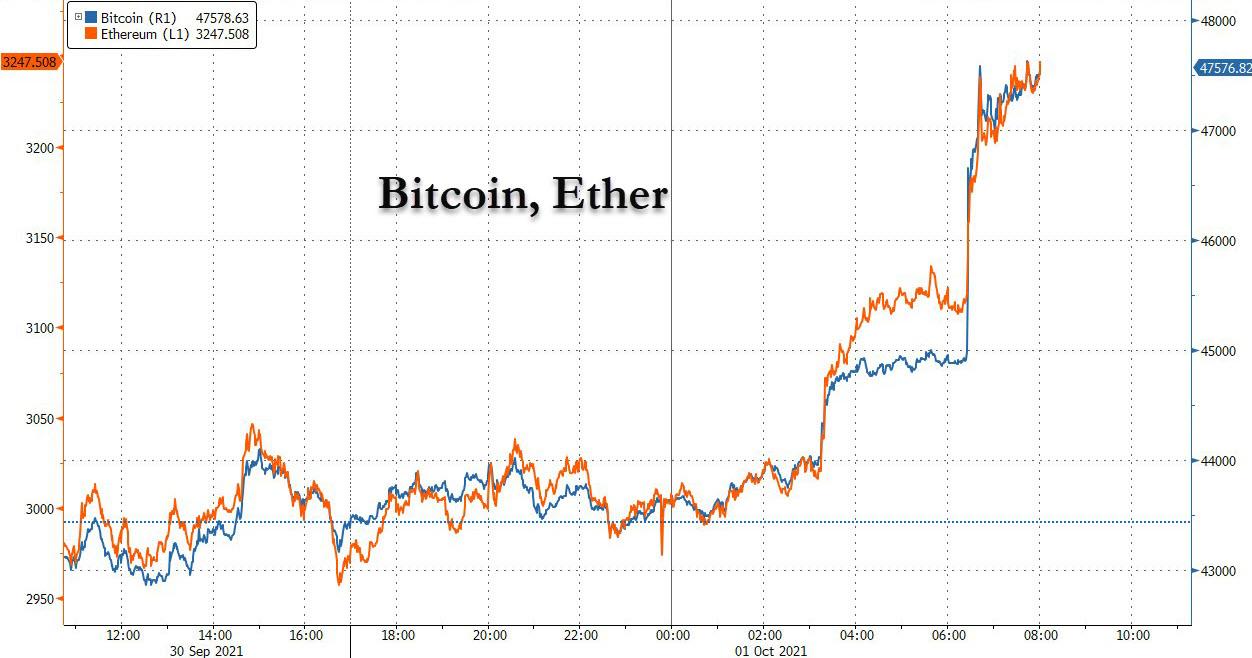
After sliding progressively lower in recent weeks, crytpos bounced sharply higher, with both bitcoin and ethereum up around 8%.
To the day ahead now, and the data highlights include the global manufacturing PMIs for September, as well as the flash Euro Area CPI reading for September and German retail sales for August. In the US, there’ll also be the ISM manufacturing reading for September, along with personal income and personal spending data for August. Central bank speakers include the Fed’s Harker and Mester, and the ECB’s Schnabel.
Market Snapshot
- S&P 500 futures up 0.3% to 4,309
- STOXX Europe 600 down 0.3% to 453.69
- German 10Y yield fell 2.8 bps to -0.228%
- Euro little changed at $1.1580
- MXAP down 1.2% to 194.86
- MXAPJ down 0.9% to 631.09
- Nikkei down 2.3% to 28,771.07
- Topix down 2.2% to 1,986.31
- Hang Seng Index down 0.4% to 24,575.64
- Shanghai Composite up 0.9% to 3,568.17
- Sensex down 0.7% to 58,700.42
- Australia S&P/ASX 200 down 2.0% to 7,185.50
- Kospi down 1.6% to 3,019.18
- Brent Futures down 0.7% to $77.95/bbl
- Gold spot down 0.2% to $1,752.92
- U.S. Dollar Index little changed at 94.28
Top Overnight News from Bloomberg
- Global bond investors are facing their worst year at this point in more than two decades after a selloff in September triggered by hawkish statements from central bankers including Federal Reserve Chair Jerome Powell. The Bloomberg Global Aggregate Index, a benchmark for government and corporate debt, has lost 4.1 percent so far this year, the biggest slump for any such period since at least 1999. Comments last month from Powell that the Fed could start scaling back bond buying in November and a move closer by the Bank of England to raising rates triggered a surge in bond yields globally
- House Speaker Nancy Pelosi plans to try again Friday for a vote on bipartisan infrastructure legislation that’s been held up by a battle between moderate and progressive Democrats over President Joe Biden’s economic agenda
- European manufacturers are increasingly strained by global supply-chain problems that are pushing up prices and may last well into next year. A gauge by IHS Markit measuring business activity in manufacturing fell last month by the biggest margin since April 2020 -- the beginning of the Covid-19 pandemic. Growth in new orders, output and employment slowed considerably
- China’s leadership has told the country’s state- owned miners to produce coal at full capacity for the rest of the year even if they exceed annual quota limits as they struggle with the deepening power crisis
- The U.K. government is getting rid of most of the measures that helped businesses stay afloat during the darkest days of the pandemic. Starting Oct. 1, creditors will once again be allowed to serve statutory demands -- a written warning from a creditor to ask for payment of money owed -- and file winding-up petitions for companies that haven’t paid their debts on time. The government reintroduced personal liability rules for directors in July
A more detailed look at global markets courtesy of Nesquawk
Asia-Pac stocks began Q4 on the backfoot following the negative handover from Wall St. where all major indices declined to close out the worst month and quarter in the S&P 500 since the start of the pandemic, with risk appetite in Asia also not helped by the absence of key markets including Hong Kong which was closed for an extended weekend and with mainland China observing Golden Week holidays. ASX 200 (-2.0%) was heavily pressured by broad losses across its sectors and with the declines led by the top-weighted financial industry and losses in the mining giants, although gold producers weathered the storm and were underpinned by the recent reprieve in the precious metal. Furthermore, there were headwinds from the continued substantial COVID-19 infection numbers and a slowdown in domestic PMI data, as well as the postponement of free trade negotiations with Europe as a fallout from the cancelled submarine deal. Nikkei 225 (-2.3%) suffered from the haven currency inflows and although the latest Tankan data was mostly better than expected in which the Large Manufacturers Index rose for a fifth consecutive quarter to its highest since 2018, the BoJ noted that automakers' sentiment worsened due to parts shortages caused by disruptions at Southeast Asian factories and large automakers' sentiment index was the weakest since December. The removal of Japan’s state of emergency which had been widely flagged, did little to spur risk appetite, although Rakuten was among the few that have bucked the trend as it prepares to list its unit Rakuten Bank. KOSPI (-1.6%) conformed to the broad weakness with the index dampened despite the better-than-expected trade data, while it was also reported that South Korea is to extend current social distancing measures by two weeks and North Korea announced it had conducted an anti-aircraft missile test on Thursday. Finally, 10yr JGBs traded higher with prices lifted by risk aversion in stocks which also underpinned Bunds and T-note futures overnight, while prices in the Japanese benchmark breached resistance at 151.50 and reports noted the BoJ plans to maintain the current pace and size of JGB purchases during Q4.
Top Asian News
- Tata Said to Win Air India in Historic Deal Years in Making
- Post- Suga Jump in Japan Stocks Vanishes With Uninspiring Leader
- Zee Says Unable to Convene Holders’ Meeting as Sought by Invesco
- Asian Factories Recover as Restrictions Ease After Delta Hit
Bourses in Europe kicked off the first trading day of the month on the back foot (Euro Stoxx 50 -0.8%; Stoxx 600 -0.9%), although the selling has somewhat stabilised following the downside momentum experienced heading into and around the cash open. This followed on from a downbeat APAC session and as Chinese markets entered a week-long hibernation due to Golden Week. US equity futures have also succumbed to the risk aversion, with the cyclical RTY (-0.9%) narrowly lagging its ES (-0.6%), NQ (-0.6%) and YM (-0.6%) peers. Back to Europe, the morning saw the final release of the manufacturing PMIs all highlighted the theme of intense supply-side imbalances, with some also noting of the follow-through to consumer demand, whilst IHS suggested that the theme of supply issues and rising prices could continue "well into 2022". The core and periphery equity cash markets are experiencing broad-based losses. Sectors are predominantly in the red and show a somewhat broad performance with no clear bias nor theme. Travel & Leisure opened as the marked underperformer but has since made its way up the ranks. Banks are hit amid the pullback in yields after the European close yesterday – with the US 10yr cash yield back under 1.50% and the 20yr sub-2%. Utilities, however, buck the trend as EDF (+4.2%) shares extend on gains and reside at the top of the Stoxx 600 – with desks citing an element of relief from the French announcement on energy which left electricity tariffs untouched; E.ON (+1.8%), National Grid (+1.6%) and Engie (+1.6%) follow suit. In terms of individual movers, BMW (+1.8%) nursed the losses seen at the open after the German automaker upped its auto revenue guidance despite the ongoing semiconductor shortage, adding that "the continuing positive pricing effects for both new and pre-owned vehicles will overcompensate these negative sales volume effects in the current financial year." ING (-0.8%) meanwhile has trimmed the losses seen at the open following the announcement of a EUR 1.7bln share buyback programme.
Top European News
- Orcel Wrestles Italy Over the Remains of the World’s Oldest Bank
- EU Mulls Freeing Up Aid to Poland and Hungary, With Strings
- Fire at Romanian Covid Hospital Kills at Least Four People
- European Gas Hit Record 100 Euros as Energy Crunch Worsens
In FX, having held just above 94.000 on Thursday when the final position squaring for month end culminated in a loss of bullish momentum, the Dollar and index have firmed up again amidst a risk-off start to October. However, sentiment has gradually improved and US Treasuries have reverted to a more pronounced bull-flattening trajectory to keep the Buck capped ahead of yesterday’s new cycle peaks as the DXY straddles 93.300 within a narrow 94.201-395 band vs its 94.109-504 prior session extremes in the run up to a busy slate of data, surveys and yet more Fedspeak. Elsewhere, the Yen is also benefiting from a degree of safe-haven demand and eyeing 111.00 vs its US peer after containing losses through 112.00 when negative rebalancing flows were peaking, and with some traction from an encouraging Japanese Tankan survey on balance overnight, while the Franc and Gold are both underpinned around 0.9300 and Usd 1750/oz respectively, but the Euro remains heavy after losing 1.1600+ status and deriving no real support from rather mixed Eurozone manufacturing PMIs, below forecast German retail sales or even y/y HICP marginally topping consensus.
- NZD/AUD/GBP/CAD - Somewhat contrasting fortunes for the high beta, activity, cyclical and commodity bloc, as the Kiwi continues to pivot 0.6900 against its US rival and defend the psychological 1.0500 mark vs the Aussie that has overcome disappointment on the back of softer PMIs and considerably weaker than expected housing finance data to extend beyond 0.7200 where hefty 1.7 bn option expiry interest resides. Meanwhile, the Pound is hovering just under 1.3500 following a healthy looking upward revision to the final UK PMI, but the Loonie is lagging between 1.2739-1.2674 parameters pre-Canadian monthly GDP and the official manufacturing PMI.
- SCANDI/EM - Rather perverse price action in Eur/Nok and Eur/Sek as the former retreats beneath 10.1000 after a slowdown in Norway’s manufacturing PMI, but the latter rebounds around a 10.1500 axis irrespective of faster growth in Sweden. Similarly, EM currencies are mixed with the Rub underperforming as Brent reverses through Usd 78/brl, but the Mxn firmer post-Banxico’s rate hike regardless of a downturn in WTI and the Try happy with lower oil prices rather than rattled by another bank predicting that the CBRT will slash benchmark rates by a further 300 bp before year end.
In commodities, WTI and Brent front month futures have been drifting lower throughout the European session with no clear catalyst aside from the overall risk environment. Markets are gearing up OPEC-related headlines ahead of the confab on Monday, with sources yesterday noting that OPEC+ is considering options for releasing more oil to the market at next week's meeting. However, oil analysts caveat that this is just the nature of their meetings whereby "all options are on the table". Recent sources also suggested that despite prices hitting a three-year high above USD 80/bbl for the November Brent contract, the ministers are unlikely to deviate from current plans. All signs currently point towards a smooth meeting – with no pushback seen from any members, although surprises cannot be omitted. On that note, it'll be interesting to see if the meeting provides commentary surrounding the troubles among some African nations to ramp up production amid maintenance problems and low investments. Nonetheless, there is no question that OPEC+ is facing outside pressure to up its production volumes: The White House said the National Security Adviser plans to discuss oil prices with Saudi Arabia, while it noted oil price remains a concern and they have been in touch with OPEC. As a reminder, unanimity among OPEC+ members is required for any tweaks to the Declaration of Cooperation (DoC). WTI Nov resides around USD 74.50bbl (74.23-75.57/bbl range), whilst Brent Dec trades on either side of USD 78/bbl (vs 77.55-78.87/bbl range). Elsewhere, spot gold and silver are in a holding pattern awaiting the next catalyst, with prices somewhat consolidating following yesterday's run. The yellow metal has re-established support at USD 1,750/oz, whilst spot silver drifts higher after printing a floor around the USD 22/oz mark. Over to industrial metals, LME copper is attempting to claw back some of its recent losses whereby prices fell under USD 9k/t in the prior session – a level the red metal has reclaimed, although the absence of China in the market over the next week may provide some headwinds to the overnight demand. For the nickel watchers, BHP said its Kwinana nickel sulphate plant outside Perth had yielded its first nickel sulphate crystals, with the Co. aiming to produce 100k tonnes per annum of nickel sulphate. Finally, it's worth being cognizant of a sources piece via SGH Macro (dated yesterday), which suggested that due to the current power shortages, China's MIIT will "severely" restrict the output of heavy electricity-consuming sectors going forward, such as copper, steel, cement, aluminium.
US Event Calendar
- 8:30am: Aug. Personal Income, est. 0.2%, prior 1.1%
- 8:30am: Aug. Personal Spending, est. 0.6%, prior 0.3%
- 8:30am: Aug. PCE Deflator MoM, est. 0.3%, prior 0.4%; PCE Deflator YoY, est. 4.2%, prior 4.2%
- 8:30am: Aug. PCE Core Deflator YoY, est. 3.5%, prior 3.6%; PCE Core Deflator MoM, est. 0.2%, prior 0.3%
- 8:30am: Aug. Real Personal Spending, est. 0.4%, prior -0.1%
- 9:45am: Sept. Markit US Manufacturing PMI, est. 60.5, prior 60.5
- 10am: Aug. Construction Spending MoM, est. 0.3%, prior 0.3%
- 10am: Sept. ISM Manufacturing, est. 59.5, prior 59.9
- 10am: Sept. U. of Mich. 1 Yr Inflation, est. 4.8%, prior 4.7%; 5-10 Yr Inflation, prior 2.9%
- 10am: Sept. U. of Mich. Sentiment, est. 71.0, prior 71.0; Expectations, est. 67.1, prior 67.1;
- Current Conditions, est. 77.1, prior 77.1
DB's Jim Reid concludes the overnight wrap
I always thought I had a busy job. However if you want a truly hectic one then join the social committee and become chair person of the parents circle at school. My wife volunteered for these roles and she’s now run off her feet. I have to book slots to speak with her. One of her first big events is a colour run tomorrow at the school where hundreds of kids and parents run round a field whilst lots of dye is thrown at them. Why I’m yet to fathom. At least the crutches will be a good excuse to sit at the side with a cup of coffee! The weather forecast is absolutely horrid so this could be a technicoloured mudbath. I dread to think what our kids will end up looking like.
As a cold, wet October gets underway, the US government has avoided being stuck in the mud and will indeed remain open. Last night, both chambers of Congress passed a standalone stopgap spending bill to fund the government through 3 December which could mean that we’re back here again in 2 months. Without the debt ceiling provisions we remain just over 2 weeks away from the Treasury no longer being able to service the national debt. With Republicans unwilling to raise the debt ceiling, that measure is still most likely to pass through budget reconciliation, where Democrats can approve the measure with a simple majority in the Senate, rather than the 60 votes needed to override a filibuster.It’s now a race for Democrats to finish their interparty negotiations on the $3.5 trillion “Build Back Better” plan before the October 18th deadline. In 2011 and 2013, the agreement to raise the debt ceiling was reached with just 2 and 1 day remaining respectively, but both of those bills were bipartisan.
Staying in Washington, there was less success when it came to passing the $550bn bipartisan infrastructure package. We had anticipated a vote on the bill yesterday, which has already been passed by the Senate, but Speaker Pelosi pulled the vote after it became apparent there wasn’t enough support among her Democratic colleagues for it to pass. The issue is that some of the more progressive members among the House Democrats don’t want to vote for it without the larger reconciliation package, which contains much of Biden’s agenda on social programs, and they fear that voting through the infrastructure bill will see moderates scale back the amount of spending on the reconciliation bill, so they’re using their votes on infrastructure as leverage. There were continued attempts yesterday to come up with a framework on reconciliation that had the agreement of Senators Manchin and Sinema (the two Democratic moderates in the Senate), and would thus guarantee an amount that could pass both chambers. But Manchin said last night that he still wanted to cut the amount in the reconciliation package to $1.5tn, from the $3.5tn that was originally proposed, which is something that will not be liked by the progressives. Keep an eye on this however, as it’s possible we could get a vote in the House today on infrastructure instead.
Since it’s the start of Q4 today, and the fact that we never shut down here on the EMR, we’ll shortly be releasing our September and Q3 performance review, running through how different financial assets fared over the last month. For September as a whole, markets had a pretty weak performance that included declines for both bonds and equities. That came amidst jitters over Evergrande, rising energy prices and hence inflationary pressures, as well as a hawkish turn from multiple central banks. In turn, the major equity indices fell back for the first time since January, bringing a consistent run of 7 consecutive monthly increases to an end. Looking at Q3 as a whole was much more positive however, and it’s worth noting that a number of fears about Covid and new variants at the start of the quarter didn’t materialise, with no major new variants emerging since delta. In fact the virus has taken a back seat of late. Anyway, full performance details in the report out shortly.
Back to yesterday now, and markets ended Q3 in a notable risk-off manner as they awaited fiscal developments in the United States, with the S&P 500 having now lost just over -5% since its closing peak back on September 2. US equities lost ground later in the session, with the S&P 500 down -1.19% as part of a broad-based decline, though Europe’s STOXX 600 managed a smaller -0.05% loss. The S&P 500 fell roughly -0.9% in the last half hour of the day yesterday after spending much of the New York afternoon trying to get back to unchanged. To highlight how broad-based the losses were, 23 of the 24 S&P 500 industry groups were lower yesterday, with only semiconductors posting small recovery gains after large losses back on Wednesday. This helped the FANG+ index eke out a +0.22% gain to break a run of 4 consecutive losses. One of the largest laggards in the US yesterday was Bed, Bath and Beyond, which saw its share price fall -22.18% as the company’s adjusted Q2 EPS came in at $0.04 vs $0.52 expected and they revised 2022 EPS estimates to $0.70-$1.10 per share, from its June forecast of $1.40-$1.55 per share. Management cited “unprecedented supply chain challenges" that have been impacting the whole industry and steeper cost inflation outpacing their plans to offset those particular headwinds. There’s been similar commentary from chip producers recently and as we head into earnings season this will be an important factor to pay attention to. After multiple quarters of corporates outperforming low expectations, could this quarter see the inverse for many companies?
Meanwhile, Fed Chair Powell maintained that the surging inflation data is being caused by these supply chain challenges and they will abate. Under questioning from the House Financial Services Committee, Powell said he expects inflation to ease in the first half of 2022. However most of the questioning during yesterday’s hearing was directed at Treasury Secretary Yellen regarding the debt ceiling. Yellen said she was in favour of Congress getting rid of the debt ceiling entirely, repeating her warnings of “catastrophe” if Congress did not raise the limit soon.
All this came against a backdrop of divergent sovereign bond yields. Yesterday saw higher bond prices over in the US, with yields on 10yr Treasuries down -2.1bps to 1.517% and rallying into the weak equity close. But in Europe, yields on 10yr bunds (+1.4bps), OATs (+1.8bps) and BTPs (+3.4bps) moved higher, while Gilts continued their recent underperformance with the spread of 10yr gilt yields over bunds widening a further +3.1bps to reach their widest level since the Brexit referendum in 2016, at 123bps.
Overnight in Asia, most equity markets have begun the new quarter on a negative note, with the Nikkei (-2.01%) and Kospi (-1.32%) declining just as China starts a week-long holiday. In terms of the latest on the power issues, Bloomberg reported overnight that China’s state-owned energy companies have been ordered to secure supplies for the winter by the central government so as to ease the crisis situation. Separately, Japan and Australia made progress in their reopening strategy with Japan coming completely out of the state of emergency (which marks the first time in six months that no region is under an emergency) while Australia brought forward the lift-off on international travel to November. Looking forward, equity futures are pointing to further declines as we start Q4 today, with those on the S&P 500 down (-0.53%).
On the inflation side, there were a number of interesting releases yesterday from the Euro Area ahead of today’s flash CPI estimate for September. In Germany, the EU-harmonised measure of CPI inflation rose to +4.1% (vs. +4.0% expected), marking the highest rate since the formation of the Euro Area. In France the equivalent measure also rose, but by slightly less than expected to +2.7% (vs. +2.8% expected), albeit that was still the strongest in nearly a decade. Finally in Italy, inflation came in as expected at +3.0%, the highest since 2012.
Staying on inflation, we might be sounding like a broken record on this point, but European natural gas prices continued their astonishing rise yesterday, with futures up another +12.89% to bring their gains over September as a whole to +94.23%. There was further evidence it was having an impact on monetary policy as well, with Ukrainian central bank Deputy Governor Nikolaychuk saying that his personal view was that “we’ll need to keep the rate unchanged at 8.5% for longer than we envisaged before.” They were previously looking to cut rates. On the other hand, the Czech central bank rose its benchmark rate +75bps, beyond the 50bps expected and the largest hike in nearly 25 years. Governor Jiri Rusnok said that “we simply need to send a strong signal to people and the economy that we won’t allow inflation expectations to become detached from our target.” He warned that trying to reverse inflation after it is already present would be “dangerous”. He promised more hikes, with the conversation now moving to a question of how much and how often. The Czech koruna gained +0.78% versus the dollar yesterday – its biggest gain in nearly three months. We should note that in some ways the Czech story is uncoupled from the current European energy crisis, since the country has seen inflation run above target for the past three years. But in France, Prime Minister Castex said last night that the government would block an increase in regulated gas tariffs and lower electricity taxes so as to reduce the burden of the latest rise on consumers.
Looking at yesterday’s other data, UK GDP growth in Q2 was revised higher to show +5.5% growth (vs. 4.8% prior estimate), which leaves GDP 3.3% beneath the pre-pandemic level in Q4 2019, rather than 4.4% as previously estimated. In light of the stronger than expected Q2, DB’s UK economist has revised down our Q3 and Q4 projections, reflecting base effects, unfolding supply-side restrictions, and slowing demand momentum. The lower profile for growth will see a +3.6% expansion in 2022, and then +1.5% in 2023. You can read the full update here. Otherwise, German unemployment fell by -30k in September (vs. -37k expected), which leaves the unemployment claims rate at 5.5% as expected. And in the US, the weekly initial jobless claims unexpectedly rose to 362k (vs. 330k expected) in the week through September 25, while Q2 growth was revised up a tenth to an annualised rate of +6.7%.
To the day ahead now, and the data highlights include the global manufacturing PMIs for September, as well as the flash Euro Area CPI reading for September and German retail sales for August. In the US, there’ll also be the ISM manufacturing reading for September, along with personal income and personal spending data for August. Central bank speakers include the Fed’s Harker and Mester, and the ECB’s Schnabel.
Uncategorized
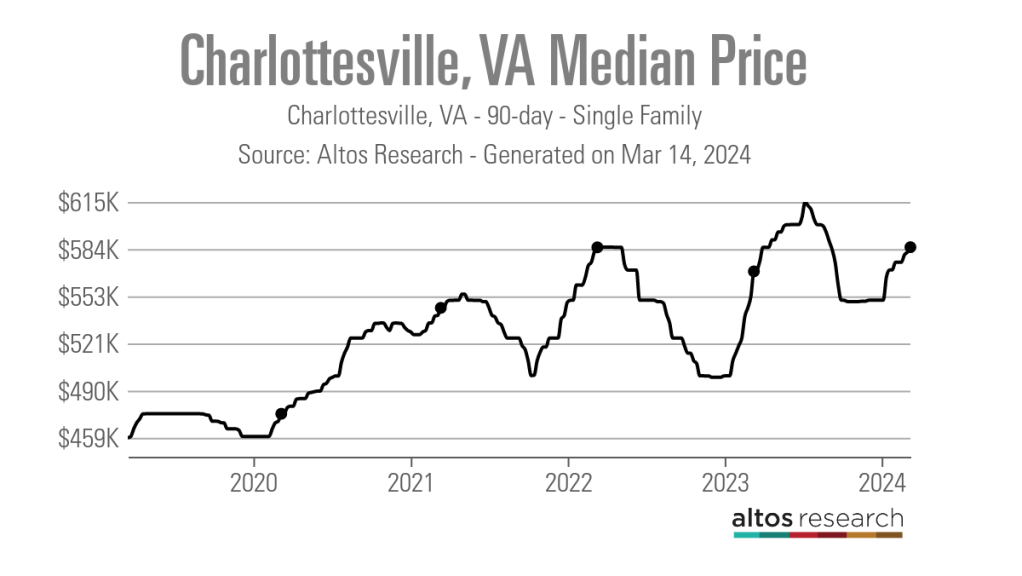
Tight inventory and frustrated buyers challenge agents in Virginia
With inventory a little more than half of what it was pre-pandemic, agents are struggling to find homes for clients in Virginia.
Share this:

No matter where you are in the state, real estate agents in Virginia are facing low inventory conditions that are creating frustrating scenarios for their buyers.
“I think people are getting used to the interest rates where they are now, but there is just a huge lack of inventory,” said Chelsea Newcomb, a RE/MAX Realty Specialists agent based in Charlottesville. “I have buyers that are looking, but to find a house that you love enough to pay a high price for — and to be at over a 6.5% interest rate — it’s just a little bit harder to find something.”
Newcomb said that interest rates and higher prices, which have risen by more than $100,000 since March 2020, according to data from Altos Research, have caused her clients to be pickier when selecting a home.
“When rates and prices were lower, people were more willing to compromise,” Newcomb said.
Out in Wise, Virginia, near the westernmost tip of the state, RE/MAX Cavaliers agent Brett Tiller and his clients are also struggling to find suitable properties.
“The thing that really stands out, especially compared to two years ago, is the lack of quality listings,” Tiller said. “The slightly more upscale single-family listings for move-up buyers with children looking for their forever home just aren’t coming on the market right now, and demand is still very high.”
Statewide, Virginia had a 90-day average of 8,068 active single-family listings as of March 8, 2024, down from 14,471 single-family listings in early March 2020 at the onset of the COVID-19 pandemic, according to Altos Research. That represents a decrease of 44%.

In Newcomb’s base metro area of Charlottesville, there were an average of only 277 active single-family listings during the same recent 90-day period, compared to 892 at the onset of the pandemic. In Wise County, there were only 56 listings.
Due to the demand from move-up buyers in Tiller’s area, the average days on market for homes with a median price of roughly $190,000 was just 17 days as of early March 2024.
“For the right home, which is rare to find right now, we are still seeing multiple offers,” Tiller said. “The demand is the same right now as it was during the heart of the pandemic.”
According to Tiller, the tight inventory has caused homebuyers to spend up to six months searching for their new property, roughly double the time it took prior to the pandemic.
For Matt Salway in the Virginia Beach metro area, the tight inventory conditions are creating a rather hot market.
“Depending on where you are in the area, your listing could have 15 offers in two days,” the agent for Iron Valley Real Estate Hampton Roads | Virginia Beach said. “It has been crazy competition for most of Virginia Beach, and Norfolk is pretty hot too, especially for anything under $400,000.”
According to Altos Research, the Virginia Beach-Norfolk-Newport News housing market had a seven-day average Market Action Index score of 52.44 as of March 14, making it the seventh hottest housing market in the country. Altos considers any Market Action Index score above 30 to be indicative of a seller’s market.

Further up the coastline on the vacation destination of Chincoteague Island, Long & Foster agent Meghan O. Clarkson is also seeing a decent amount of competition despite higher prices and interest rates.
“People are taking their time to actually come see things now instead of buying site unseen, and occasionally we see some seller concessions, but the traffic and the demand is still there; you might just work a little longer with people because we don’t have anything for sale,” Clarkson said.
“I’m busy and constantly have appointments, but the underlying frenzy from the height of the pandemic has gone away, but I think it is because we have just gotten used to it.”
While much of the demand that Clarkson’s market faces is for vacation homes and from retirees looking for a scenic spot to retire, a large portion of the demand in Salway’s market comes from military personnel and civilians working under government contracts.
“We have over a dozen military bases here, plus a bunch of shipyards, so the closer you get to all of those bases, the easier it is to sell a home and the faster the sale happens,” Salway said.
Due to this, Salway said that existing-home inventory typically does not come on the market unless an employment contract ends or the owner is reassigned to a different base, which is currently contributing to the tight inventory situation in his market.
Things are a bit different for Tiller and Newcomb, who are seeing a decent number of buyers from other, more expensive parts of the state.
“One of the crazy things about Louisa and Goochland, which are kind of like suburbs on the western side of Richmond, is that they are growing like crazy,” Newcomb said. “A lot of people are coming in from Northern Virginia because they can work remotely now.”
With a Market Action Index score of 50, it is easy to see why people are leaving the Washington-Arlington-Alexandria market for the Charlottesville market, which has an index score of 41.
In addition, the 90-day average median list price in Charlottesville is $585,000 compared to $729,900 in the D.C. area, which Newcomb said is also luring many Virginia homebuyers to move further south.

“They are very accustomed to higher prices, so they are super impressed with the prices we offer here in the central Virginia area,” Newcomb said.
For local buyers, Newcomb said this means they are frequently being outbid or outpriced.
“A couple who is local to the area and has been here their whole life, they are just now starting to get their mind wrapped around the fact that you can’t get a house for $200,000 anymore,” Newcomb said.
As the year heads closer to spring, triggering the start of the prime homebuying season, agents in Virginia feel optimistic about the market.
“We are seeing seasonal trends like we did up through 2019,” Clarkson said. “The market kind of soft launched around President’s Day and it is still building, but I expect it to pick right back up and be in full swing by Easter like it always used to.”
But while they are confident in demand, questions still remain about whether there will be enough inventory to support even more homebuyers entering the market.
“I have a lot of buyers starting to come off the sidelines, but in my office, I also have a lot of people who are going to list their house in the next two to three weeks now that the weather is starting to break,” Newcomb said. “I think we are going to have a good spring and summer.”
real estate housing market pandemic covid-19 interest ratesInternational
‘Excess Mortality Skyrocketed’: Tucker Carlson and Dr. Pierre Kory Unpack ‘Criminal’ COVID Response
‘Excess Mortality Skyrocketed’: Tucker Carlson and Dr. Pierre Kory Unpack ‘Criminal’ COVID Response
As the global pandemic unfolded, government-funded…
Share this:


As the global pandemic unfolded, government-funded experimental vaccines were hastily developed for a virus which primarily killed the old and fat (and those with other obvious comorbidities), and an aggressive, global campaign to coerce billions into injecting them ensued.
Then there were the lockdowns - with some countries (New Zealand, for example) building internment camps for those who tested positive for Covid-19, and others such as China welding entire apartment buildings shut to trap people inside.
It was an egregious and unnecessary response to a virus that, while highly virulent, was survivable by the vast majority of the general population.
Oh, and the vaccines, which governments are still pushing, didn't work as advertised to the point where health officials changed the definition of "vaccine" multiple times.
Tucker Carlson recently sat down with Dr. Pierre Kory, a critical care specialist and vocal critic of vaccines. The two had a wide-ranging discussion, which included vaccine safety and efficacy, excess mortality, demographic impacts of the virus, big pharma, and the professional price Kory has paid for speaking out.

Keep reading below, or if you have roughly 50 minutes, watch it in its entirety for free on X:
Ep. 81 They’re still claiming the Covid vax is safe and effective. Yet somehow Dr. Pierre Kory treats hundreds of patients who’ve been badly injured by it. Why is no one in the public health establishment paying attention? pic.twitter.com/IekW4Brhoy
— Tucker Carlson (@TuckerCarlson) March 13, 2024
"Do we have any real sense of what the cost, the physical cost to the country and world has been of those vaccines?" Carlson asked, kicking off the interview.
"I do think we have some understanding of the cost. I mean, I think, you know, you're aware of the work of of Ed Dowd, who's put together a team and looked, analytically at a lot of the epidemiologic data," Kory replied. "I mean, time with that vaccination rollout is when all of the numbers started going sideways, the excess mortality started to skyrocket."
When asked "what kind of death toll are we looking at?", Kory responded "...in 2023 alone, in the first nine months, we had what's called an excess mortality of 158,000 Americans," adding "But this is in 2023. I mean, we've had Omicron now for two years, which is a mild variant. Not that many go to the hospital."
'Safe and Effective'
Tucker also asked Kory why the people who claimed the vaccine were "safe and effective" aren't being held criminally liable for abetting the "killing of all these Americans," to which Kory replied: "It’s my kind of belief, looking back, that [safe and effective] was a predetermined conclusion. There was no data to support that, but it was agreed upon that it would be presented as safe and effective."
Tucker Carlson Asks the Forbidden Question
— The Vigilant Fox ???? (@VigilantFox) March 14, 2024
He wants to know why the people who made the claim “safe and effective” aren’t being held to criminal liability for abetting the “killing of all these Americans.”
DR. PIERRE KORY: “It’s my kind of belief, looking back, that [safe and… pic.twitter.com/Icnge18Rtz
Carlson and Kory then discussed the different segments of the population that experienced vaccine side effects, with Kory noting an "explosion in dying in the youngest and healthiest sectors of society," adding "And why did the employed fare far worse than those that weren't? And this particularly white collar, white collar, more than gray collar, more than blue collar."
Kory also said that Big Pharma is 'terrified' of Vitamin D because it "threatens the disease model." As journalist The Vigilant Fox notes on X, "Vitamin D showed about a 60% effectiveness against the incidence of COVID-19 in randomized control trials," and "showed about 40-50% effectiveness in reducing the incidence of COVID-19 in observational studies."
Dr. Pierre Kory: Big Pharma is ‘TERRIFIED’ of Vitamin D
— The Vigilant Fox ???? (@VigilantFox) March 14, 2024
Why?
Because “It threatens the DISEASE MODEL.”
A new meta-analysis out of Italy, published in the journal, Nutrients, has unearthed some shocking data about Vitamin D.
Looking at data from 16 different studies and 1.26… pic.twitter.com/q5CsMqgVju
Professional costs
Kory - while risking professional suicide by speaking out, has undoubtedly helped save countless lives by advocating for alternate treatments such as Ivermectin.
Kory shared his own experiences of job loss and censorship, highlighting the challenges of advocating for a more nuanced understanding of vaccine safety in an environment often resistant to dissenting voices.
"I wrote a book called The War on Ivermectin and the the genesis of that book," he said, adding "Not only is my expertise on Ivermectin and my vast clinical experience, but and I tell the story before, but I got an email, during this journey from a guy named William B Grant, who's a professor out in California, and he wrote to me this email just one day, my life was going totally sideways because our protocols focused on Ivermectin. I was using a lot in my practice, as were tens of thousands of doctors around the world, to really good benefits. And I was getting attacked, hit jobs in the media, and he wrote me this email on and he said, Dear Dr. Kory, what they're doing to Ivermectin, they've been doing to vitamin D for decades..."
"And it's got five tactics. And these are the five tactics that all industries employ when science emerges, that's inconvenient to their interests. And so I'm just going to give you an example. Ivermectin science was extremely inconvenient to the interests of the pharmaceutical industrial complex. I mean, it threatened the vaccine campaign. It threatened vaccine hesitancy, which was public enemy number one. We know that, that everything, all the propaganda censorship was literally going after something called vaccine hesitancy."
Money makes the world go 'round
Carlson then hit on perhaps the most devious aspect of the relationship between drug companies and the medical establishment, and how special interests completely taint science to the point where public distrust of institutions has spiked in recent years.
"I think all of it starts at the level the medical journals," said Kory. "Because once you have something established in the medical journals as a, let's say, a proven fact or a generally accepted consensus, consensus comes out of the journals."
"I have dozens of rejection letters from investigators around the world who did good trials on ivermectin, tried to publish it. No thank you, no thank you, no thank you. And then the ones that do get in all purportedly prove that ivermectin didn't work," Kory continued.
"So and then when you look at the ones that actually got in and this is where like probably my biggest estrangement and why I don't recognize science and don't trust it anymore, is the trials that flew to publication in the top journals in the world were so brazenly manipulated and corrupted in the design and conduct in, many of us wrote about it. But they flew to publication, and then every time they were published, you saw these huge PR campaigns in the media. New York Times, Boston Globe, L.A. times, ivermectin doesn't work. Latest high quality, rigorous study says. I'm sitting here in my office watching these lies just ripple throughout the media sphere based on fraudulent studies published in the top journals. And that's that's that has changed. Now that's why I say I'm estranged and I don't know what to trust anymore."
Vaccine Injuries
Carlson asked Kory about his clinical experience with vaccine injuries.
"So how this is how I divide, this is just kind of my perception of vaccine injury is that when I use the term vaccine injury, I'm usually referring to what I call a single organ problem, like pericarditis, myocarditis, stroke, something like that. An autoimmune disease," he replied.
"What I specialize in my practice, is I treat patients with what we call a long Covid long vaxx. It's the same disease, just different triggers, right? One is triggered by Covid, the other one is triggered by the spike protein from the vaccine. Much more common is long vax. The only real differences between the two conditions is that the vaccinated are, on average, sicker and more disabled than the long Covids, with some pretty prominent exceptions to that."
Watch the entire interview above, and you can support Tucker Carlson's endeavors by joining the Tucker Carlson Network here...
Uncategorized
These Cities Have The Highest (And Lowest) Share Of Unaffordable Neighborhoods In 2024
These Cities Have The Highest (And Lowest) Share Of Unaffordable Neighborhoods In 2024
Authored by Sam Bourgi via CreditNews.com,
Homeownership…
Share this:


Authored by Sam Bourgi via CreditNews.com,
Homeownership is one of the key pillars of the American dream. But for many families, the idyllic fantasy of a picket fence and backyard barbecues remains just that—a fantasy.
Thanks to elevated mortgage rates, sky-high house prices, and scarce inventory, millions of American families have been locked out of the opportunity to buy a home in many cities.
To shed light on America’s housing affordability crisis, Creditnews Research ranked the 50 most populous cities by the percentage of neighborhoods within reach for the typical married-couple household to buy a home in.
The study reveals a stark reality, with many cities completely out of reach for the most affluent household type. Not only that, the unaffordability has radically worsened in recent years.
Comparing how affordability has changed since Covid, Creditnews Research discovered an alarming pattern—indicating consistently more unaffordable housing in all but three cities.
Fortunately, there’s still hope for households seeking to put down roots in more affordable cities—especially for those looking beyond Los Angeles, New York, Boston, San Jone, and Miami.
The typical American family has a hard time putting down roots in many parts of the country. In 11 of the top 50 cities, at least 50% of neighborhoods are out of reach for the average married-couple household. The affordability gap has widened significantly since Covid; in fact, no major city has reported an improvement in affordability post-pandemic.
Sam Bourgi, Senior Analyst at Creditnews
Key findings
-
The most unaffordable cities are Los Angeles, Boston, St. Louis, and San Jose; in each city, 100% of neighborhoods are out of reach for for married-couple households earning a median income;
-
The most affordable cities are Cleveland, Hartford, and Memphis—in these cities, the typical family can afford all neighborhoods;
-
None of the top 50 cities by population saw an improvement in affordable neighborhoods post-pandemic;
-
California recorded the biggest spike in unaffordable neighborhoods since pre-Covid;
-
The share of unaffordable neighborhoods has increased the most since pre-Covid in San Jose (70 percentage points), San Diego (from 57.8 percentage points), and Riverside-San Bernardino (51.9 percentage points);
-
Only three cities have seen no change in housing affordability since pre-Covid: Cleveland, Memphis, and Hartford. They’re also the only cities that had 0% of unaffordable neighborhoods before Covid.
Cities with the highest share of unaffordable neighborhoods
With few exceptions, the most unaffordable cities for married-couple households tend to be located in some of the nation’s most expensive housing markets.
Four cities in the ranking have an unaffordability percentage of 100%—indicating that the median married-couple household couldn’t qualify for an average home in any neighborhood.
The following are the cities ranked from the least affordable to the most:
-
Los Angeles, CA: Housing affordability in Los Angeles has deteriorated over the last five years, as average incomes have failed to keep pace with rising property values and elevated mortgage rates. The median household income of married-couple families in LA is $117,056, but even at that rate, 100% of the city’s neighborhoods are unaffordable.
-
St. Louis, MO: It may be surprising to see St. Louis ranking among the most unaffordable housing markets for married-couple households. But a closer look reveals that the Mound City was unaffordable even before Covid. In 2019, 98% of the city’s neighborhoods were unaffordable—way worse than Los Angeles, Boston, or San Jose.
-
Boston, MA: Boston’s housing affordability challenges began long before Covid but accelerated after the pandemic. Before Covid, married couples earning a median income were priced out of 90.7% of Boston’s neighborhoods. But that figure has since jumped to 100%, despite a comfortable median household income of $172,223.
-
San Jose, CA: Nestled in Silicon Valley, San Jose has long been one of the most expensive cities for housing in America. But things have gotten far worse since Covid, as 100% of its neighborhoods are now out of reach for the average family. Perhaps the most shocking part is that the median household income for married-couple families is $188,403—much higher than the national average.
-
San Diego, CA: Another California city, San Diego, is among the most unaffordable places in the country. Despite boasting a median married-couple household income of $136,297, 95.6% of the city’s neighborhoods are unaffordable.
-
San Francisco, CA: San Francisco is another California city with a high married-couple median income ($211,585) but low affordability. The percentage of unaffordable neighborhoods for these homebuyers stands at 89.2%.
-
New York, NY: As one of the most expensive cities in America, New York is a difficult housing market for married couples with dual income. New York City’s share of unaffordable neighborhoods is 85.9%, marking a 33.4% rise from pre-Covid times.
-
Miami, FL: Partly due to a population boom post-Covid, Miami is now one of the most unaffordable cities for homebuyers. Roughly four out of five (79.4%) of Miami’s neighborhoods are out of reach price-wise for married-couple families. That’s a 34.7% increase from 2019.
-
Nashville, TN: With Nashville’s population growth rebounding to pre-pandemic levels, the city has also seen greater affordability challenges. In the Music City, 73.7% of neighborhoods are considered unaffordable for married-couple households—an increase of 11.9% from pre-Covid levels.
-
Richmond, VA: Rounding out the bottom 10 is Richmond, where 55.9% of the city’s 161 neighborhoods are unaffordable for married-couple households. That’s an 11.9% increase from pre-Covid levels.
Cities with the lowest share of unaffordable neighborhoods
All the cities in our top-10 ranking have less than 10% unaffordable neighborhoods—meaning the average family can qualify for a home in at least 90% of the city.
Interestingly, these cities are also outside the top 15 cities by population, and eight are in the bottom half.
The following are the cities ranked from the most affordable to the least:
-
Hartford, CT: Hartford ranks first with the percentage of unaffordable neighborhoods at 0%, unchanged since pre-Covid times. Married couples earning a median income of $135,612 can afford to live in any of the city’s 16 neighborhoods. Interestingly, Hartford is the smallest city to rank in the top 10.
-
Memphis, TN: Like Hartford, Memphis has 0% unaffordable neighborhoods, meaning any married couple earning a median income of $101,734 can afford an average homes in any of the city’s 12 neighborhoods. The percentage of unaffordable neighborhoods also stood at 0% before Covid.
-
Cleveland, OH: The Midwestern city of Cleveland is also tied for first, with the percentage of unaffordable neighborhoods at 0%. That means households with a median-couple income of $89,066 can qualify for an average home in all of the city’s neighborhoods. Cleveland is also among the three cities that have seen no change in unaffordability compared to 2019.
-
Minneapolis, MN: The largest city in the top 10, Minneapolis’ share of unaffordable neighborhoods stood at 2.41%, up slightly from 2019. Married couples earning the median income ($149,214) have access to the vast majority of the city’s 83 neighborhoods.
-
Baltimore, MD: Married-couple households in Baltimore earn a median income of $141,634. At that rate, they can afford to live in 97.3% of the city’s 222 neighborhoods, making only 2.7% of neighborhoods unaffordable. That’s up from 0% pre-Covid.
-
Louisville, KY: Louisville is a highly competitive market for married households. For married-couple households earning a median wage, only 3.6% of neighborhoods are unaffordable, up 11.9% from pre-Covid times.
-
Cincinnati, OH: The second Ohio city in the top 10 ranks close to Cleveland in population but has a much higher median married-couple household income of $129,324. Only 3.6% of the city’s neighborhoods are unaffordable, up slightly from pre-pandemic levels.
-
Indianapolis, IN: Another competitive Midwestern market, only 4.4% of Indianapolis is unaffordable, making the vast majority of the city’s 92 neighborhoods accessible to the average married couple. Still, the percentage of unaffordable neighborhoods before Covid was less than 1%.
-
Oklahoma City, OK: Before Covid, Oklahoma City had 0% neighborhoods unaffordable for married-couple households earning the median wage. It has since increased to 4.69%, which is still tiny compared to the national average.
-
Kansas City, MO: Kansas City has one of the largest numbers of neighborhoods in the top 50 cities. Its married-couple residents can afford to live in nearly 95% of them, making only 5.6% of neighborhoods out of reach. Like Indiana, Kansas City’s share of unaffordable neighborhoods was less than 1% before Covid.
The biggest COVID losers
What's particularly astonishing about the current housing market is just how quickly affordability has declined since Covid.
Even factoring in the market correction after the 2022 peak, the price of existing homes is still nearly one-third higher than before Covid. Mortgage rates have also more than doubled since early 2022.
Combined, the rising home prices and interest rates led to the worst mortgage affordability in more than 40 years.
Against this backdrop, it’s hardly surprising that unaffordability increased in 47 of the 50 cities studied and remained flat in the other three. No city reported improved affordability in 2024 compared to 2019.
The biggest increases are led by San Jose (70 percentage points), San Diego (57.8 percentage points), Riverside-San Bernardino (51.9 percentage points), Sacramento (43 percentage points), Orlando (37.4 percentage points), Miami (34.7 percentage points), and New York City (33.4 percentage points).
The following cities in our study are ranked by the largest percentage point change in unaffordable neighborhoods since pre-Covid:


IFM’s Hat Trick and Reflections On Option-To-Buy M&A


Q4 Update: Delinquencies, Foreclosures and REO


Net Zero, The Digital Panopticon, & The Future Of Food


Pharma industry reputation remains steady at a ‘new normal’ after Covid, Harris Poll finds


These Cities Have The Highest (And Lowest) Share Of Unaffordable Neighborhoods In 2024


For-profit nursing homes are cutting corners on safety and draining resources with financial shenanigans − especially at midsize chains that dodge public scrutiny


The Question You Should Ask Whenever You’re Wrong


Trump nearly derailed democracy once − here’s what to watch out for in reelection campaign


Part 1: Current State of the Housing Market; Overview for mid-March 2024


Health Officials: Man Dies From Bubonic Plague In New Mexico
-

 Uncategorized3 weeks ago
All Of The Elements Are In Place For An Economic Crisis Of Staggering Proportions
-

 International6 days ago
EyePoint poaches medical chief from Apellis; Sandoz CFO, longtime BioNTech exec to retire
-

 Uncategorized4 weeks ago
California Counties Could Be Forced To Pay $300 Million To Cover COVID-Era Program
-

 Uncategorized3 weeks ago
Apparel Retailer Express Moving Toward Bankruptcy
-

 Uncategorized4 weeks ago
Industrial Production Decreased 0.1% in January
-

 International6 days ago
Walmart launches clever answer to Target’s new membership program
-

 Uncategorized4 weeks ago
RFK Jr: The Wuhan Cover-Up & The Rise Of The Biowarfare-Industrial Complex
-

 Uncategorized3 weeks ago
GOP Efforts To Shore Up Election Security In Swing States Face Challenges