Government
First UI claims of 2021 are still higher than the worst of the Great Recession
There was an armed insurrection at the U.S. Capitol yesterday in which the police were complicit in a way that has everything to do with structural racism.
Share this:

There was an armed insurrection at the U.S. Capitol yesterday in which the police were complicit in a way that has everything to do with structural racism. Structural racism has also meant that Black and Latinx working people are experiencing a disproportionate health and economic impact of the COVID-19 pandemic. The UI data released this morning show a labor market in turmoil as COVID-19 surges.
Another 948,000 people applied for Unemployment Insurance (UI) benefits last week, including 787,000 people who applied for regular state UI and 161,000 who applied for Pandemic Unemployment Assistance (PUA). The 948,000 who applied for UI last week was a decrease of 152,000 from the prior week. That drop was driven almost entirely by a drop in PUA claims, undoubtedly due to uncertainty over whether PUA would be extended, as Trump delayed signing the relief bill during that week. Now that the program has been extended (more on that below), I expect PUA claims to rise again in coming weeks.
Last week was the 42nd straight week total initial claims were greater than the worst week of the Great Recession. (If that comparison is restricted to regular state claims—because we didn’t have PUA in the Great Recession—initial claims last week were greater than the second-worst week of the Great Recession.)
Most states provide 26 weeks (six months) of regular benefits. Given the length of this crisis, many workers have exhausted their regular state UI benefits. In the most recent data, continuing claims for regular state UI dropped by 126,000. After an individual exhausts regular state benefits, they can move onto Pandemic Emergency Unemployment Compensation (PEUC), which is an additional 24 weeks of regular state UI (the December COVID-19 relief bill increased the number of weeks of PEUC eligibility by 11, from 13 to 24).
However, in the most recent data available for PEUC, the week ending Dec 19, PEUC claims dropped by 293,000. That was undoubtedly due to exhaustions. Well over 2 million people had exhausted the original 13 weeks of PEUC before Congress passed the extensions (see column C43 in form ETA 5159 for PEUC here). These workers are eligible for the additional 11 weeks, but they will need to recertify. We can expect PEUC numbers to swell dramatically as this occurs.
Continuing claims for PUA also dropped, by 71,000, in the latest data. The latest data for this series is also for the week ending December 19—so before the relief bill, meaning some of that drop would have been exhaustions, i.e. temporary. The COVID-19 relief bill also extended the total weeks of eligibility for PUA by 11, from 39 to 50 weeks. As with PEUC, those who had exhausted the original 39 weeks of PUA before Congress passed the extensions are eligible for the additional 11 weeks, but they will need to recertify. Workers who were still on PUA (or PEUC) when Congress passed the bill will not need to recertify.
The 11-week extensions of PEUC and PUA just kick the can down the road—they are not long enough. Without additional action by Congress, millions will exhaust benefits in mid-March, when the virus is still surging and job opportunities are still scarce.
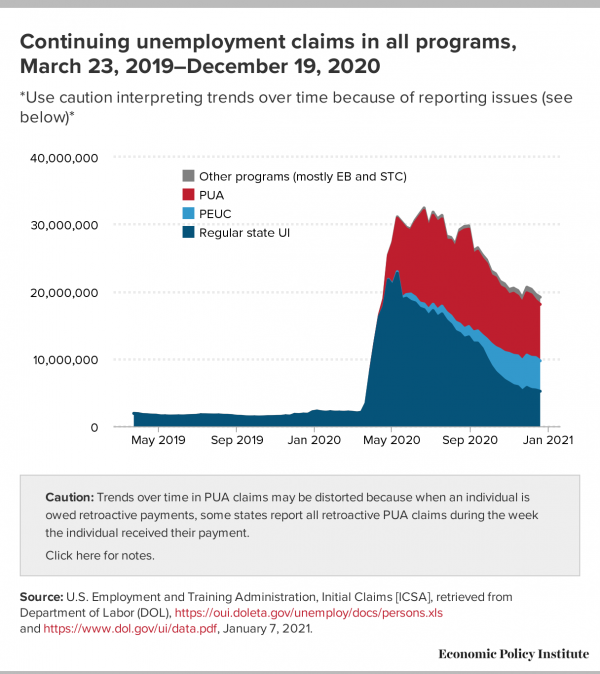
Figure A shows continuing claims in all programs over time (the latest data are for December 19). Continuing claims are still more than 17 million above where they were a year ago, even with the exhaustions occurring during the time period covered by this chart.

Senate Republicans allowed Federal Pandemic Unemployment Compensation (FPUC), the across-the-board $600 increase in weekly UI benefits, to expire at the end of July. Fortunately, in the December COVID-19 relief bill, FPUC was reinstated—but at just $300. And, the $300 is not retroactive, so unemployed workers will get no additional payments for the five months the FPUC was not in place.
This blog post by Michele Evermore at the National Employment Law Project (NELP) is an excellent summary of the UI provisions in the December COVID-19 relief bill. One new UI program is Mixed Earner Unemployment Compensation (MEUC). MEUC solves a glitch that meant unemployed workers who had W-2 earnings and self-employment earnings were, in many cases, losing a significant amount of UI benefits under the CARES Act. In particular, because these “mixed earners” had W-2 earnings, they got regular benefits and therefore, under CARES, couldn’t get anything from PUA. This was a serious issue for workers who had a little W-2 earnings and a lot of self-employment earnings. What MEUC does is give workers on regular benefits an extra $100 per week if they also had at least $5,000 in self-employment income in 2019. MEUC is, regrettably, optional for states to implement.
One reason it’s unfortunate that, as mentioned above, FPUC was reduced to $300—and that it is not retroactive—is that UI is extremely effective economic stimulus. Reinstating the full $600 FPUC would have created or saved millions more jobs than adding just $300 for only 11 weeks. There are now 26.1 million workers who are either unemployed, otherwise out of work because of the virus, or have seen a drop in hours and pay because of the pandemic. Further, job growth is slowing, and the virus is surging. More relief is desperately needed.
A key reason more relief is so important is that this crisis is greatly exacerbating racial inequality. Due to the impact of historic and current systemic racism, Black and Latinx workers have seen more job loss in this pandemic, and have less wealth to fall back on. To get the economy back on track in a reasonable timeframe, we need policymakers to pass an additional $2.1 trillion in fiscal support (the $2.1 trillion is calculated by subtracting the $900 billion December COVID-19 relief bill from the total $3 trillion in fiscal support that is actually needed). In particular, it is crucial that Congress provide substantial aid to state and local governments. Without this aid, austerity by state and local governments will result in cuts to essential public services and the loss of millions of jobs in both the public and private sector.
Senate Republicans forced the December bill to be far too small. Fortunately, with the new Democratic majority in the Senate given the results of the Georgia runoffs, Democrats will now be able to get more relief measures through reconciliation. Top priorities are aid to state and local governments and further extensions of UI. There is no time to lose.
recession unemployment pandemic covid-19 stimulus congress senate trump recession unemploymentInternational
Fuel poverty in England is probably 2.5 times higher than government statistics show
The top 40% most energy efficient homes aren’t counted as being in fuel poverty, no matter what their bills or income are.
Share this:


The cap set on how much UK energy suppliers can charge for domestic gas and electricity is set to fall by 15% from April 1 2024. Despite this, prices remain shockingly high. The average household energy bill in 2023 was £2,592 a year, dwarfing the pre-pandemic average of £1,308 in 2019.
The term “fuel poverty” refers to a household’s ability to afford the energy required to maintain adequate warmth and the use of other essential appliances. Quite how it is measured varies from country to country. In England, the government uses what is known as the low income low energy efficiency (Lilee) indicator.
Since energy costs started rising sharply in 2021, UK households’ spending powers have plummeted. It would be reasonable to assume that these increasingly hostile economic conditions have caused fuel poverty rates to rise.
However, according to the Lilee fuel poverty metric, in England there have only been modest changes in fuel poverty incidence year on year. In fact, government statistics show a slight decrease in the nationwide rate, from 13.2% in 2020 to 13.0% in 2023.
Our recent study suggests that these figures are incorrect. We estimate the rate of fuel poverty in England to be around 2.5 times higher than what the government’s statistics show, because the criteria underpinning the Lilee estimation process leaves out a large number of financially vulnerable households which, in reality, are unable to afford and maintain adequate warmth.

Energy security
In 2022, we undertook an in-depth analysis of Lilee fuel poverty in Greater London. First, we combined fuel poverty, housing and employment data to provide an estimate of vulnerable homes which are omitted from Lilee statistics.
We also surveyed 2,886 residents of Greater London about their experiences of fuel poverty during the winter of 2022. We wanted to gauge energy security, which refers to a type of self-reported fuel poverty. Both parts of the study aimed to demonstrate the potential flaws of the Lilee definition.
Introduced in 2019, the Lilee metric considers a household to be “fuel poor” if it meets two criteria. First, after accounting for energy expenses, its income must fall below the poverty line (which is 60% of median income).
Second, the property must have an energy performance certificate (EPC) rating of D–G (the lowest four ratings). The government’s apparent logic for the Lilee metric is to quicken the net-zero transition of the housing sector.
In Sustainable Warmth, the policy paper that defined the Lilee approach, the government says that EPC A–C-rated homes “will not significantly benefit from energy-efficiency measures”. Hence, the focus on fuel poverty in D–G-rated properties.
Generally speaking, EPC A–C-rated homes (those with the highest three ratings) are considered energy efficient, while D–G-rated homes are deemed inefficient. The problem with how Lilee fuel poverty is measured is that the process assumes that EPC A–C-rated homes are too “energy efficient” to be considered fuel poor: the main focus of the fuel poverty assessment is a characteristic of the property, not the occupant’s financial situation.
In other words, by this metric, anyone living in an energy-efficient home cannot be considered to be in fuel poverty, no matter their financial situation. There is an obvious flaw here.
Around 40% of homes in England have an EPC rating of A–C. According to the Lilee definition, none of these homes can or ever will be classed as fuel poor. Even though energy prices are going through the roof, a single-parent household with dependent children whose only income is universal credit (or some other form of benefits) will still not be considered to be living in fuel poverty if their home is rated A-C.
The lack of protection afforded to these households against an extremely volatile energy market is highly concerning.
In our study, we estimate that 4.4% of London’s homes are rated A-C and also financially vulnerable. That is around 171,091 households, which are currently omitted by the Lilee metric but remain highly likely to be unable to afford adequate energy.
In most other European nations, what is known as the 10% indicator is used to gauge fuel poverty. This metric, which was also used in England from the 1990s until the mid 2010s, considers a home to be fuel poor if more than 10% of income is spent on energy. Here, the main focus of the fuel poverty assessment is the occupant’s financial situation, not the property.
Were such alternative fuel poverty metrics to be employed, a significant portion of those 171,091 households in London would almost certainly qualify as fuel poor.
This is confirmed by the findings of our survey. Our data shows that 28.2% of the 2,886 people who responded were “energy insecure”. This includes being unable to afford energy, making involuntary spending trade-offs between food and energy, and falling behind on energy payments.
Worryingly, we found that the rate of energy insecurity in the survey sample is around 2.5 times higher than the official rate of fuel poverty in London (11.5%), as assessed according to the Lilee metric.
It is likely that this figure can be extrapolated for the rest of England. If anything, energy insecurity may be even higher in other regions, given that Londoners tend to have higher-than-average household income.
The UK government is wrongly omitting hundreds of thousands of English households from fuel poverty statistics. Without a more accurate measure, vulnerable households will continue to be overlooked and not get the assistance they desperately need to stay warm.
Torran Semple receives funding from Engineering and Physical Sciences Research Council (EPSRC) grant EP/S023305/1.
John Harvey does not work for, consult, own shares in or receive funding from any company or organisation that would benefit from this article, and has disclosed no relevant affiliations beyond their academic appointment.
european uk pandemicInternational
Looking Back At COVID’s Authoritarian Regimes
After having moved from Canada to the United States, partly to be wealthier and partly to be freer (those two are connected, by the way), I was shocked,…
Share this:


After having moved from Canada to the United States, partly to be wealthier and partly to be freer (those two are connected, by the way), I was shocked, in March 2020, when President Trump and most US governors imposed heavy restrictions on people’s freedom. The purpose, said Trump and his COVID-19 advisers, was to “flatten the curve”: shut down people’s mobility for two weeks so that hospitals could catch up with the expected demand from COVID patients. In her book Silent Invasion, Dr. Deborah Birx, the coordinator of the White House Coronavirus Task Force, admitted that she was scrambling during those two weeks to come up with a reason to extend the lockdowns for much longer. As she put it, “I didn’t have the numbers in front of me yet to make the case for extending it longer, but I had two weeks to get them.” In short, she chose the goal and then tried to find the data to justify the goal. This, by the way, was from someone who, along with her task force colleague Dr. Anthony Fauci, kept talking about the importance of the scientific method. By the end of April 2020, the term “flatten the curve” had all but disappeared from public discussion.
Now that we are four years past that awful time, it makes sense to look back and see whether those heavy restrictions on the lives of people of all ages made sense. I’ll save you the suspense. They didn’t. The damage to the economy was huge. Remember that “the economy” is not a term used to describe a big machine; it’s a shorthand for the trillions of interactions among hundreds of millions of people. The lockdowns and the subsequent federal spending ballooned the budget deficit and consequent federal debt. The effect on children’s learning, not just in school but outside of school, was huge. These effects will be with us for a long time. It’s not as if there wasn’t another way to go. The people who came up with the idea of lockdowns did so on the basis of abstract models that had not been tested. They ignored a model of human behavior, which I’ll call Hayekian, that is tested every day.
These are the opening two paragraphs of my latest Defining Ideas article, “Looking Back at COVID’s Authoritarian Regimes,” Defining Ideas, March 14, 2024.
Another excerpt:
That wasn’t the only uncertainty. My daughter Karen lived in San Francisco and made her living teaching Pilates. San Francisco mayor London Breed shut down all the gyms, and so there went my daughter’s business. (The good news was that she quickly got online and shifted many of her clients to virtual Pilates. But that’s another story.) We tried to see her every six weeks or so, whether that meant our driving up to San Fran or her driving down to Monterey. But were we allowed to drive to see her? In that first month and a half, we simply didn’t know.
Read the whole thing, which is longer than usual.
(0 COMMENTS) budget deficit coronavirus covid-19 white house fauci trump canadaInternational
Problems After COVID-19 Vaccination More Prevalent Among Naturally Immune: Study
Problems After COVID-19 Vaccination More Prevalent Among Naturally Immune: Study
Authored by Zachary Stieber via The Epoch Times (emphasis…
Share this:

Authored by Zachary Stieber via The Epoch Times (emphasis ours),
People who recovered from COVID-19 and received a COVID-19 shot were more likely to suffer adverse reactions, researchers in Europe are reporting.
Participants in the study were more likely to experience an adverse reaction after vaccination regardless of the type of shot, with one exception, the researchers found.
Across all vaccine brands, people with prior COVID-19 were 2.6 times as likely after dose one to suffer an adverse reaction, according to the new study. Such people are commonly known as having a type of protection known as natural immunity after recovery.
People with previous COVID-19 were also 1.25 times as likely after dose 2 to experience an adverse reaction.
The findings held true across all vaccine types following dose one.
Of the female participants who received the Pfizer-BioNTech vaccine, for instance, 82 percent who had COVID-19 previously experienced an adverse reaction after their first dose, compared to 59 percent of females who did not have prior COVID-19.
The only exception to the trend was among males who received a second AstraZeneca dose. The percentage of males who suffered an adverse reaction was higher, 33 percent to 24 percent, among those without a COVID-19 history.
“Participants who had a prior SARS-CoV-2 infection (confirmed with a positive test) experienced at least one adverse reaction more often after the 1st dose compared to participants who did not have prior COVID-19. This pattern was observed in both men and women and across vaccine brands,” Florence van Hunsel, an epidemiologist with the Netherlands Pharmacovigilance Centre Lareb, and her co-authors wrote.
There were only slightly higher odds of the naturally immune suffering an adverse reaction following receipt of a Pfizer or Moderna booster, the researchers also found.
The researchers performed what’s known as a cohort event monitoring study, following 29,387 participants as they received at least one dose of a COVID-19 vaccine. The participants live in a European country such as Belgium, France, or Slovakia.
Overall, three-quarters of the participants reported at least one adverse reaction, although some were minor such as injection site pain.
Adverse reactions described as serious were reported by 0.24 percent of people who received a first or second dose and 0.26 percent for people who received a booster. Different examples of serious reactions were not listed in the study.
Participants were only specifically asked to record a range of minor adverse reactions (ADRs). They could provide details of other reactions in free text form.
“The unsolicited events were manually assessed and coded, and the seriousness was classified based on international criteria,” researchers said.
The free text answers were not provided by researchers in the paper.
“The authors note, ‘In this manuscript, the focus was not on serious ADRs and adverse events of special interest.’” Yet, in their highlights section they state, “The percentage of serious ADRs in the study is low for 1st and 2nd vaccination and booster.”
Dr. Joel Wallskog, co-chair of the group React19, which advocates for people who were injured by vaccines, told The Epoch Times: “It is intellectually dishonest to set out to study minor adverse events after COVID-19 vaccination then make conclusions about the frequency of serious adverse events. They also fail to provide the free text data.” He added that the paper showed “yet another study that is in my opinion, deficient by design.”
Ms. Hunsel did not respond to a request for comment.
She and other researchers listed limitations in the paper, including how they did not provide data broken down by country.
The paper was published by the journal Vaccine on March 6.
The study was funded by the European Medicines Agency and the Dutch government.
No authors declared conflicts of interest.
Some previous papers have also found that people with prior COVID-19 infection had more adverse events following COVID-19 vaccination, including a 2021 paper from French researchers. A U.S. study identified prior COVID-19 as a predictor of the severity of side effects.
Some other studies have determined COVID-19 vaccines confer little or no benefit to people with a history of infection, including those who had received a primary series.
The U.S. Centers for Disease Control and Prevention still recommends people who recovered from COVID-19 receive a COVID-19 vaccine, although a number of other health authorities have stopped recommending the shot for people who have prior COVID-19.
Another New Study
In another new paper, South Korean researchers outlined how they found people were more likely to report certain adverse reactions after COVID-19 vaccination than after receipt of another vaccine.
The reporting of myocarditis, a form of heart inflammation, or pericarditis, a related condition, was nearly 20 times as high among children as the reporting odds following receipt of all other vaccines, the researchers found.
The reporting odds were also much higher for multisystem inflammatory syndrome or Kawasaki disease among adolescent COVID-19 recipients.
Researchers analyzed reports made to VigiBase, which is run by the World Health Organization.
“Based on our results, close monitoring for these rare but serious inflammatory reactions after COVID-19 vaccination among adolescents until definitive causal relationship can be established,” the researchers wrote.
The study was published by the Journal of Korean Medical Science in its March edition.
Limitations include VigiBase receiving reports of problems, with some reports going unconfirmed.
Funding came from the South Korean government. One author reported receiving grants from pharmaceutical companies, including Pfizer.


Problems After COVID-19 Vaccination More Prevalent Among Naturally Immune: Study


For-profit nursing homes are cutting corners on safety and draining resources with financial shenanigans − especially at midsize chains that dodge public scrutiny


Trump nearly derailed democracy once − here’s what to watch out for in reelection campaign


Looking Back At COVID’s Authoritarian Regimes


Health Officials: Man Dies From Bubonic Plague In New Mexico


Five Aerospace Investments to Buy as Wars Worsen Copy


Stock Market Today: Stocks turn lower as factory inflation spikes, retail sales miss target


The SNF Institute for Global Infectious Disease Research announces new advisory board


COVID-19 vaccines: CDC says people ages 65 and up should get a shot this spring – a geriatrician explains why it’s vitally important


Mike Pompeo Doesn’t Rule Out Serving In 2nd Trump Administration
-

 Uncategorized3 weeks ago
All Of The Elements Are In Place For An Economic Crisis Of Staggering Proportions
-

 International1 week ago
EyePoint poaches medical chief from Apellis; Sandoz CFO, longtime BioNTech exec to retire
-

 Uncategorized4 weeks ago
California Counties Could Be Forced To Pay $300 Million To Cover COVID-Era Program
-

 Uncategorized3 weeks ago
Apparel Retailer Express Moving Toward Bankruptcy
-

 Uncategorized4 weeks ago
Industrial Production Decreased 0.1% in January
-

 International7 days ago
Walmart launches clever answer to Target’s new membership program
-

 Spread & Containment2 days ago
IFM’s Hat Trick and Reflections On Option-To-Buy M&A
-

 Uncategorized4 weeks ago
RFK Jr: The Wuhan Cover-Up & The Rise Of The Biowarfare-Industrial Complex