Inflation is running hot, and the Fed is projecting seven rate increases this year alone. As if that is not concerning enough for bond investors, the Fed…
Inflation is running hot, and the Fed is projecting seven rate increases this year alone. As if that is not concerning enough for bond investors, the Fed hints at draining liquidity via balance sheet reduction, i.e., Quantitative Tightening (QT).
At Jerome Powell’s post-March 16, 2022, FOMC press conference, he stated: “it’s clearly time to raise interest rates and begin the balance sheet shrinkage.” Based on further comments, Powell wants to start normalizing the Fed’s balance sheet and drain liquidity as early as May.
Since March of 2020, the Fed has bought about $3.5 trillion in U.S Treasury securities and $1.5 trillion in mortgage debt. The gush of liquidity from the Fed’s QE program helped the U.S. Treasury run massive pandemic-related deficits. Buying over half of the Treasury’s debt issuance in 2020 and 2021 limited the supply of bonds on the market and upward pressure on interest rates.
Equally important to the Fed, QE comforted investors in March of 2020 and further boosted many asset prices throughout its existence.
With QE finished and QT on the horizon, we answer a few questions to help you better appreciate what QT is, how it will operate, and discuss how the Fed draining liquidity will affect markets.
What are QE and QT?
Quantitative Easing (QE) is the process in which the Fed purchases Treasury and Mortgage bonds from banks. In exchange, the banks receive reserves from the Fed. These reserves are not cash but are the basis by which banks can lend money. All money is lent into existence. As such, there is an indirect connection between QE and money printing.
Via QE operations, the Fed removes assets from the markets. The supply reduction creates a supply-demand imbalance for the assets they buy and the entire pool of financial assets. As a result, QE tends to help most asset prices. For this reason, QE has become the Fed’s most important tool for fighting market instability and thereby boosting investor confidence.
For more on how QE supports asset prices, we suggest reading our article- The Fed is Juicing Stocks.
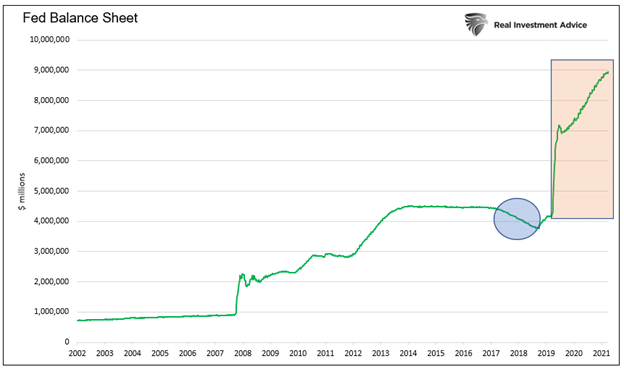
Quantitative Tightening (QT) is the opposite of QE. During QT, the Fed shrinks its balance sheet. QT has only been attempted once. In 2018, the Fed embarked on QT, as circled in the graph below. At the time, they ultimately reduced the balance sheet by $675 billion. Ironically, the liquidity drain forced the Fed to return to QE in 2019 as hedge funds ran into liquidity problems. QT exposed the fragility of our overleveraged financial system and its reliance upon easy money.
Perspective on QE 4
Before we progress, it’s worth providing perspective on how massive the pandemic round of QE (QE4) was compared to prior rounds of QE. Eric Parnell sums it up nicely:
For example, it took the Fed more than a year to deploy $300 billion in Treasury purchases as part of QE1. In response to COVID, the Fed purchased $300 billion in Treasuries in just three days.
It took the Fed nearly eight months to carry out $600 billion in Treasury purchases as part of QE2. During the COVID outbreak, the Fed made $600 billion in Treasury purchases in six days.
And it took the Fed 22 months to carry out $1.5 trillion in Treasury purchases as part of QE3, which until COVID was considered the epic QE program. But during COVID, they matched this $1.5 trillion in Treasury purchases in just over a month.
And then they continued gobbling up Treasuries at a rate of $80 billion per month, or nearly $1 trillion a year, for the next year and a half through late 2021 before FINALLY starting to wind the program down.
How Much QT Might The Fed Do?
The rectangle in the graph above highlights the massive $5 trillion increase in the Fed’s balance sheet over the last two years. With the Fed Funds rate now on the rise and inflation the number one enemy of the Fed, numerous Fed members have made it clear they want to normalize the Fed’s balance sheet.
Does “normalizing” mean they will reduce the $5 trillion they recently increased it by?
To help us guesstimate what normalization entails, we lean on Joseph Wang and his blog Fed Guy. Joseph was a senior trader on the Fed’s open market desk responsible for executing QE and QT. As such, he understands the mechanics of QE and QT better than just about anyone else.
“Chair Powell has sketched out the contours of the upcoming QT program through a series of appearances. He noted at a recent Congressional hearing that it may take around 3 years to normalize the Fed’s $9t balance sheet. The Fed estimates its “normalized” balance sheet based on its perception of the banking system’s demand for reserves. A conservative estimate based on the pre-pandemic Fed balance sheet size and taking into account growth in nominal GDP and currency, arrives at a normalized balance sheet of around $6t. This would imply QT at rate of ~$1t a year, roughly twice the annual pace of the prior QT.”
How Will They Do QT?
The Fed has two options to drain liquidity and reduce its balance sheet. It can let bonds mature. It can also sell bonds to the market.
The graph below shows that over half of the Fed’s bond holdings mature within four years. The preponderance of shorter maturity bonds allows the Fed to rely on maturation easily. Only 25% of the bonds mature in ten years or more. Also, note the x-axis is missing the years 2033-2035. This is because they do not hold any bonds with those maturities.
Despite many short, dated bonds, the Fed could instead select to sell bonds. Doing so would allow them to manage the yield curve. For instance, if they announced a program to replace all maturing issues with new short-term bonds and instead sell longer-term bonds to help them drain liquidity, longer maturity yields would rise and shorter maturity yields would fall.
Creating a steeper yield curve, as such an action might do, might be advantageous to banks that tend to lend long and borrow short. It would also help the government with lower borrowing rates. The Treasury relies heavily on shorter-term bonds to fund its deficits. As of the end of 2021, over half of the Treasury debt outstanding matures in three years or less.
The Fed is Limited What It Can Do
Some Fed watchers say the Fed may sell bonds and use QT to affect the yield curve. While we would put nothing past them, the limited number of longer-term bonds they have for sale makes any meaningful yield curve control unlikely.
We think they will avoid selling longer-term bonds. Yields have risen significantly over the past few months. With mortgage rates near 5% and corporate yields rising sharply, the fed will likely want to limit any additional economic harm higher rates will cause.
Can they solely rely on bond maturities to accomplish $1 trillion a year of QT?
The graph below compares a $1 trillion QT run rate ($83.33 bn per month) versus the Fed’s bond maturities for the remainder of 2022.
As we show, there are only two months, September, and October, in which the amount of bonds maturing is less than the $1 trillion run rate. In both cases, the differences are minimal. Also, note that the Fed will have to buy bonds in the remaining months.
For example, in April 2022, $150 billion in bonds will mature. If the Fed limits balance sheet reduction to $83 billion, they will have to buy about $67 billion in bonds.
In 2023, assuming they are still doing QT, there are five months in which they will need to sell bonds. The largest being $20 billion. That said, purchases in 2022 could easily cover those gaps by 2023.
What are the Consequences?
The most considerable effect of QT will likely be on Treasury supply and financial markets.
The graph below shows that if the Fed follows a $1 trillion per year QT path, the net supply of Treasury debt will be significant. The black line plots annual issuance. The orange line subtracts Fed purchases to arrive at a net issuance/supply amount. The net issuance (after Fed purchases) was about $1.5 trillion during the Pandemic. The Fed absorbed a large portion of the massive fiscal stimulus.
The red dotted line projects the net supply/issuance in the future. Assuming $1.75 trillion in annual borrowing and $1 trillion a year of QT, investors will have to absorb $2.75 trillion of Treasury bonds. That is well above the levels of 2020 and 2021 and nearly 3x the amount in the years before the Pandemic. On its own, such a jump in supply is a recipe for higher yields.
The Fed may want to normalize its balance sheet, but it may not be possible without causing problems in the Treasury market.
QT will also be problematic for many other asset markets. As discussed earlier, removing assets from the global asset pool helped increase asset prices. The extra bonds on the market via the Fed and new Treasury supply require draining liquidity from other assets to fund the U.S. Treasury. Just as QE helped asset prices, QT should equally hurt them.
Summary
The Fed attempted QT in 2018 in what is generally considered a failed attempt to normalize the balance sheet. As they learned, the markets are too overleveraged to drain enough liquidity to normalize the Fed’s balance sheet.
Today, the Fed has grander QT plans despite higher asset valuations than in 2018 and more financial leverage throughout the economy. The odds of the Fed fully normalizing the balance sheet by $3 trillion are slim to none. It is more likely the financial markets cry uncle, and the Fed comes to the rescue once again.
We’ve added 60% to national debt since 2018. Germany - a country with major economic woes - added ‘just’ 32%.
Maybe it will never matter. Maybe MMT is real. Maybe we just cancel or inflate it out. Maybe career real estate borrowers or career politicians aren’t the answer.
I have no idea. Only time will tell. But it’s going to be fascinating to watch it play out.
He is right: it will be fascinating, and the latest budget deficit data simply confirmed that the day of reckoning will come very soon, certainly sooner than the two years that One River's Eric Peters predicted this weekend for the coming "US debt sustainability crisis."
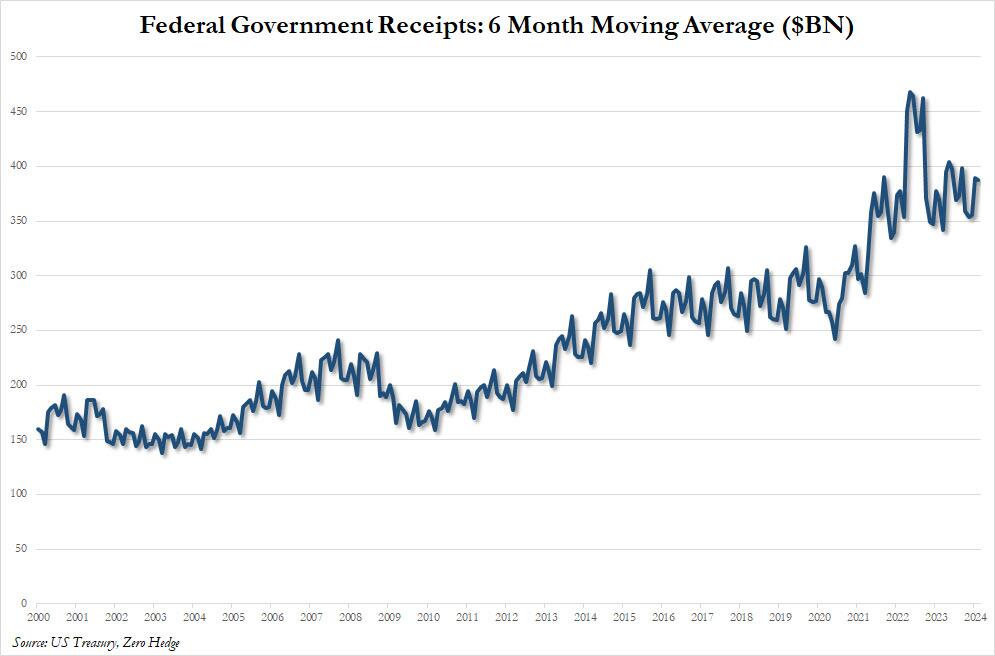
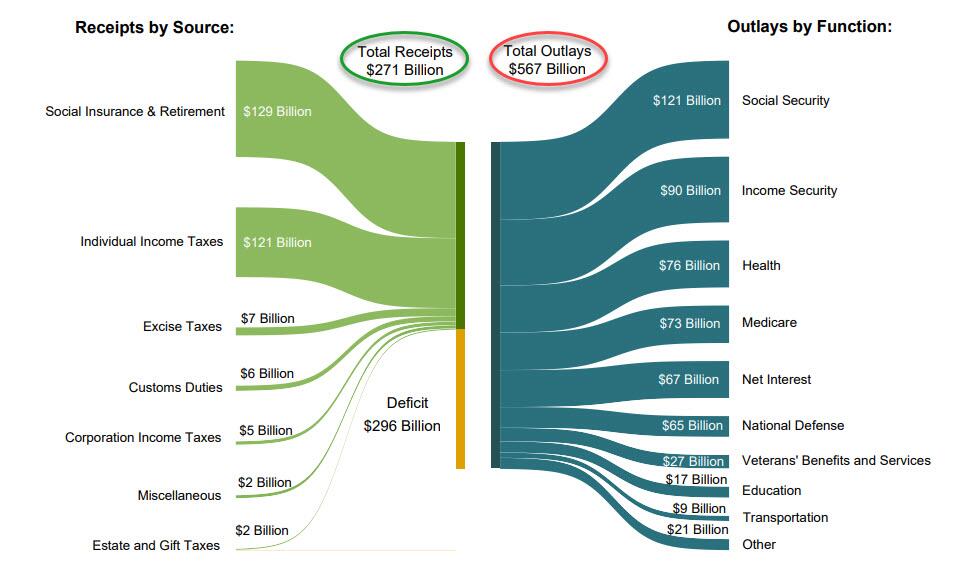
According to the US Treasury, in February, the US collected $271 billion in various tax receipts, and spent $567 billion, more than double what it collected.
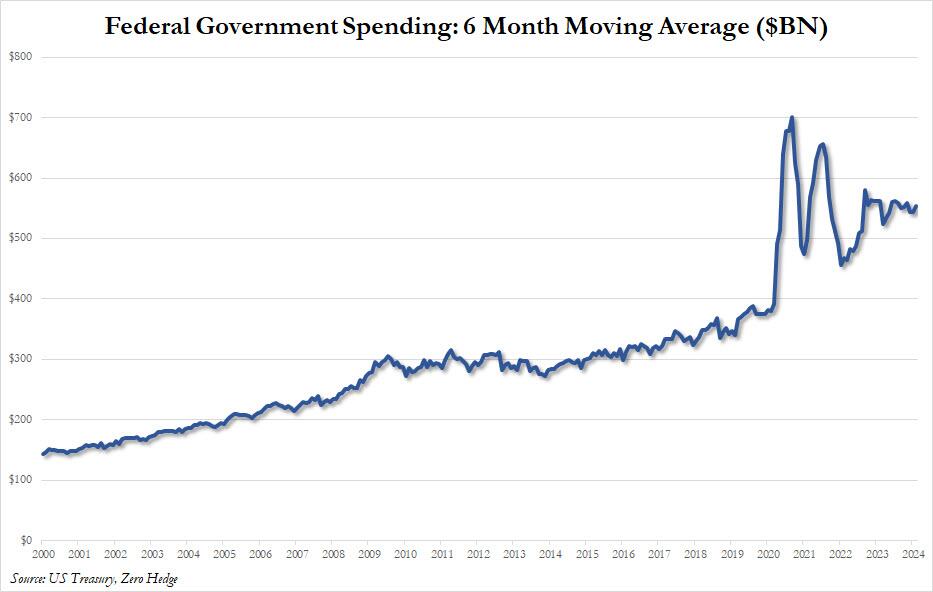
The two charts below show the divergence in US tax receipts which have flatlined (on a trailing 6M basis) since the covid pandemic in 2020 (with occasional stimmy-driven surges)...
... and spending which is about 50% higher compared to where it was in 2020.
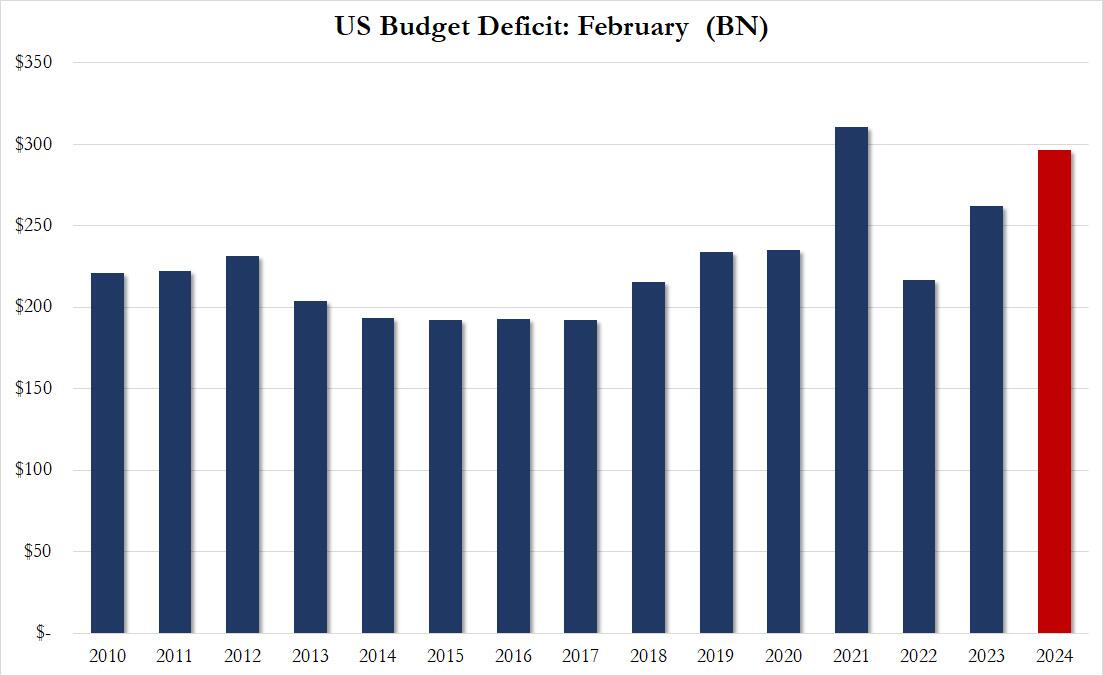
The end result is that in February, the budget deficit rose to $296.3 billion, up 12.9% from a year prior, and the second highest February deficit on record.
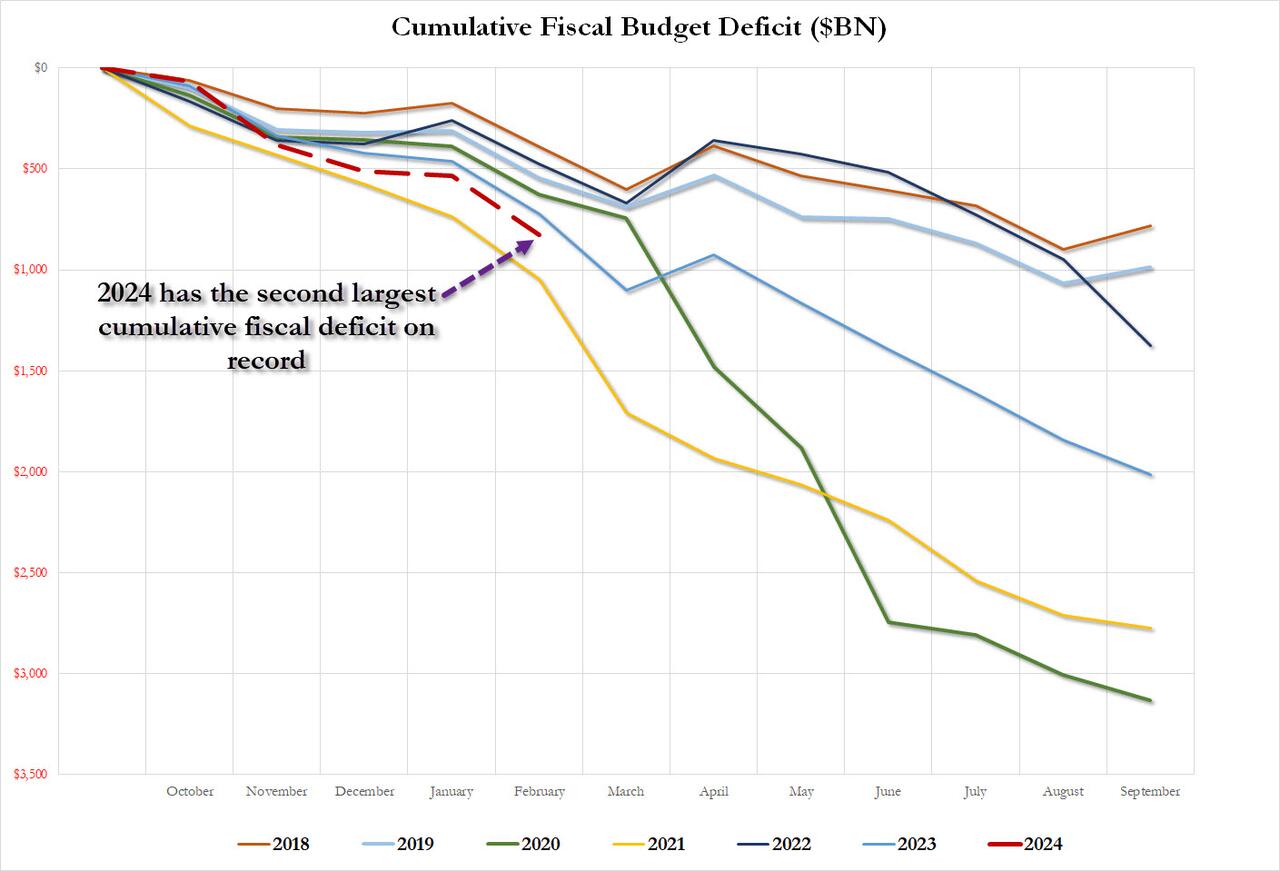
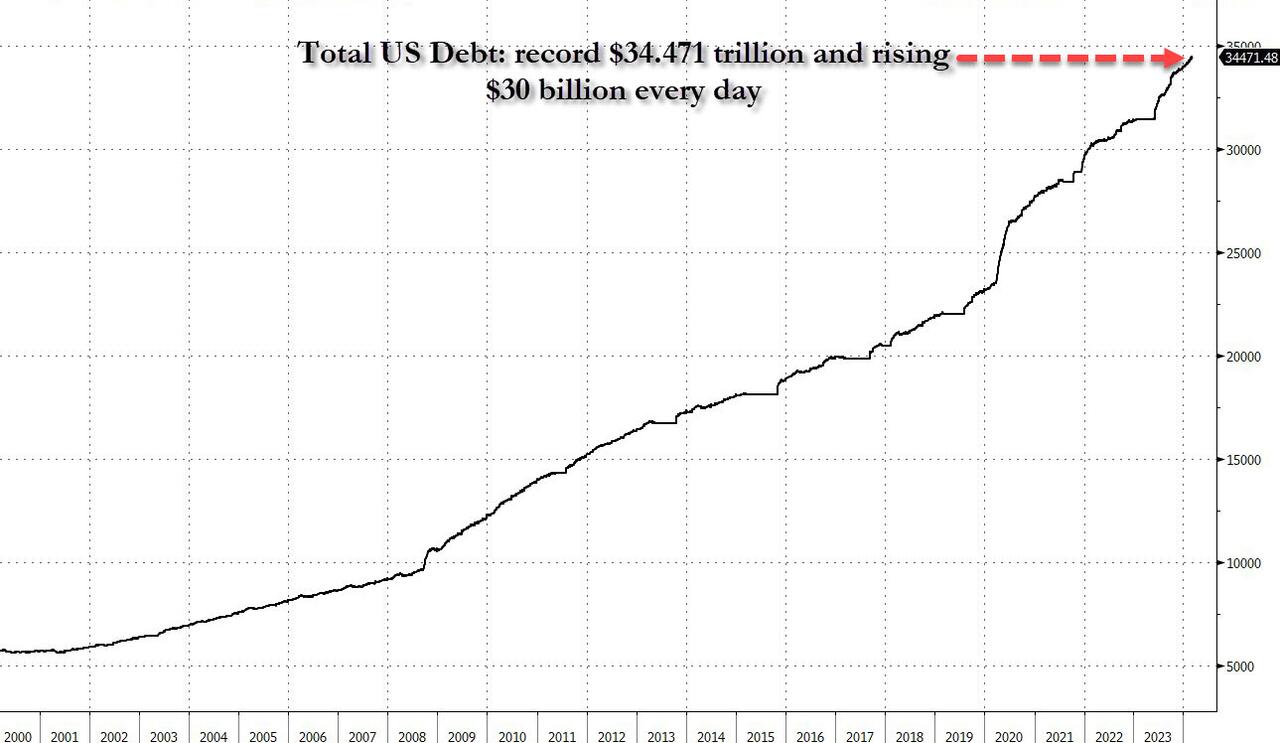
And the punchline: on a cumulative basis, the budget deficit in fiscal 2024 which began on October 1, 2023 is now $828 billion, the second largest cumulative deficit through February on record, surpassed only by the peak covid year of 2021.
But wait there's more: because in a world where the US is spending more than twice what it is collecting, the endgame is clear: debt collapse, and while it won't be tomorrow, or the week after, it is coming... and it's also why the US is now selling $1 trillion in debt every 100 days just to keep operating (and absorbing all those millions of illegal immigrants who will keep voting democrat to preserve the socialist system of the US, so beloved by the Soros clan).
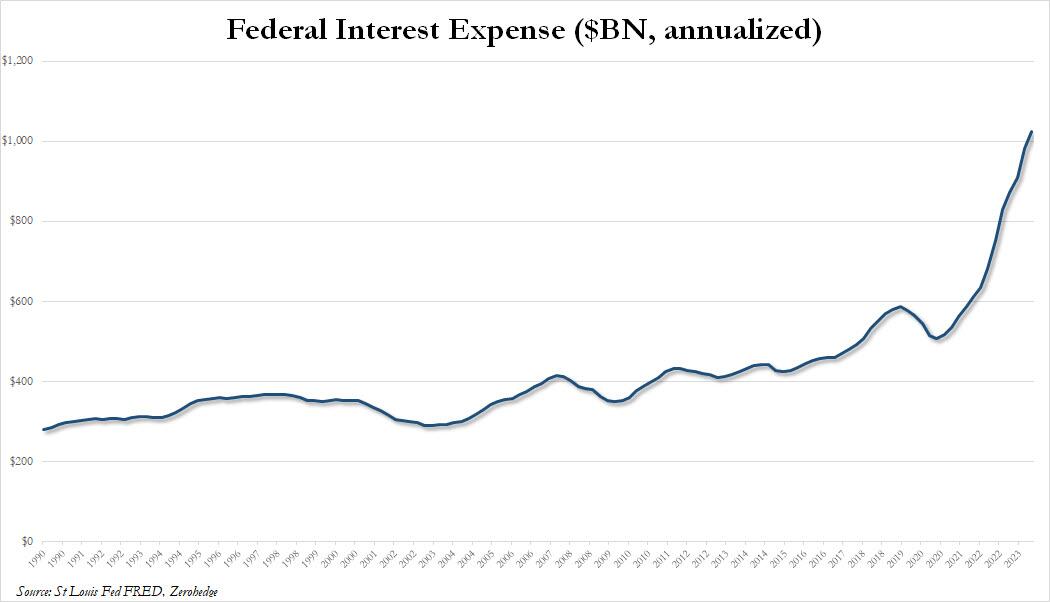
... having already surpassed total US defense spending and soon to surpass total health spending and, finally all social security spending, the largest spending category of all, which means that US debt will now rise exponentially higher until the inevitable moment when the US dollar loses its reserve status and it all comes crashing down.
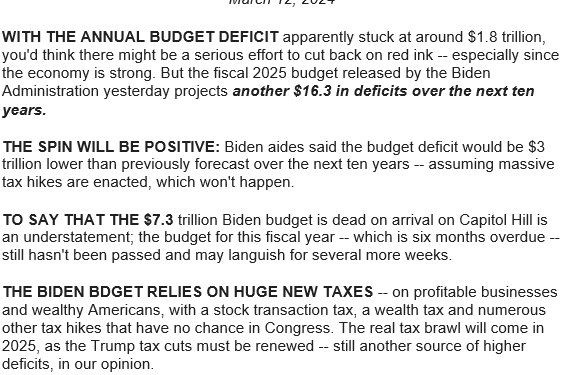
We conclude with another observation by CNBC's Brian Sullivan, who quotes an email by a DC strategist...
.. which lays out the proposed Biden budget as follows:
The budget deficit will growth another $16 TRILLION over next 10 years. Thats *with* the proposed massive tax hikes.
Without them the deficit will grow $19 trillion.
That's why you will hear the "deficit is being reduced by $3 trillion" over the decade.
No family budget or business could exist with this kind of math.
Of course, in the long run, neither can the US... and since neither party will ever cut the spending which everyone by now is so addicted to, the best anyone can do is start planning for the endgame.
Former Project Veritas & O’Keefe Media Group operative and Pfizer formulation analyst scientist Justin Leslie revealed previously unpublished recordings showing Pfizer’s top vaccine researchers discussing major concerns surrounding COVID-19 vaccines. Leslie delivered these recordings to Veritas in late 2021, but they were never published:
Principal scientist at Pfizer, Kanwall Gill in 2021:
“We had no idea how it’s going to look like. MRNA vaccines have been there for 50 years, but nothing went to clinical trial because MRNA have been known to have side effects.”
Featured in Leslie’s footage is Kanwal Gill, a principal scientist at Pfizer. Gill was weary of MRNA technology given its long research history yet lack of approved commercial products. She called the vaccines “sneaky,” suggesting latent side effects could emerge in time.
Gill goes on to illustrate how the vaccine formulation process was dramatically rushed under the FDA’s Emergency Use Authorization and adds that profit incentives likely played a role:
Pfizer's principal scientist in 2021:
“It takes 10 year for a vaccine to come out. It takes years of observations... we are doing everything at the same time."
"It’s going to affect my heart, and I’m going to die. And nobody’s talking about that."
Leslie recorded another colleague, Pfizer’s pharmaceutical formulation scientist Ramin Darvari, who raised the since-validated concern that repeat booster intake could damage the cardiovascular system:
Pfizer's pharmaceutical formulation scientist, Ramin Darvari, in 2021:
“They’re engineering it specifically for me to take the next one, so increasing my consumption."
“It’s going to affect my heart, and I’m going to die. And nobody’s talking about that.”
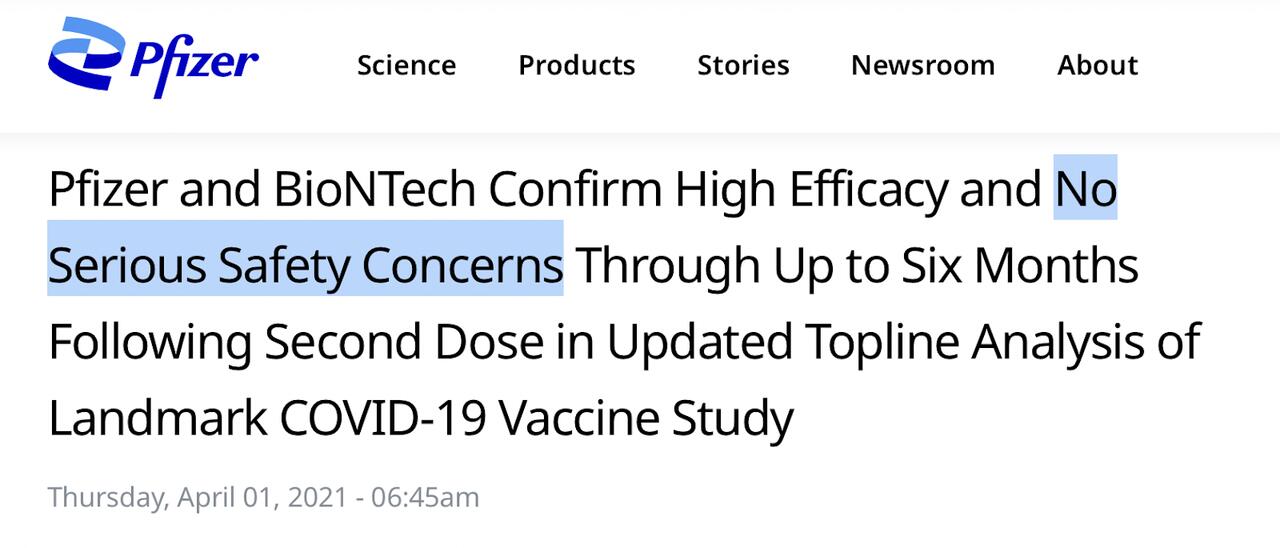
None of these claims will be shocking to hear in 2024, but it is telling that high-level Pfizer researchers were discussing these topics in private while the company assured the public of “no serious safety concerns” upon the jab’s release:
Vaccine for Children is a Different Formulation
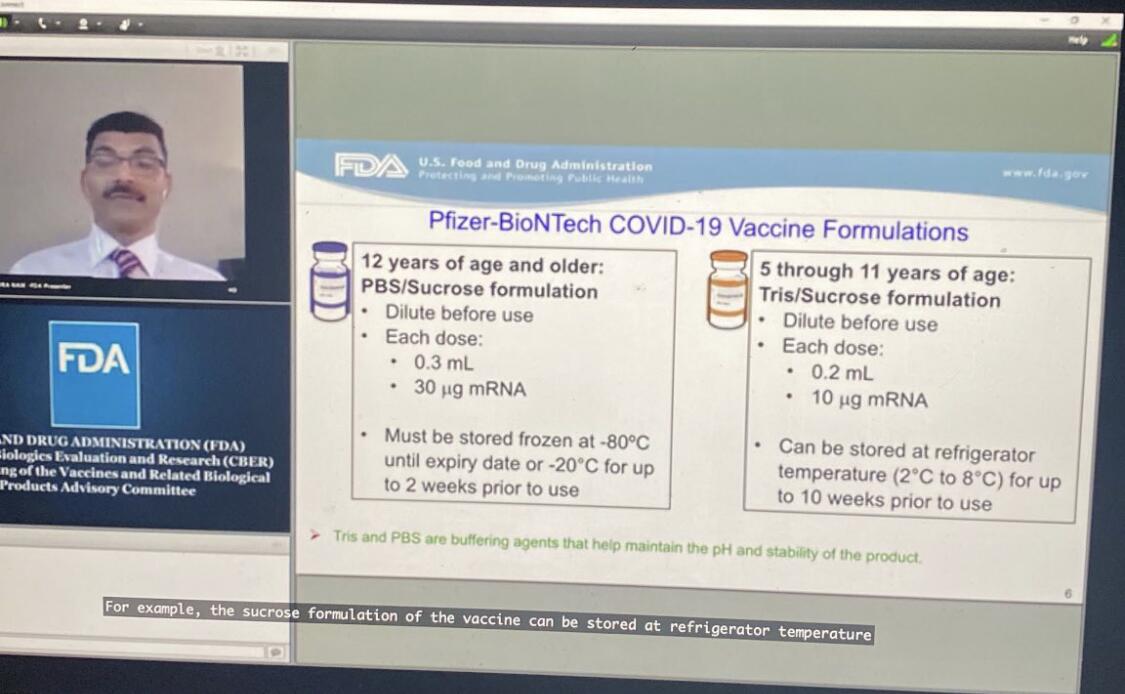
Leslie sent me a little-known FDA-Pfizer conference — a 7-hour Zoom meeting published in tandem with the approval of the vaccine for 5 – 11 year-olds — during which Pfizer’s vice presidents of vaccine research and development, Nicholas Warne and William Gruber, discussed a last-minute change to the vaccine’s “buffer” — from “PBS” to “Tris” — to improve its shelf life. For about 30 seconds of these 7 hours, Gruber acknowledged that the new formula was NOT the one used in clinical trials (emphasis mine):
“The studies were done using the same volume… but contained the PBS buffer. We obviously had extensive consultations with the FDA and it was determined that the clinical studies were not required because, again, the LNP and the MRNA are the same and the behavior — in terms of reactogenicity and efficacy — are expected to be the same.”
According to Leslie, the tweaked “buffer” dramatically changed the temperature needed for storage: “Before they changed this last step of the formulation, the formula was to be kept at -80 degrees Celsius. After they changed the last step, we kept them at 2 to 8 degrees celsius,” Leslie told me.
The claims are backed up in the referenced video presentation:
I’m no vaccinologist but an 80-degree temperature delta — and a 5x shelf-life in a warmer climate — seems like a significant change that might warrant clinical trials before commercial release.
Despite this information technically being public, there has been virtually no media scrutiny or even coverage — and in fact, most were told the vaccine for children was the same formula but just a smaller dose — which is perhaps due to a combination of the information being buried within a 7-hour jargon-filled presentation and our media being totally dysfunctional.
Bohemian Grove?
Leslie’s 2-hour long documentary on his experience at both Pfizer and O’Keefe’s companies concludes on an interesting note: James O’Keefe attended an outing at the Bohemian Grove.
Leslie offers this photo of James’ Bohemian Grove “GATE” slip as evidence, left on his work desk atop a copy of his book, “American Muckraker”:
My thoughts on the Bohemian Grove: my good friend’s dad was its general manager for several decades. From what I have gathered through that connection, the Bohemian Grove is not some version of the Illuminati, at least not in the institutional sense.
Do powerful elites hangout there? Absolutely. Do they discuss their plans for the world while hanging out there? I’m sure it has happened. Do they have a weird ritual with a giant owl? Yep, Alex Jones showed that to the world.
My perspective is based on conversations with my friend and my belief that his father is not lying to him. I could be wrong and am open to evidence — like if boxer Ryan Garcia decides to produce evidence regarding his rape claims — and I do find it a bit strange the club would invite O’Keefe who is notorious for covertly filming, but Occam’s razor would lead me to believe the club is — as it was under my friend’s dad — run by boomer conservatives the extent of whose politics include disliking wokeness, immigration, and Biden (common subjects of O’Keefe’s work).
Therefore, I don’t find O’Keefe’s visit to the club indicative that he is some sort of Operation Mockingbird asset as Leslie tries to depict (however Mockingbird is a 100% legitimate conspiracy). I have also met James several times and even came close to joining OMG. While I disagreed with James on the significance of many of his stories — finding some to be overhyped and showy — I never doubted his conviction in them.
As for why Leslie’s story was squashed… all my sources told me it was to avoid jail time for Veritas executives.
Feel free to watch Leslie’s full documentary here and decide for yourself.
Fun fact — Justin Leslie was also the operative behind this mega-viral Project Veritas story where Pfizer’s director of R&D claimed the company was privately mutating COVID-19 behind closed doors:
BREAKING: @Pfizer Exploring "Mutating" COVID-19 Virus For New Vaccines
"Don't tell anyone this...There is a risk...have to be very controlled to make sure this virus you mutate doesn't create something...the way that the virus started in Wuhan, to be honest."#DirectedEvolutionpic.twitter.com/xaRvlD5qTo
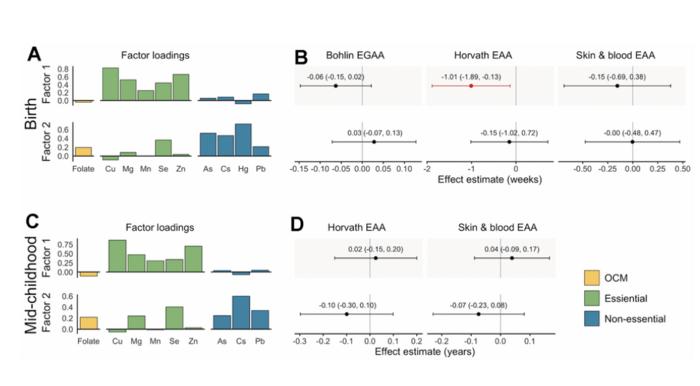
“[…] our findings support the hypothesis that the intrauterine environment, particularly essential and non-essential metals, affect epigenetic aging biomarkers across the life course.”
Credit: 2024 Bozack et al.
“[…] our findings support the hypothesis that the intrauterine environment, particularly essential and non-essential metals, affect epigenetic aging biomarkers across the life course.”
BUFFALO, NY- March 12, 2024 – A new research paper was published inAging (listed by MEDLINE/PubMed as “Aging (Albany NY)” and “Aging-US” by Web of Science) Volume 16, Issue 4, entitled, “Associations of prenatal one-carbon metabolism nutrients and metals with epigenetic aging biomarkers at birth and in childhood in a US cohort.”
Epigenetic gestational age acceleration (EGAA) at birth and epigenetic age acceleration (EAA) in childhood may be biomarkers of the intrauterine environment. In this new study, researchers Anne K. Bozack, Sheryl L. Rifas-Shiman, Andrea A. Baccarelli, Robert O. Wright, Diane R. Gold, Emily Oken, Marie-France Hivert, and Andres Cardenas from Stanford University School of Medicine, Harvard Medical School, Harvard T.H. Chan School of Public Health, Columbia University, and Icahn School of Medicine at Mount Sinai investigated the extent to which first-trimester folate, B12, 5 essential and 7 non-essential metals in maternal circulation are associated with EGAA and EAA in early life.
“[…] we hypothesized that OCM [one-carbon metabolism] nutrients and essential metals would be positively associated with EGAA and non-essential metals would be negatively associated with EGAA. We also investigated nonlinear associations and associations with mixtures of micronutrients and metals.”
Bohlin EGAA and Horvath pan-tissue and skin and blood EAA were calculated using DNA methylation measured in cord blood (N=351) and mid-childhood blood (N=326; median age = 7.7 years) in the Project Viva pre-birth cohort. A one standard deviation increase in individual essential metals (copper, manganese, and zinc) was associated with 0.94-1.2 weeks lower Horvath EAA at birth, and patterns of exposures identified by exploratory factor analysis suggested that a common source of essential metals was associated with Horvath EAA. The researchers also observed evidence of nonlinear associations of zinc with Bohlin EGAA, magnesium and lead with Horvath EAA, and cesium with skin and blood EAA at birth. Overall, associations at birth did not persist in mid-childhood; however, arsenic was associated with greater EAA at birth and in childhood.
“Prenatal metals, including essential metals and arsenic, are associated with epigenetic aging in early life, which might be associated with future health.”
Read the full paper: DOI:https://doi.org/10.18632/aging.205602
Corresponding Author: Andres Cardenas
Corresponding Email:andres.cardenas@stanford.edu
Keywords: epigenetic age acceleration, metals, folate, B12, prenatal exposures
Click here to sign up for free Altmetric alerts about this article.
About Aging:
Launched in 2009, Aging publishes papers of general interest and biological significance in all fields of aging research and age-related diseases, including cancer—and now, with a special focus on COVID-19 vulnerability as an age-dependent syndrome. Topics in Aging go beyond traditional gerontology, including, but not limited to, cellular and molecular biology, human age-related diseases, pathology in model organisms, signal transduction pathways (e.g., p53, sirtuins, and PI-3K/AKT/mTOR, among others), and approaches to modulating these signaling pathways.
Please visit our website at www.Aging-US.com and connect with us:
We use cookies on our website to give you the most relevant experience by remembering your preferences and repeat visits. By clicking “Accept”, you consent to the use of ALL the cookies.
This website uses cookies to improve your experience while you navigate through the website. Out of these, the cookies that are categorized as necessary are stored on your browser as they are essential for the working of basic functionalities of the website. We also use third-party cookies that help us analyze and understand how you use this website. These cookies will be stored in your browser only with your consent. You also have the option to opt-out of these cookies. But opting out of some of these cookies may affect your browsing experience.
Necessary cookies are absolutely essential for the website to function properly. These cookies ensure basic functionalities and security features of the website, anonymously.
Cookie
Duration
Description
cookielawinfo-checbox-analytics
11 months
This cookie is set by GDPR Cookie Consent plugin. The cookie is used to store the user consent for the cookies in the category "Analytics".
cookielawinfo-checbox-functional
11 months
The cookie is set by GDPR cookie consent to record the user consent for the cookies in the category "Functional".
cookielawinfo-checbox-others
11 months
This cookie is set by GDPR Cookie Consent plugin. The cookie is used to store the user consent for the cookies in the category "Other.
cookielawinfo-checkbox-necessary
11 months
This cookie is set by GDPR Cookie Consent plugin. The cookies is used to store the user consent for the cookies in the category "Necessary".
cookielawinfo-checkbox-performance
11 months
This cookie is set by GDPR Cookie Consent plugin. The cookie is used to store the user consent for the cookies in the category "Performance".
viewed_cookie_policy
11 months
The cookie is set by the GDPR Cookie Consent plugin and is used to store whether or not user has consented to the use of cookies. It does not store any personal data.
Functional cookies help to perform certain functionalities like sharing the content of the website on social media platforms, collect feedbacks, and other third-party features.
Performance cookies are used to understand and analyze the key performance indexes of the website which helps in delivering a better user experience for the visitors.
Analytical cookies are used to understand how visitors interact with the website. These cookies help provide information on metrics the number of visitors, bounce rate, traffic source, etc.
Advertisement cookies are used to provide visitors with relevant ads and marketing campaigns. These cookies track visitors across websites and collect information to provide customized ads.


