FDA Admits PCR Tests Give False Results, Prepares Ground For Biden To “Crush” Casedemic
FDA Admits PCR Tests Give False Results, Prepares Ground For Biden To "Crush" Casedemic
The FDA today joined The WHO and Dr.Fauci in admitting there is a notable risk of false results from the standard PCR-Test used to define whether an indiv
FDA Admits PCR Tests Give False Results, Prepares Ground For Biden To "Crush" Casedemic
The FDA today joined The WHO and Dr.Fauci in admitting there is a notable risk of false results from the standard PCR-Test used to define whether an individual is a COVID "Case" or not.
This matters significantly as it fits perfectly with the 'fake rescue' plan we have previously described would occur once the Biden admin took office. But before we get to that 'conspiracy', we need a little background on how the world got here...
We have detailed the controversy surrounding America's COVID "casedemic" and the misleading results of the PCR test and its amplification procedure in great detail over the past few months.
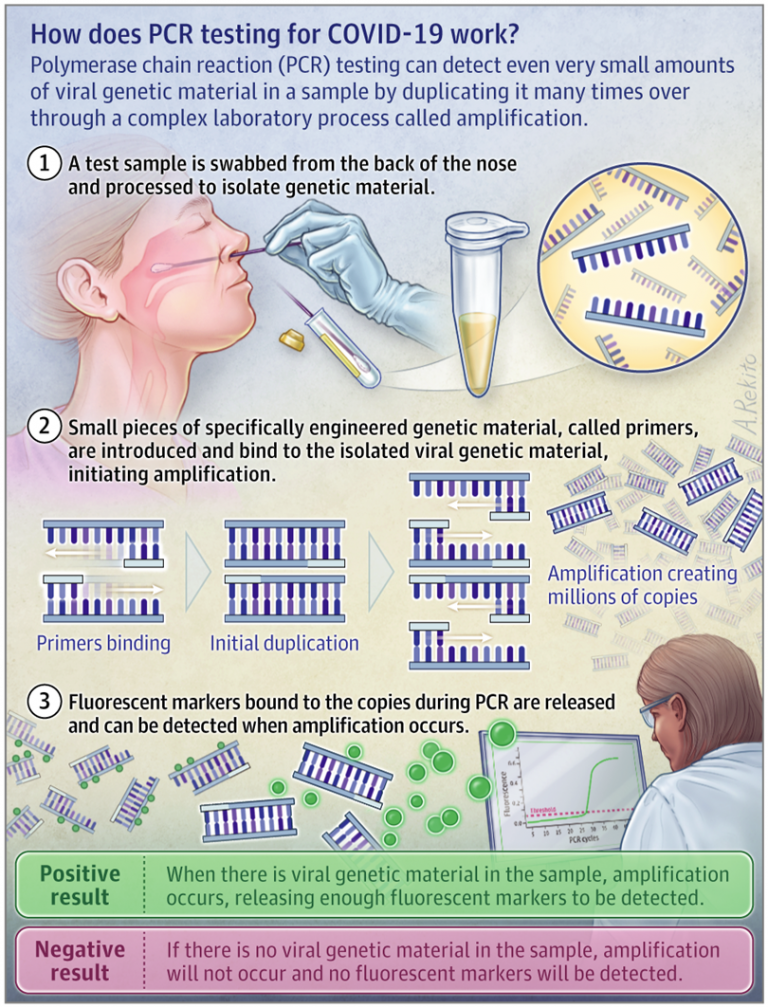
As a reminder, "cycle thresholds" (Ct) are the level at which widely used polymerase chain reaction (PCR) test can detect a sample of the COVID-19 virus. The higher the number of cycles, the lower the amount of viral load in the sample; the lower the cycles, the more prevalent the virus was in the original sample.
Numerous epidemiological experts have argued that cycle thresholds are an important metric by which patients, the public, and policymakers can make more informed decisions about how infectious and/or sick an individual with a positive COVID-19 test might be. However, as JustTheNews reports,health departments across the country are failing to collect that data.
Here are a few headlines from those experts and scientific studies:
2. The Wadworth Center, a New York State laboratory, analyzed the results of its July tests at the request of the NYT: 794 positive tests with a Ct of 40: “With a Ct threshold of 35, approximately half of these PCR tests would no longer be considered positive,” said the NYT.“And about 70% would no longer be considered positive with a Ct of 30! “
4. A new study from the Infectious Diseases Society of America, found that at 25 cycles of amplification, 70% of PCR test "positives" are not "cases" since the virus cannot be cultured, it's dead. And by 35: 97% of the positives are non-clinical.
5. PCR is not testing for disease, it's testing for a specific RNA pattern and this is the key pivot. When you crank it up to 25, 70% of the positive results are not really "positives" in any clinical sense, since it cannot make you or anyone else sick
So, in summary, with regard to our current "casedemic", positive tests as they are counted today do not indicate a “case” of anything. They indicate that viral RNA was found in a nasal swab. It may be enough to make you sick, but according to the New York Times and their experts, probably won’t. And certainly not sufficient replication of the virus to make anyone else sick. But you will be sent home for ten days anyway, even if you never have a sniffle. And this is the number the media breathlessly reports... and is used to fearmonger mask mandates and lockdowns nationwide...
In October we first exposed how PCR Tests have misled officials worldwide into insanely authoritative reactions.
As PJMedia's Stacey Lennox wrote, the “casedemic" is the elevated number of cases we see nationwide because of a flaw in the PCR test. The number of times the sample is amplified, also called the cycle threshold (Ct), is too high.
It identifies people who do not have a viral load capable of making them ill or transmitting the disease to someone else as positive for COVID-19.
The New York Times reported this flaw on August 29 and said that in the samples they reviewed from three states where labs use a Ct of 37-40, up to 90% of tests are essentially false positives. The experts in that article said a Ct of around 30 would be more appropriate for indicating that someone could be contagious - those for whom contact tracing would make sense.
Just a few days earlier, the CDC had updated its guidelines to discourage testing for asymptomatic individuals. It can only be assumed that the rationale for this was that some honest bureaucrat figured out the testing was needlessly sensitive. He or she has probably been demoted.
This change was preceded by a July update that discouraged retesting for recovered patients. The rationale for the update was that viral debris could be detected using the PCR test for 90 days after recovery. The same would be true for some period of time if an individual had an effective immune response and never got sick. Existing immunity from exposure to other coronaviruses has been well documented. These are many of your “asymptomatic” cases.
However, due to political pressure and corporate media tantrums, the new guidance on testing was scrapped, and testing for asymptomatic individuals is now recommended again. Doctors do not receive the Ct information from the labs to make a diagnostic judgment. Neither the CDC nor the FDA has put out guidelines for an accurate Ct to diagnose a contagious illness accurately.
Hence, our current “casedemic.” Positive tests as they are counted today do not indicate a “case” of anything. They indicate that viral RNA was found in a nasal swab. It may be enough to make you sick, but according to the New York Times and their experts, probably won’t. And certainly not sufficient replication of the virus to make anyone else sick. But you will be sent home for ten days anyway, even if you never have a sniffle. And this is the number the media breathlessly reports.
A month later, Dr. Pascal Sacré, explained in great detail how all current propaganda on the COVID-19 pandemic is based on an assumption that is considered obvious, true and no longer questioned: Positive RT-PCR test means being sick with COVID.
This assumption is misleading. Very few people, including doctors, understand how a PCR test works.
In mid-November, none other than he who should not be questioned - Dr. Anthony Fauci - admitted that the PCR Test's high Ct is misleading:
“What is now sort of evolving into a bit of a standard,” Fauci said, is that “if you get a cycle threshold of 35 or more … the chances of it being replication-confident are minuscule.”
“It’s very frustrating for the patients as well as for the physicians,” he continued, when “somebody comes in, and they repeat their PCR, and it’s like [a] 37 cycle threshold, but you almost never can culture virus from a 37 threshold cycle.”
So, I think if somebody does come in with 37, 38, even 36, you got to say, you know, it’s just dead nucleotides, period.”
So, if anyone raises this discussion as a "conspiracy", refer them to Dr.Fauci.
In response to this and the actual "science", Florida's Department of Health (and signed off on by Florida's Republican Governor Ron deSantis), decided that for the first time in the history of the pandemic, a state will require that all labs in the state report the critical “cycle threshold” level of every COVID-19 test they perform.
The U.S. Food and Drug Administration (FDA) is alerting patients and health care providers of the risk of false results... with the Curative SARS-Cov-2 test.
And why does this matter?
Well it's simple - this is how the establishment can show Joe Biden's plan is miraculously rescue the world.
Biden will issue national standards, like the plexiglass barriers in restaurants he spoke about during the debate, and pressure governors to implement mask mandates using the federal government’s financial leverage (NOTE: his 100-day mask-wearing 'mandate' is already in play).
Some hack at the CDC or FDA will issue new guidance lowering the Ct the labs use, and cases will magically start to fall.
In reality, the change will only eliminate false positives, but most Americans won’t know that.
Good old Uncle Joe will be the hero, even though it is Deep-State actors in the health bureaucracies who won’t solve a problem with testing they have been aware of for months. TDS is a heck of a drug.
So, there you have it folks... First Fauci, then WHO, now FDA all admit there is malarkey in the PCR Tests, but have - until now, done nothing about it... allowing the daily fearmongering of soaring "cases" to enable their most twisted 1984-esque controls.
All that's needed now is for one of these estemeed groups to decide to cut the Ct for a "positive" PCR Test to say 15x or 20x and suddenly, we are rescued from the "Dark Winter" as Biden's plan slashes the positive case count dramatically... we are saved.
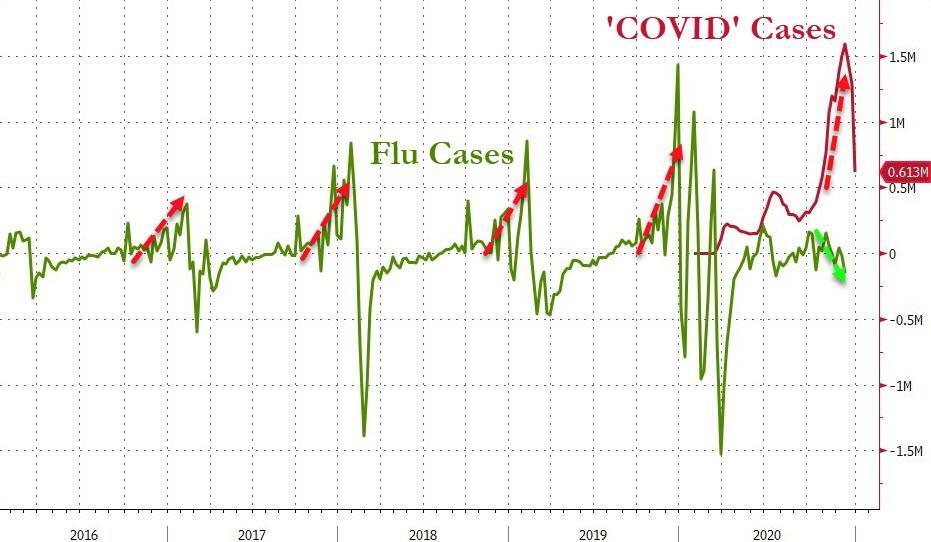
As an aside, this also clearly explains the disappearance of the "flu" during this season as the plethora of high Ct PCR Tests supposedly pointing to a surge in COVID are nothing of the sort.
As Stephen Lendman noted previously, claiming “lockdowns stopped flu in its tracks, (outbreaks) plummet(ting) by 98% in the United States” ignored that what’s called COVID is merely seasonal influenza combined with false positives (extremely high Ct) from PCR-Tests.
And for that reason, the great 2020 disappearing flu passes largely under the mass media’s radar. Media proliferated mass deception and power of repetition get most people to believe and having successfully "killed the flu", they will now do the same with COVID... and, if allowed by our betters, we will all return to the new normal they desire.
BUFFALO, NY- March 11, 2024 – Impact Journals publishes scholarly journals in the biomedical sciences with a focus on all areas of cancer and aging research. Aging is one of the most prominent journals published by Impact Journals.
Credit: Impact Journals
BUFFALO, NY- March 11, 2024 – Impact Journals publishes scholarly journals in the biomedical sciences with a focus on all areas of cancer and aging research. Aging is one of the most prominent journals published by Impact Journals.
Impact Journals will be participating as an exhibitor at the American Association for Cancer Research (AACR) Annual Meeting 2024 from April 5-10 at the San Diego Convention Center in San Diego, California. This year, the AACR meeting theme is “Inspiring Science • Fueling Progress • Revolutionizing Care.”
Visit booth #4159 at the AACR Annual Meeting 2024 to connect with members of the Agingteam.
About Aging-US:
Agingpublishes research papers in all fields of aging research including but not limited, aging from yeast to mammals, cellular senescence, age-related diseases such as cancer and Alzheimer’s diseases and their prevention and treatment, anti-aging strategies and drug development and especially the role of signal transduction pathways such as mTOR in aging and potential approaches to modulate these signaling pathways to extend lifespan. The journal aims to promote treatment of age-related diseases by slowing down aging, validation of anti-aging drugs by treating age-related diseases, prevention of cancer by inhibiting aging. Cancer and COVID-19 are age-related diseases.
Agingis indexed and archived byPubMed/Medline (abbreviated as “Aging (Albany NY)”), PubMed Central, Web of Science: Science Citation Index Expanded (abbreviated as “Aging‐US” and listed in the Cell Biology and Geriatrics & Gerontology categories), Scopus (abbreviated as “Aging” and listed in the Cell Biology and Aging categories), Biological Abstracts, BIOSIS Previews, EMBASE, META (Chan Zuckerberg Initiative) (2018-2022), and Dimensions (Digital Science).
Please visit our website at www.Aging-US.com and connect with us:
NY Fed Finds Medium, Long-Term Inflation Expectations Jump Amid Surge In Stock Market Optimism
One month after the inflation outlook tracked by the NY Fed Consumer Survey extended their late 2023 slide, with 3Y inflation expectations in January sliding to a record low 2.4% (from 2.6% in December), even as 1 and 5Y inflation forecasts remained flat, moments ago the NY Fed reported that in February there was a sharp rebound in longer-term inflation expectations, rising to 2.7% from 2.4% at the three-year ahead horizon, and jumping to 2.9% from 2.5% at the five-year ahead horizon, while the 1Y inflation outlook was flat for the 3rd month in a row, stuck at 3.0%.
The increases in both the three-year ahead and five-year ahead measures were most pronounced for respondents with at most high school degrees (in other words, the "really smart folks" are expecting deflation soon). The survey’s measure of disagreement across respondents (the difference between the 75th and 25th percentile of inflation expectations) decreased at all horizons, while the median inflation uncertainty—or the uncertainty expressed regarding future inflation outcomes—declined at the one- and three-year ahead horizons and remained unchanged at the five-year ahead horizon.
Going down the survey, we find that the median year-ahead expected price changes increased by 0.1 percentage point to 4.3% for gas; decreased by 1.8 percentage points to 6.8% for the cost of medical care (its lowest reading since September 2020); decreased by 0.1 percentage point to 5.8% for the cost of a college education; and surprisingly decreased by 0.3 percentage point for rent to 6.1% (its lowest reading since December 2020), and remained flat for food at 4.9%.
We find the rent expectations surprising because it is happening just asking rents are rising across the country.
At the same time as consumers erroneously saw sharply lower rents, median home price growth expectations remained unchanged for the fifth consecutive month at 3.0%.
Turning to the labor market, the survey found that the average perceived likelihood of voluntary and involuntary job separations increased, while the perceived likelihood of finding a job (in the event of a job loss) declined. "The mean probability of leaving one’s job voluntarily in the next 12 months also increased, by 1.8 percentage points to 19.5%."
Mean unemployment expectations - or the mean probability that the U.S. unemployment rate will be higher one year from now - decreased by 1.1 percentage points to 36.1%, the lowest reading since February 2022. Additionally, the median one-year-ahead expected earnings growth was unchanged at 2.8%, remaining slightly below its 12-month trailing average of 2.9%.
Turning to household finance, we find the following:
The median expected growth in household income remained unchanged at 3.1%. The series has been moving within a narrow range of 2.9% to 3.3% since January 2023, and remains above the February 2020 pre-pandemic level of 2.7%.
Median household spending growth expectations increased by 0.2 percentage point to 5.2%. The increase was driven by respondents with a high school degree or less.
Median year-ahead expected growth in government debt increased to 9.3% from 8.9%.
The mean perceived probability that the average interest rate on saving accounts will be higher in 12 months increased by 0.6 percentage point to 26.1%, remaining below its 12-month trailing average of 30%.
Perceptions about households’ current financial situations deteriorated somewhat with fewer respondents reporting being better off than a year ago. Year-ahead expectations also deteriorated marginally with a smaller share of respondents expecting to be better off and a slightly larger share of respondents expecting to be worse off a year from now.
The mean perceived probability that U.S. stock prices will be higher 12 months from now increased by 1.4 percentage point to 38.9%.
At the same time, perceptions and expectations about credit access turned less optimistic: "Perceptions of credit access compared to a year ago deteriorated with a larger share of respondents reporting tighter conditions and a smaller share reporting looser conditions compared to a year ago."
Also, a smaller percentage of consumers, 11.45% vs 12.14% in prior month, expect to not be able to make minimum debt payment over the next three months
Last, and perhaps most humorous, is the now traditional cognitive dissonance one observes with these polls, because at a time when long-term inflation expectations jumped, which clearly suggests that financial conditions will need to be tightened, the number of respondents expecting higher stock prices one year from today jumped to the highest since November 2021... which incidentally is just when the market topped out during the last cycle before suffering a painful bear market.
Homes listed for sale in early June sell for $7,700 more
New Zillow research suggests the spring home shopping season may see a second wave this summer if mortgage rates fall
The post Homes listed for sale in…
A Zillow analysis of 2023 home sales finds homes listed in the first two weeks of June sold for 2.3% more.
The best time to list a home for sale is a month later than it was in 2019, likely driven by mortgage rates.
The best time to list can be as early as the second half of February in San Francisco, and as late as the first half of July in New York and Philadelphia.
Spring home sellers looking to maximize their sale price may want to wait it out and list their home for sale in the first half of June. A new Zillow® analysis of 2023 sales found that homes listed in the first two weeks of June sold for 2.3% more, a $7,700 boost on a typical U.S. home.
The best time to list consistently had been early May in the years leading up to the pandemic. The shift to June suggests mortgage rates are strongly influencing demand on top of the usual seasonality that brings buyers to the market in the spring. This home-shopping season is poised to follow a similar pattern as that in 2023, with the potential for a second wave if the Federal Reserve lowers interest rates midyear or later.
The 2.3% sale price premium registered last June followed the first spring in more than 15 years with mortgage rates over 6% on a 30-year fixed-rate loan. The high rates put home buyers on the back foot, and as rates continued upward through May, they were still reassessing and less likely to bid boldly. In June, however, rates pulled back a little from 6.79% to 6.67%, which likely presented an opportunity for determined buyers heading into summer. More buyers understood their market position and could afford to transact, boosting competition and sale prices.
The old logic was that sellers could earn a premium by listing in late spring, when search activity hit its peak. Now, with persistently low inventory, mortgage rate fluctuations make their own seasonality. First-time home buyers who are on the edge of qualifying for a home loan may dip in and out of the market, depending on what’s happening with rates. It is almost certain the Federal Reserve will push back any interest-rate cuts to mid-2024 at the earliest. If mortgage rates follow, that could bring another surge of buyers later this year.
Mortgage rates have been impacting affordability and sale prices since they began rising rapidly two years ago. In 2022, sellers nationwide saw the highest sale premium when they listed their home in late March, right before rates barreled past 5% and continued climbing.
Zillow’s research finds the best time to list can vary widely by metropolitan area. In 2023, it was as early as the second half of February in San Francisco, and as late as the first half of July in New York. Thirty of the top 35 largest metro areas saw for-sale listings command the highest sale prices between May and early July last year.
Zillow also found a wide range in the sale price premiums associated with homes listed during those peak periods. At the hottest time of the year in San Jose, homes sold for 5.5% more, a $88,000 boost on a typical home. Meanwhile, homes in San Antonio sold for 1.9% more during that same time period.
We use cookies on our website to give you the most relevant experience by remembering your preferences and repeat visits. By clicking “Accept”, you consent to the use of ALL the cookies.
This website uses cookies to improve your experience while you navigate through the website. Out of these, the cookies that are categorized as necessary are stored on your browser as they are essential for the working of basic functionalities of the website. We also use third-party cookies that help us analyze and understand how you use this website. These cookies will be stored in your browser only with your consent. You also have the option to opt-out of these cookies. But opting out of some of these cookies may affect your browsing experience.
Necessary cookies are absolutely essential for the website to function properly. These cookies ensure basic functionalities and security features of the website, anonymously.
Cookie
Duration
Description
cookielawinfo-checbox-analytics
11 months
This cookie is set by GDPR Cookie Consent plugin. The cookie is used to store the user consent for the cookies in the category "Analytics".
cookielawinfo-checbox-functional
11 months
The cookie is set by GDPR cookie consent to record the user consent for the cookies in the category "Functional".
cookielawinfo-checbox-others
11 months
This cookie is set by GDPR Cookie Consent plugin. The cookie is used to store the user consent for the cookies in the category "Other.
cookielawinfo-checkbox-necessary
11 months
This cookie is set by GDPR Cookie Consent plugin. The cookies is used to store the user consent for the cookies in the category "Necessary".
cookielawinfo-checkbox-performance
11 months
This cookie is set by GDPR Cookie Consent plugin. The cookie is used to store the user consent for the cookies in the category "Performance".
viewed_cookie_policy
11 months
The cookie is set by the GDPR Cookie Consent plugin and is used to store whether or not user has consented to the use of cookies. It does not store any personal data.
Functional cookies help to perform certain functionalities like sharing the content of the website on social media platforms, collect feedbacks, and other third-party features.
Performance cookies are used to understand and analyze the key performance indexes of the website which helps in delivering a better user experience for the visitors.
Analytical cookies are used to understand how visitors interact with the website. These cookies help provide information on metrics the number of visitors, bounce rate, traffic source, etc.
Advertisement cookies are used to provide visitors with relevant ads and marketing campaigns. These cookies track visitors across websites and collect information to provide customized ads.


