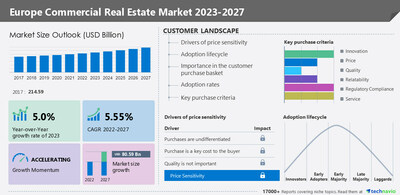
NEW YORK, Jan. 17, 2023 /PRNewswire/ -- According to Technavio, the Europe commercial real estate market size is estimated to grow by USD 80.59 billion from 2022 to 2027. The market is estimated to grow at a CAGR of 5.55% during the forecast period. Moreover, the growth momentum will accelerate.
For more insights on market size, request a sample report
Commercial real estate market in Europe - Five forces
The commercial real estate market in Europe is fragmented, and the five forces analysis covers –
- Bargaining power of buyers
- The threat of new entrants
- Threat of rivalry
- Bargaining power of suppliers
- Threat of substitutes
- For interpretation of Porter's five forces model – buy the report!
Commercial real estate market in Europe – Customer landscape
The report includes the market's adoption lifecycle, from the innovator's stage to the laggard's stage. It focuses on adoption rates in different regions based on penetration. Furthermore, the report also includes key purchase criteria and drivers of price sensitivity to help companies evaluate and develop their growth strategies.
Commercial real estate market in Europe - Segmentation assessment
Segment overview
Technavio has segmented the market based on end-user (offices, retail, leisure, and others) and type (rental, lease, and sales).
- The offices segment will grow at a significant rate during the forecast period. Office account for 35% of all new jobs created across the world, which will facilitate market growth during the forecast period. Moreover, the demand for office space is expected to increase with the economic expansion and the employment situation. Thus, the growth of the office sector is expected to fuel the demand for commercial real estate in Europe.
Download a sample report
Commercial real estate market in Europe – Market dynamics
Key factor driving market growth
- The growing aggregate private investment is driving the market growth.
- Aggregate private sector investment refers to the investment by individuals and firms in tangible assets such as land, commercial buildings, and commercial offices.
- Investments in business sectors such as land, offices, and other physical structures account for the largest share of total private investment.
- Most corporate investment is in hardware and software, with the rest spent on physical structures such as buildings, land, and business offices.
- Growing investments in industries have increased the demand for commercial real estate consulting services that help investors in planning strategies and investments.
- Thus, with growth in industrialization, a significant rise in the total investments of private companies is expected, which will fuel the growth of the commercial real estate market in Europe during the forecast period.
Leading trends influencing the market
- Increasing investments in the commercial real estate market in Europe is a key trend in the market.
- For instance, 23% of companies in Germany plan to increase investments.
- In the UK, 82% of investors plan to grow their international business
- In addition, in France, 64% of real estate experts intend to increase their international investments.
- Similarly, in Spain, 42% of investors intend to become more active internationally.
- These factors are expected to support market growth during the forecast period.
Major challenges hindering market growth
- Increasing interest rates are challenging the market growth.
- Some of the biggest lenders in Europe are dealing with the increasing defaults on commercial real estate.
- The demand for space in many commercial properties is expected to decrease, which could lower rents.
- Moreover, the recent sharp increase in interest rates in Europe is driving the cost of debt for landlords.
- A significant decline in commercial property values can violate the debt covenants included in bank leases, which could potentially lead lenders to foreclose on distressed properties.
- These factors will impede market growth during the forecast period.
Drivers, trends, and challenges have an impact on market dynamics, which can impact businesses. Find some insights from a sample report!
What are the key data covered in this Europe commercial real estate market report?
- CAGR of the market during the forecast period
- Detailed information on factors that will drive the growth of the commercial real estate market in Europe between 2023 and 2027
- Precise estimation of the size of the commercial real estate market in Europe and its contribution to the parent market
- Accurate predictions about upcoming trends and changes in consumer behavior
- A thorough analysis of the market's competitive landscape and detailed information about vendors
- Comprehensive analysis of factors that will challenge the growth of Europe commercial real estate market vendors
Gain instant access to 17,000+ market research reports.
Technavio's SUBSCRIPTION platform
Related Reports:
The residential real estate market is estimated to grow at a CAGR of 5.07% between 2022 and 2027. The size of the market is forecasted to increase by USD 514.41 billion. This report extensively covers market segmentation by mode of booking (sales and rental/lease), type (apartments, condominiums, landed houses, and villas), and geography (APAC, North America, Europe, South America, and Middle East and Africa).
The commercial real estate market is estimated to grow at a CAGR of 3.3% between 2022 and 2027. The size of the market is forecasted to increase by USD 260.37 billion. This report extensively covers market segmentation by end-user (offices, retail, leisure, and others) and geography (APAC, North America, Europe, Middle East and Africa, and South America).
Europe Commercial Real Estate Market Scope
|
Report Coverage
| Details
|
Page number
| 141
|
Base year
| 2022
|
Historic period
| 2017-2021
|
Forecast period
| 2023-2027
|
Growth momentum & CAGR
| Accelerate at a CAGR of 5.55%
|
Market growth 2023-2027
| USD 80.59 billion
|
Market structure
| Fragmented
|
YoY growth 2022-2023 (%)
| 5.0
|
Key countries
| Germany, UK, France, Italy, and Rest of Europe
|
Competitive landscape
| Leading vendors, market positioning of vendors, competitive strategies, and industry risks
|
Key companies profiled
| AG Real Estate, Aroundtown SA, Blackstone Inc., BNP Paribas, Covivio, CPI Property Group, Deutsche WohnenDeutsche Wohnen SE, Fastighets AB Baider, Futureal Management Szolgaltato Kft., HB Reavis Group, Jones Lang LaSalle IP, Inc., LEG Immobilien SE, Longfor Group Holdings Ltd., MITSUBISHI ESTATE Co., Ltd., REA group Ltd., Segro Plc, Skanska, STRABAG SE, Tishman Speyer, and Hines
|
Market dynamics
| Parent market analysis, market growth inducers and obstacles, fast-growing and slow-growing segment analysis, COVID-19 impact and recovery analysis and future consumer dynamics, and market condition analysis for the forecast period.
|
Customization purview
| If our report has not included the data that you are looking for, you can reach out to our analysts and get segments customized.
|
Customization purview
| If our report has not included the data that you are looking for, you can reach out to our analysts and get segments customized.
|
Browse for Technavio's consumer discretionary market reports
Table of contents
1 Executive Summary
- 1.1 Market overview
- Exhibit 01: Executive Summary – Chart on Market Overview
- Exhibit 02: Executive Summary – Data Table on Market Overview
- Exhibit 03: Executive Summary – Chart on Country Market Characteristics
- Exhibit 04: Executive Summary – Chart on Market by Geography
- Exhibit 05: Executive Summary – Chart on Market Segmentation by End-user
- Exhibit 06: Executive Summary – Chart on Market Segmentation by Type
- Exhibit 07: Executive Summary – Chart on Incremental Growth
- Exhibit 08: Executive Summary – Data Table on Incremental Growth
- Exhibit 09: Executive Summary – Chart on Vendor Market Positioning
2 Market Landscape
- 2.1 Market ecosystem
- Exhibit 10: Parent market
- Exhibit 11: Market Characteristics
3 Market Sizing
- 3.1 Market definition
- Exhibit 12: Offerings of vendors included in the market definition
- 3.2 Market segment analysis
- Exhibit 13: Market segments
- 3.4 Market outlook: Forecast for 2022-2027
- Exhibit 14: Chart on Europe - Market size and forecast 2022-2027 ($ billion)
- Exhibit 15: Data Table on Regional - Market size and forecast 2022-2027 ($ billion)
- Exhibit 16: Chart on Europe: Year-over-year growth 2022-2027 (%)
- Exhibit 17: Data Table on Regional - Market size and forecast 2022-2027 ($ billion)
4 Historic Market Size
- 4.1 Commercial real estate market in Europe 2017 - 2021
- Exhibit 18: Historic Market Size – Data Table on Commercial real estate market in Europe 2017 - 2021 ($ billion)
- 4.2 End-user Segment Analysis 2017 - 2021
- Exhibit 19: Historic Market Size – End-user Segment 2017 - 2021 ($ billion)
- 4.3 Type Segment Analysis 2017 - 2021
- Exhibit 20: Historic Market Size – Type Segment 2017 - 2021 ($ billion)
- 4.4 Geography Segment Analysis 2017 - 2021
- Exhibit 21: Historic Market Size – Geography Segment 2017 - 2021 ($ billion)
5 Five Forces Analysis
- 5.1 Five forces summary
- Exhibit 22: Five forces analysis - Comparison between 2022 and 2027
- 5.2 Bargaining power of buyers
- Exhibit 23: Chart on Bargaining power of buyers – Impact of key factors 2022 and 2027
- 5.3 Bargaining power of suppliers
- Exhibit 24: Bargaining power of suppliers – Impact of key factors in 2022 and 2027
- 5.4 Threat of new entrants
- Exhibit 25: Threat of new entrants – Impact of key factors in 2022 and 2027
- 5.5 Threat of substitutes
- Exhibit 26: Threat of substitutes – Impact of key factors in 2022 and 2027
- 5.6 Threat of rivalry
- Exhibit 27: Threat of rivalry – Impact of key factors in 2022 and 2027
- 5.7 Market condition
- Exhibit 28: Chart on Market condition - Five forces 2022 and 2027
6 Market Segmentation by End-user
- 6.1 Market segments
- Exhibit 29: Chart on End-user - Market share 2022-2027 (%)
- Exhibit 30: Data Table on End-user - Market share 2022-2027 (%)
- 6.2 Comparison by End-user
- Exhibit 31: Chart on Comparison by End-user
- Exhibit 32: Data Table on Comparison by End-user
- 6.3 Offices - Market size and forecast 2022-2027
- Exhibit 33: Chart on Offices - Market size and forecast 2022-2027 ($ billion)
- Exhibit 34: Data Table on Offices - Market size and forecast 2022-2027 ($ billion)
- Exhibit 35: Chart on Offices - Year-over-year growth 2022-2027 (%)
- Exhibit 36: Data Table on Offices - Year-over-year growth 2022-2027 (%)
- 6.4 Retail - Market size and forecast 2022-2027
- Exhibit 37: Chart on Retail - Market size and forecast 2022-2027 ($ billion)
- Exhibit 38: Data Table on Retail - Market size and forecast 2022-2027 ($ billion)
- Exhibit 39: Chart on Retail - Year-over-year growth 2022-2027 (%)
- Exhibit 40: Data Table on Retail - Year-over-year growth 2022-2027 (%)
- 6.5 Leisure - Market size and forecast 2022-2027
- Exhibit 41: Chart on Leisure - Market size and forecast 2022-2027 ($ billion)
- Exhibit 42: Data Table on Leisure - Market size and forecast 2022-2027 ($ billion)
- Exhibit 43: Chart on Leisure - Year-over-year growth 2022-2027 (%)
- Exhibit 44: Data Table on Leisure - Year-over-year growth 2022-2027 (%)
- 6.6 Others - Market size and forecast 2022-2027
- Exhibit 45: Chart on Others - Market size and forecast 2022-2027 ($ billion)
- Exhibit 46: Data Table on Others - Market size and forecast 2022-2027 ($ billion)
- Exhibit 47: Chart on Others - Year-over-year growth 2022-2027 (%)
- Exhibit 48: Data Table on Others - Year-over-year growth 2022-2027 (%)
- 6.7 Market opportunity by End-user
- Exhibit 49: Market opportunity by End-user ($ billion)
7 Market Segmentation by Type
- 7.1 Market segments
- Exhibit 50: Chart on Type - Market share 2022-2027 (%)
- Exhibit 51: Data Table on Type - Market share 2022-2027 (%)
- 7.2 Comparison by Type
- Exhibit 52: Chart on Comparison by Type
- Exhibit 53: Data Table on Comparison by Type
- 7.3 Rental - Market size and forecast 2022-2027
- Exhibit 54: Chart on Rental - Market size and forecast 2022-2027 ($ billion)
- Exhibit 55: Data Table on Rental - Market size and forecast 2022-2027 ($ billion)
- Exhibit 56: Chart on Rental - Year-over-year growth 2022-2027 (%)
- Exhibit 57: Data Table on Rental - Year-over-year growth 2022-2027 (%)
- 7.4 Lease - Market size and forecast 2022-2027
- Exhibit 58: Chart on Lease - Market size and forecast 2022-2027 ($ billion)
- Exhibit 59: Data Table on Lease - Market size and forecast 2022-2027 ($ billion)
- Exhibit 60: Chart on Lease - Year-over-year growth 2022-2027 (%)
- Exhibit 61: Data Table on Lease - Year-over-year growth 2022-2027 (%)
- 7.5 Sales - Market size and forecast 2022-2027
- Exhibit 62: Chart on Sales - Market size and forecast 2022-2027 ($ billion)
- Exhibit 63: Data Table on Sales - Market size and forecast 2022-2027 ($ billion)
- Exhibit 64: Chart on Sales - Year-over-year growth 2022-2027 (%)
- Exhibit 65: Data Table on Sales - Year-over-year growth 2022-2027 (%)
- 7.6 Market opportunity by Type
- Exhibit 66: Market opportunity by Type ($ billion)
8 Customer Landscape
- 8.1 Customer landscape overview
- Exhibit 67: Analysis of price sensitivity, lifecycle, customer purchase basket, adoption rates, and purchase criteria
9 Geographic Landscape
- 9.1 Geographic segmentation
- Exhibit 68: Chart on Market share by geography - 2022-2027 (%)
- Exhibit 69: Data Table on Market share by geography - 2022-2027 (%)
- 9.2 Geographic comparison
- Exhibit 70: Chart on Geographic comparison
- Exhibit 71: Data Table on Geographic comparison
- 9.3 Germany - Market size and forecast 2022-2027
- Exhibit 72: Chart on Germany - Market size and forecast 2022-2027 ($ billion)
- Exhibit 73: Data Table on Germany - Market size and forecast 2022-2027 ($ billion)
- Exhibit 74: Chart on Germany - Year-over-year growth 2022-2027 (%)
- Exhibit 75: Data Table on Germany - Year-over-year growth 2022-2027 (%)
- 9.4 UK - Market size and forecast 2022-2027
- Exhibit 76: Chart on UK - Market size and forecast 2022-2027 ($ billion)
- Exhibit 77: Data Table on UK - Market size and forecast 2022-2027 ($ billion)
- Exhibit 78: Chart on UK - Year-over-year growth 2022-2027 (%)
- Exhibit 79: Data Table on UK - Year-over-year growth 2022-2027 (%)
- 9.5 France - Market size and forecast 2022-2027
- Exhibit 80: Chart on France - Market size and forecast 2022-2027 ($ billion)
- Exhibit 81: Data Table on France - Market size and forecast 2022-2027 ($ billion)
- Exhibit 82: Chart on France - Year-over-year growth 2022-2027 (%)
- Exhibit 83: Data Table on France - Year-over-year growth 2022-2027 (%)
- 9.6 Italy - Market size and forecast 2022-2027
- Exhibit 84: Chart on Italy - Market size and forecast 2022-2027 ($ billion)
- Exhibit 85: Data Table on Italy - Market size and forecast 2022-2027 ($ billion)
- Exhibit 86: Chart on Italy - Year-over-year growth 2022-2027 (%)
- Exhibit 87: Data Table on Italy - Year-over-year growth 2022-2027 (%)
- 9.7 Rest of Europe - Market size and forecast 2022-2027
- Exhibit 88: Chart on Rest of Europe - Market size and forecast 2022-2027 ($ billion)
- Exhibit 89: Data Table on Rest of Europe - Market size and forecast 2022-2027 ($ billion)
- Exhibit 90: Chart on Rest of Europe - Year-over-year growth 2022-2027 (%)
- Exhibit 91: Data Table on Rest of Europe - Year-over-year growth 2022-2027 (%)
- 9.8 Market opportunity by geography
- Exhibit 92: Market opportunity by geography ($ billion)
10 Drivers, Challenges, and Trends
- 10.3 Impact of drivers and challenges
- Exhibit 93: Impact of drivers and challenges in 2022 and 2027
11 Vendor Landscape
- 11.2 Vendor landscape
- Exhibit 94: Overview on Criticality of inputs and Factors of differentiation
- 11.3 Landscape disruption
- Exhibit 95: Overview on factors of disruption
- 11.4 Industry risks
- Exhibit 96: Impact of key risks on business
12 Vendor Analysis
- 12.1 Vendors covered
- Exhibit 97: Vendors covered
- 12.2 Market positioning of vendors
- Exhibit 98: Matrix on vendor position and classification
- 12.3 AG Real Estate
- Exhibit 99: AG Real Estate - Overview
- Exhibit 100: AG Real Estate - Product / Service
- Exhibit 101: AG Real Estate - Key offerings
- 12.4 Blackstone Inc.
- Exhibit 102: Blackstone Inc. - Overview
- Exhibit 103: Blackstone Inc. - Business segments
- Exhibit 104: Blackstone Inc. - Key news
- Exhibit 105: Blackstone Inc. - Key offerings
- Exhibit 106: Blackstone Inc. - Segment focus
- 12.5 BNP Paribas
- Exhibit 107: BNP Paribas - Overview
- Exhibit 108: BNP Paribas - Product / Service
- Exhibit 109: BNP Paribas - Key offerings
- 12.6 Covivio
- Exhibit 110: Covivio - Overview
- Exhibit 111: Covivio - Product / Service
- Exhibit 112: Covivio - Key offerings
- 12.7 Deutsche WohnenDeutsche Wohnen SE
- Exhibit 113: Deutsche WohnenDeutsche Wohnen SE - Overview
- Exhibit 114: Deutsche WohnenDeutsche Wohnen SE - Product / Service
- Exhibit 115: Deutsche WohnenDeutsche Wohnen SE - Key offerings
- 12.8 Fastighets AB Baider
- Exhibit 116: Fastighets AB Baider - Overview
- Exhibit 117: Fastighets AB Baider - Product / Service
- Exhibit 118: Fastighets AB Baider - Key offerings
- 12.9 Futureal Management Szolgaltato Kft.
- Exhibit 119: Futureal Management Szolgaltato Kft. - Overview
- Exhibit 120: Futureal Management Szolgaltato Kft. - Product / Service
- Exhibit 121: Futureal Management Szolgaltato Kft. - Key offerings
- 12.10 HB Reavis Group
- Exhibit 122: HB Reavis Group - Overview
- Exhibit 123: HB Reavis Group - Product / Service
- Exhibit 124: HB Reavis Group - Key offerings
- 12.11 Hines
- Exhibit 125: Hines - Overview
- Exhibit 126: Hines - Product / Service
- Exhibit 127: Hines - Key offerings
- 12.12 MITSUBISHI ESTATE Co., Ltd.
- Exhibit 128: MITSUBISHI ESTATE Co., Ltd. - Overview
- Exhibit 129: MITSUBISHI ESTATE Co., Ltd. - Product / Service
- Exhibit 130: MITSUBISHI ESTATE Co., Ltd. - Key offerings
- 12.13 REA group Ltd.
- Exhibit 131: REA group Ltd. - Overview
- Exhibit 132: REA group Ltd. - Product / Service
- Exhibit 133: REA group Ltd. - Key offerings
- 12.14 Segro Plc
- Exhibit 134: Segro Plc - Overview
- Exhibit 135: Segro Plc - Business segments
- Exhibit 136: Segro Plc - Key offerings
- Exhibit 137: Segro Plc - Segment focus
- 12.15 Skanska
- Exhibit 138: Skanska - Overview
- Exhibit 139: Skanska - Product / Service
- Exhibit 140: Skanska - Key offerings
- 12.16 STRABAG SE
- Exhibit 141: STRABAG SE - Overview
- Exhibit 142: STRABAG SE - Business segments
- Exhibit 143: STRABAG SE - Key news
- Exhibit 144: STRABAG SE - Key offerings
- Exhibit 145: STRABAG SE - Segment focus
- 12.17 Tishman Speyer
- Exhibit 146: Tishman Speyer - Overview
- Exhibit 147: Tishman Speyer - Product / Service
- Exhibit 148: Tishman Speyer - Key offerings
13 Appendix
- 13.2 Inclusions and exclusions checklist
- Exhibit 149: Inclusions checklist
- Exhibit 150: Exclusions checklist
- 13.3 Currency conversion rates for US$
- Exhibit 151: Currency conversion rates for US$
- 13.4 Research methodology
- Exhibit 152: Research methodology
- Exhibit 153: Validation techniques employed for market sizing
- Exhibit 154: Information sources
- 13.5 List of abbreviations
- Exhibit 155: List of abbreviations
About Us
Technavio is a leading global technology research and advisory company. Their research and analysis focus on emerging market trends and provide actionable insights to help businesses identify market opportunities and develop effective strategies to optimize their market positions. With over 500 specialized analysts, Technavio's report library consists of more than 17,000 reports and counting, covering 800 technologies, spanning across 50 countries. Their client base consists of enterprises of all sizes, including more than 100 Fortune 500 companies. This growing client base relies on Technavio's comprehensive coverage, extensive research, and actionable market insights to identify opportunities in existing and potential markets and assess their competitive positions within changing market scenarios.
Contact
Technavio Research
Jesse Maida
Media & Marketing Executive
US: +1 844 364 1100
UK: +44 203 893 3200
Email: media@technavio.com
Website: www.technavio.com/
View original content to download multimedia:https://www.prnewswire.com/news-releases/europe-commercial-real-estate-market-2023-2027-a-descriptive-analysis-of-five-forces-model-market-dynamics-and-segmentation--technavio-301721126.html
SOURCE Technavio


