Uncategorized
Essential drug company to liquidate in Chapter 11 bankruptcy
The biopharmaceutical company will liquidate in Chapter 11 bankruptcy after sale.
Share this:


Bankruptcy filings in the healthcare sector rose significantly over the last three years, rising from 25 in 2021 to 46 in 2022 and 79 in 2023, which was the highest level in five years, according to a Gibbins Advisors report.
For the first two months of the year, bankruptcies rose from about five filings in January to 12 more in February, according to data from S&P Global Market Intelligence. The most notable Chapter 11 filings in February were Cano Health, which filed on Feb. 4 with over $1 billion in assets and liabilities, and Invitae Corp., which filed on Feb. 13 with $500 million to $1 billion in assets and over $1 billion in liabilities.
Related: Troubled wireless technology pioneer files Chapter 11 bankruptcy
Chapter 11 filings are not slowing down yet, as a major biopharmaceutical company that sells essential drugs for serious life-threatening diseases has filed for bankruptcy in April.
Parkinson's, multiple sclerosis drug company files bankruptcy
Pearl River, N.Y.-based Acorda Therapeutics (ACOR) , maker of Parkinson's disease and multiple sclerosis therapies, on April 1 filed for Chapter 11 bankruptcy in the U.S. Bankruptcy Court for the Southern District of New York with a restructuring support agreement backed by its ad hoc noteholder group that seeks a sale to stalking-horse bidder Merz Therapeutics for a $185 million bid and an eventual confirmation of a liquidation plan to wind down operations after a sale.
The drug company will also seek $60 million in debtor-in-possession financing to fund operations during bankruptcy from its ad hoc noteholders, consisting of $10 million available on interim approval by the court, $10 million provided on final approval and a roll up of $40 million in debt.
The debtor listed $266.2 million in debt and $108.5 million in assets in its petition.
Acorda, founded in 1995, markets its Ampyra drug, which improves walking in adults with multiple sclerosis. The company manages the production and distribution of the drug through a third-party contract with Pantheon Inc. The drug is known as Fampyra outside the U.S. and produced and distributed by Biogen International GmbH, though the parties' contract is set to terminate on Jan. 1, 2025.
The biopharmaceutical company's other product is Inbrija, the first and only levodopa inhalation powder approved by the Food and Drug Administration for intermittent treatment of episodic motor fluctuations in adults with Parkinson's disease treated with carbidopa/levodopa regimen. Catalent Massachusetts manufactures the drug under contract through 2030.
Shutterstock
Pharmaceutical company purchase failed to generate revenue
Several factors caused the company's financial distress, according to a declaration by CFO Michael Gesser, including the company's 2016 acquisition of Biotie Therapies for about $363 million, which did not generate any revenue for the company and instead had net operating losses of $120 million.
The company also suffered an adverse court ruling that invalidated several of its Ampyra patents, which allowed generic versions of the drug to enter the U.S. market in late 2018 and caused a rapid loss of substantial revenue, the declaration said.
Finally, slower than expected sales of its Inbrija drug, due to the Covid-19 pandemic and prescribing challenges had a material adverse effect of the company's business and the inability to invest in its pipeline of drugs and other development opportunities also harmed the company financially.
The debtor seeks to set a May 16 deadline for potential qualified bids for an auction to be held May 22. A sale hearing to approve a sale would be scheduled for May 31 if an auction is held and on May 24 if no auction is held.
Related: Veteran fund manager picks favorite stocks for 2024
bankruptcy bankruptcies pandemic covid-19 stocks treatment
Uncategorized
A record-breaking recovery for Black and Hispanic workers: Prime-age employment rates have hit an all-time high alongside tremendous wage growth
U.S. labor market strength in the recovery has been extraordinary because policymakers addressed the pandemic and subsequent recession at the scale of…
Share this:

U.S. labor market strength in the recovery has been extraordinary because policymakers addressed the pandemic and subsequent recession at the scale of the problem. Unemployment has been at or below 4.0% for 27 months running, the longest such stretch since the late 1960s. Low-wage workers experienced an unprecedented surge in wage growth over the last four years, as shown in our new report.
These historically robust outcomes extended to Black and Hispanic workers. In 2023, the share of Black and Hispanic people ages 25-54 with a job hit an all-time high. Further, real wage growth among Black and Hispanic workers experienced a significant turnaround from the stagnant wage growth they suffered in much of the prior four decades.
Record-breaking employment-to-population ratio
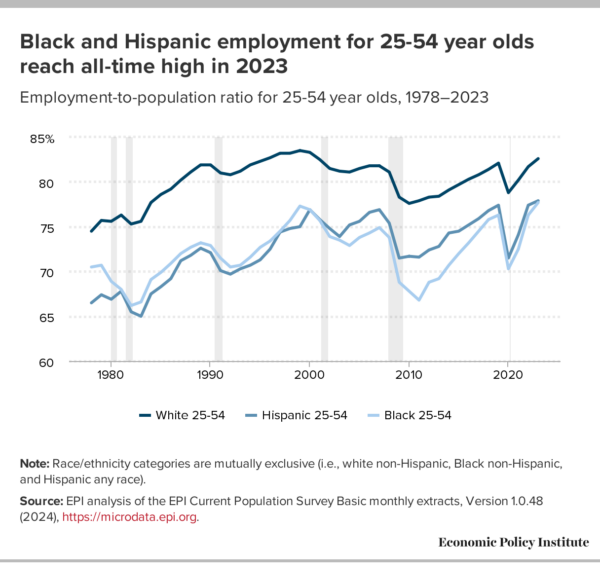
The share of the population ages 25-54 with a job—the prime-age employment-to-population ratio (PA EPOP)—rose to 80.7% in 2023, surpassing the pre-pandemic high of 80.0% in 2019 and marking the highest level since 2000. Historically marginalized workers are hit harder than other workers in recessions. In tight labor markets like today’s, historically marginalized workers experience more improved labor market outcomes and faster wage growth. In fact, Black and Hispanic workers hit all-time high employment rates in 2023: The Black PA EPOP hit 77.7% in 2023, better than its previous high in 1999 (77.3%). The Hispanic PA EPOP reached 77.9%, better than its pre-pandemic high of 77.4% in 2019.
Figure A displays Black, Hispanic, and white PA EPOPs between 1978 and 2023. Prime age is a key demographic to analyze because it is less influenced by the aging population or increases in college attendance (which may depress the employment rates of younger workers relative to earlier historical periods when college attendance was less common). On average, white workers have always experienced better labor market outcomes—specifically lower unemployment and higher EPOPs—than Black and Hispanic workers. Further, Black and Hispanic workers experience larger swings in labor market outcomes in business cycles, clearly shown in the larger dips in employment in and after the shaded recessions in the figure.
Due largely to the more robust policy response, it took only four years for Black and Hispanic workers to hit pre-pandemic employment peaks in this business cycle compared with the prolonged recovery from the Great Recession—when Black and Hispanic employment only hit pre-recession levels after 11 and 12 years, respectively.
Faster wage growth for Black and Hispanic workers over the last four years
Black and Hispanic workers have also experienced stronger wage growth during this recovery. Because of long-standing patterns of discrimination and occupational segregation, faster wage growth among Black and Hispanic workers is due in part to their disproportionate representation in the low-wage labor market relative to their shares within the overall workforce.
Figure B shows wage growth by race and ethnicity over the last four years compared with the prior 40 years. Because of the different periods of time, the growth rates here are annualized to better compare apples to apples. While there were short periods of decent wage growth for Black and Hispanic workers—particularly in the late 1990s and the years leading up to the pre-pandemic labor market peak in 2019—the overall impression of the 1979 to 2019 period is one of slower wage growth. In comparison, real wage growth—which accounts for high inflation—was particularly strong for these historically marginalized groups between 2019 and 2023. Black workers in particular experienced wage growth far above their historical norm: 1.4% annually over the last four years.
In our latest State of Working America Wages report, we show how the Black-white and Hispanic-white wage gaps remain much larger now than in 1979 even as the narrowing over the last four years has been significant. We also show how Black men experienced particularly fast growth relative to past performance, increasing 1.5% annualized over the last four years, compared with 0.0% on average over the prior 40 years.

While overall low unemployment and high EPOPs are certainly positive indicators of labor market strength right now, allowing the economy to recover and keep growing has translated into significant gains for historically marginalized Black and Hispanic workers. Policymakers need to keep pushing to keep the labor market pinned very tightly near full employment. The evidence is clear: If the Federal Reserve keeps interest rates higher than is needed to normalize inflation, the result may be an avoidable recession. Even a mild recession will do significant harm to Black and Hispanic workers’ opportunities for employment and wage growth.
recession unemployment pandemic federal reserve recession recovery interest rates unemploymentUncategorized
“Urban Doom Loop” Of Vacant Offices: How Far Will It Go?
"Urban Doom Loop" Of Vacant Offices: How Far Will It Go?
Via SchiffGold.com,
Even the mainstream is starting to acknowledge the massive problem…
Share this:


Even the mainstream is starting to acknowledge the massive problem of vacant office buildings littering American cities, slowly turning them into post-Covid wastelands. While a few pundits are claiming (in somewhat Orwellian fashion) that the surge in empty commercial real estate is actually a chance for a utopian turnaround in the ashes of Covid weirdness, the potential for an “Urban Doop Loop” triggered by CRE is now being widely acknowledged as a possible trigger for a broader economic meltdown.
With a pre-existing problem amplified drastically by COVID-19 and then set in stone, the rising office vacancy rate has no real solution. The problem is slowly and steadily getting worse, becoming a “new normal” that simply can’t go on forever without further economic repercussions. And this time is distinct from other major downturns in that during previous shocks, like 9/11 and the 2008 financial crisis, everyone more or less agreed that eventually, things would pick back up again. This time, it’s permanent.
Take just a few examples:
New York — There’s a new record for office vacancies in Manhattan, which have risen above 17%, and show no signs of slowing down. Vacancies have grown 70% in Manhattan since Covid (growing 20% nationally in the same period), with the Financial District hardest hit.
Pittsburgh — Currently sitting above 20% vacant, or 27% if you factor in subleases, it’s estimated that nearly half of the city’s commercial real estate could be empty within four years. If not reversed, a local crisis (at the very least) seems all but assured.
Portland — With the highest office vacancy rate in the nation — a mind-melting 30% or more — Portland officials are offering desperate pleas in the form of tax credits and other incentives to fill its deserted commercial buildings.
Los Angeles — Demand is so low for commercial real estate that, in one case, developers abandoned plans to build a shiny new 61-story office tower in place of an empty commercial building. Instead, they demolished it and installed a handful of EV charging stations.
There’s no great solution. Most cities are floating quixotic proposals to turn empty offices into apartments to “fix” the crisis, but this is often too expensive to be practical and requires navigating lots of bureaucratic red tape, like changes to zoning laws.
Recognizing how dependent their cities are on property taxes harvested from commercial real estate, getting municipal governments to change zoning laws actually might be the easiest part. Vacant office buildings equate to plummeting revenue, forcing cities to make up the loss by increasing taxes elsewhere or reducing spending.
For one, New York City’s commercial real estate accounts for 20% of the property tax and 10% of overall revenue, with the city comptroller projecting a $1.1 billion shortfall from vacant offices in 2024. In Boston, property taxes on office buildings comprise a staggering 22% of total revenue.
Even the most optimistic, desperately trying to see this crisis as an “opportunity” to start fresh, are being forced to acknowledge the challenges. But turning commercial spaces into residential ones and hoping for the best is one of the only few “Hail Mary” options cities have left to avoid a further implosion that bleeds into the banking sector and sets off a chain reaction.
Last year's failures of Silicon Valley Bank, Signature Bank, First Republic Bank, and Credit Suisse showed that more progress is required in a number of areas to ensure that banks aren't too big to fail. Read our blog for more about the lessons learned. https://t.co/PFtEp1X8Ri pic.twitter.com/HBzgWsVC2f
— IMF (@IMFNews) March 31, 2024
For the hopeful, such as Dana Lind of the Penn Institute for Urban Research, the buyer’s market in big cities provides a golden opportunity that was missed during the 2008 crisis. She hopes local buyers will use these empty buildings to invigorate cities by serving local needs, or that the empty offices will be bought by cities themselves and turned into vibrant community centers:
“Smart investors see what is happening in American downtowns four years out from the onset of the pandemic—the business fundamentals of cities like New York, Boston, or Houston are relatively stable and could even dramatically improve. Why not buy?”
Sure, fundamentals could improve. But will they? She goes on to say:
“As commercial properties fall into foreclosure in 2024, cities could take steps to better shape the city they want in the future by actually investing in those properties themselves.”
It all sounds lovely. Unfortunately, I’m less confident the CRE crisis can be contained this way, and that it won’t contribute to a broader meltdown.
Empty offices mean fewer people visiting the surrounding stores and restaurants. As the economic damage begins to snowball, the domino effect eventually reaches the banking sector, especially smaller and mid-size banks — and thus, the “Doom Loop” takes form. If we are to take the recent failure of regional firms like New York Community Bancorp as evidence, this vicious spiral may already be beginning.
CBS reported in January that office loan delinquencies were up a shocking four times compared to the previous year. In under two years, commercial real estate loans totaling $1.5 trillion are due to expire, portending disaster for the economy when the bill comes due and office owners can’t pay it. According to data from the St. Louis Fed, delinquency rates on commercial real estate loans have already ticked above their Covid peak:
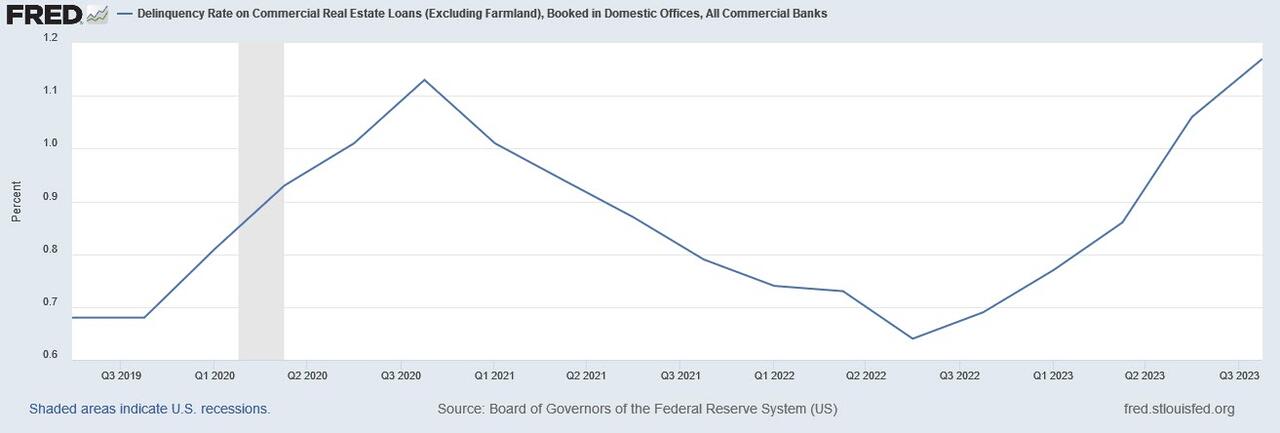
Occupancy Rate on CRE Loans (Excluding Farmland), Booked in Domestic Offices, Q3 2019 to Q3 2023
In an industry that lives and dies by interest rates, the problem provides another powerful source of pressure on the Fed to cut rates this year, boosting the bottom line for commercial landlords and developers who are being squeezed by a high cost of borrowing and already scrambling to change the terms of their debt.
A recent Moody’s podcast offers a glimmer of hope that there are enough factors to offset the challenges of CRE delinquencies. But with the rate cuts that the market hoped for last year now expected to be much less significant, will put further stress on a CRE market that’s addicted to rock-bottom borrowing costs. If the Fed cuts rates too low, inflation will spiral out of control, but keep them too high, and other things (like CRE) will continue to bend and break.
Uncategorized
Bond Market’s Eerie Calm Belies Bigger Move On Way
Bond Market’s Eerie Calm Belies Bigger Move On Way
Authored by Simon White, Bloomberg macro strategist,
Volatility in US interest rate and…
Share this:

Authored by Simon White, Bloomberg macro strategist,
Volatility in US interest rate and bond markets is poised to move much higher as it re-attaches to underlying fundamentals. That means higher rates and greater stock volatility, leaving especially high-duration sectors such as tech exposed to underperformance and potential downside.
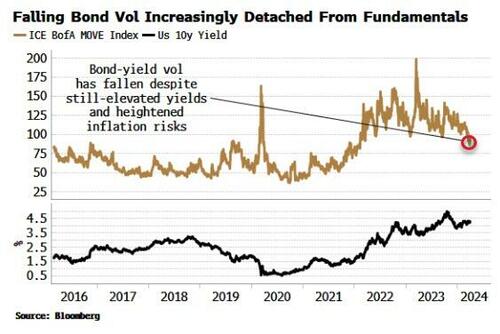
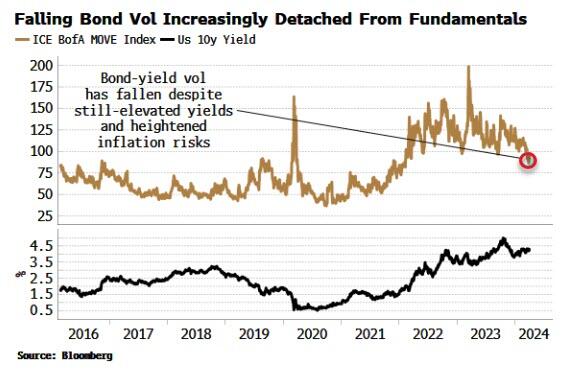
There is something of a preternatural calm to bond markets at the moment. Despite upside growth and inflation risks bubbling up, bond volatility has been in a downward trend for the past six months. It remains much lower than the highs it reached in 2022, and the spasm that was the SVB crisis in 2023.
But there are mounting signs that this won’t last, and we should soon see larger moves in yields again with an upward bias. That also means the currently-depressed VIX is poised to move higher. After a recess, volatility is coming back.
Low or falling volatility often precedes big moves. If you need an example, consider gold and silver. Their volatility fell to multi-year lows in February, ahead of both metals surging higher in recent days.
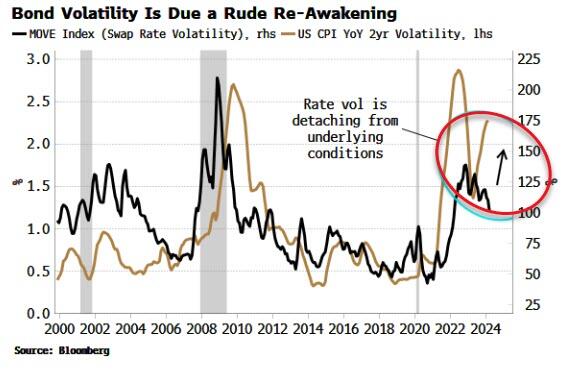
The MOVE index is the bond equivalent of the VIX. It uses a range of options on interest-rate swaps of different maturities to gauge the average level of rate volatility. As with the VIX, it was very low in the early years of the pandemic as the Federal Reserve pulled out all the stops to avert an economic calamity.
But unlike the VIX, the MOVE rose sharply as the Fed began to raise rates at a faster clip than it had done for decades, before cresting amid the turbulence of SVB’s collapse. Since then it has steadily fallen - yet this is increasingly at odds with the underlying risks.
Most focus has been on slowing inflation, but inflation volatility is telling a different story. It’s the variability in inflation as much as its level that’s a problem for bond volatility. Inflation’s volatility, after dipping, is rising strongly again. The MOVE is soon likely to correct higher to reflect rising inflation uncertainty.
The disconnect is not confined to inflation volatility. The real yield curve, which typically flattens as inflation falls, has stopped flattening, and signally failed to invert as it did in the early 1980s when Volcker unambiguously snuffed out inflation by jacking real rates considerably higher.

Yet despite today’s latent inflation risks, implied short-term rate volatility has declined rapidly back to its long-term average. The fourth generic SOFR contract (currently December 2024 expiry) is implying a daily move of only 5-6 bps in short-term rates, from more than 12 bps just last year.
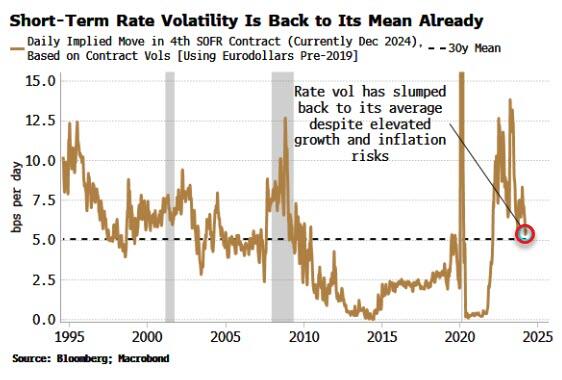
That’s still much higher than the post-GFC QE era, but a more fitting comparison is the 1990s and 2000s when five bps a day was the normal daily move. Even so, with higher upside inflation risks today than back then, a five-bps implied move in short-term rates is a floor not a ceiling.
Bonds face inflation as well as upside growth risks, but markets appear to be more worried about the second than the first. Implied bond volatility might be falling, but realized volatility in nominal 10-year yields has been rising. Until early last year, volatility in real yields was also rising, but since then it has been falling.
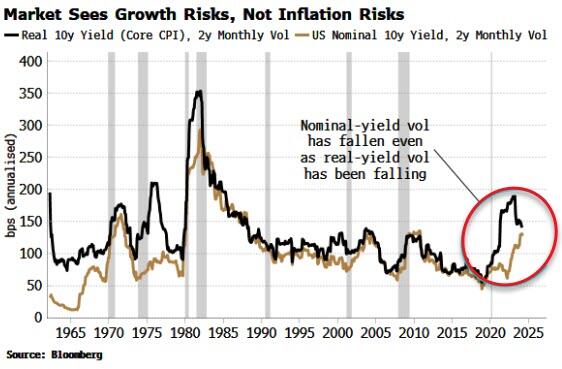
This suggests a market expectant of upside growth risks (as leading data has been projecting, and the recent better-than-expected manufacturing ISM was a timely reminder of), but exceedingly relaxed about risks from inflation.
Yet with inflation risks rising, not falling, real-yield vol will soon rise, reinforcing nominal-yield volatility (indeed TIPS volatility and skew may be early indicators of impending stress).
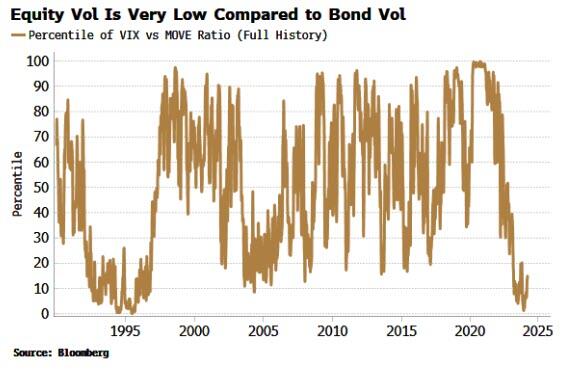
That won’t be the end of it though. While the MOVE has fallen, the VIX is considerably lower on a relative basis. Going back over the last 35 years, the VIX versus MOVE ratio has only been lower 15% of the time. That will change when bond vol rises.
But what is the actual mechanism by which higher rate volatility - not necessarily higher rates - boosts stock-market volatility? In this cycle, certainly, that role is likely to be filled by equity-index correlation.
Index correlation has been driven lower by index concentration (the Magnificent Seven effect) and by falling volatility in rates markets. But correlation is now so low it can only really go in one direction, and do so abruptly. It’s the muted correlation between stocks that’s been keeping the VIX low despite the volatility of many single stocks being quite elevated.
Stock-market correlation and bond volatility typically move together, as stocks’ valuations change more as the variance in rates rises. As the chart below shows, the central trends of the MOVE index and index correlation are closely aligned, ex the monthly up-and-down noise in the latter.
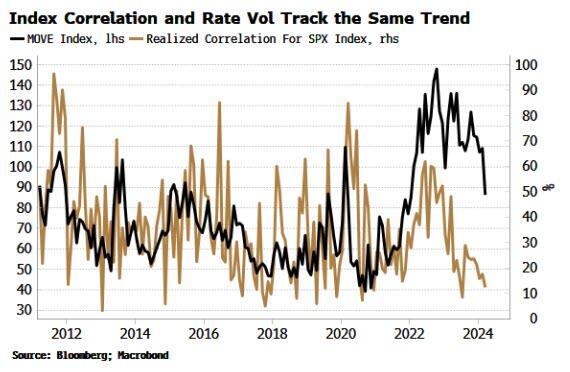
Thus a rise in bond volatility would lead to a rising index correlation, which would very quickly translate into a higher VIX.
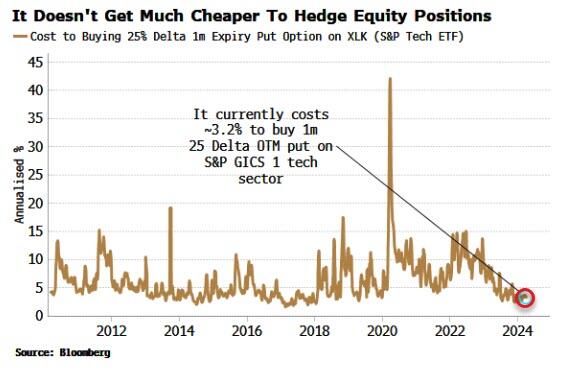
Higher equity vol would be destabilizing for the stock market. While it may not lead immediately to a broad selloff, in an environment of rising inflation risks high-duration sectors such as tech are prone to underperformance.
Fortunately, though, stock hedges are still cheap. For example, a 25 delta (~4% out-of-the-money) put option on the XLK tech sector ETF with a one-month expiry costs about 3.2% on an annualized basis. That’s about as cheap as it gets.
“Let no man claim he has got through the perils of winter till at least the 7th of May”, counseled the writer Anthony Trollope. It may be April, but the perils are not over for the bond - or equity - markets, and may in fact just be getting started.


Debt From Above: The Carbon Credit Coup


Landmark advances in employment reframe the outlook for people with disabilities in post-pandemic era


When a company files for bankruptcy, shareholders have choices


Historical patterns repeat as Bitcoin declines before halving


What is metabolism? A biochemist explains how different people convert energy differently − and why that matters for your health


Essential drugmaker to sell, liquidate in Chapter 11 bankruptcy
Parkinson’s, MS drug company seeks sale in Chapter 11 bankruptcy
When bankruptcy is filed, here’s the blunt truth for shareholders


Struggling mall retailer plans Chapter 11 bankruptcy filing
Struggling mall retailer could file for Chapter 11 bankruptcy
-

 International2 weeks ago
Parexel CEO to retire; CAR-T maker AffyImmune promotes business leader to chief executive
-

 Spread & Containment3 weeks ago
IFM’s Hat Trick and Reflections On Option-To-Buy M&A
-

 International4 weeks ago
EyePoint poaches medical chief from Apellis; Sandoz CFO, longtime BioNTech exec to retire
-

 International4 weeks ago
Walmart launches clever answer to Target’s new membership program
-

 Uncategorized2 days ago
Vaccinated People Show Long COVID-Like Symptoms With Detectable Spike Proteins: Preprint Study
-

 Uncategorized1 month ago
Evidence And Insights About Gold’s Long-Term Uptrend
-

 Uncategorized1 month ago
A Global, Digital Coup d’État
-

 Spread & Containment2 weeks ago
Japanese Preprint Calls For mRNA VaccinesTo Be Suspended Over Blood Bank Contamination Concerns