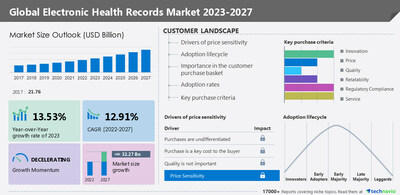
NEW YORK, Jan. 10, 2023 /PRNewswire/ -- According to Technavio, the global electronic health records market size is estimated to grow by USD 32.27 billion from 2022 to 2027. The market is expected to grow at a CAGR of 12.91% during the forecast period. However, the growth momentum will decelerate. North America will account for 41% of the growth of the global market during the forecast period.
For more insights on market size, request a sample report
Global electronic health records market - Five forces
The global electronic health records market is fragmented, and the five forces analysis covers–
- Bargaining power of buyers
- The threat of new entrants
- Threat of rivalry
- Bargaining power of suppliers
- Threat of substitutes
- For interpretation of Porter's five forces model – buy the report!
Global electronic health records market - Parent market analysis
Technavio categorizes the global electronic health records market as a part of the global healthcare technology market, which includes the revenue generated from the sales of healthcare applications and IT systems, Internet-based healthcare tools, and IT consulting services to clinics, hospitals, or businesses operating in the healthcare sector. Technavio calculates the size of the global healthcare technology market based on the combined revenue generated by the manufacturers or providers of equipment, supplies, pharmaceuticals, biotechnology, healthcare technology players, and life sciences tools and services.
Find insights on the parent market and value chain analysis, and download an exclusive sample!
Global electronic health records market – Customer landscape
The report includes the market's adoption lifecycle, from the innovator's stage to the laggard's stage. It focuses on adoption rates in different regions based on penetration. Furthermore, the report also includes key purchase criteria and drivers of price sensitivity to help companies evaluate and develop their growth strategies.
Global electronic health records market - Segmentation assessment
Segment overview
Technavio has segmented the market based on deployment (on-premise and cloud-based) and component (services, software, and hardware).
- The on-premise segment will contribute significantly to the market's growth during the forecast period. On-premises EHR provides end-users with control over systems and resources, as the entire setup is controlled by the organization and not by a third party. This improves data security, and critical data can be managed in-house. The data is stored on servers on the premises of organizations. Hence, users do not require the Internet to access data or resources. These benefits will drive the growth of the segment during the forecast period.
Geography overview
Based on geography, the global electronic health records market is segmented into North America, Europe, Asia, and Rest of World (ROW). The report provides actionable insights and estimates the contribution of all regions to the growth of the global electronic health records market.
- North America is estimated to account for 41% of the growth of the global market during the forecast period. The growth of the market is attributed to factors such as the adoption of EHR due to stringent regulatory norms and EHR incentivizing policies. The US and Canada are the leading countries in the region.
Download a sample report
Global electronic health records market – Market dynamics
Key factor driving market growth
- Government initiatives supporting the adoption of EHR are driving the EHR market growth.
- With the help of government support, healthcare systems find it easy to implement EHR systems and gain financial support. For instance, in the UK, the National Health Services (NHS) has converted all documentation processes into digitized forms.
- In addition, various region-specific initiatives are promoting digital healthcare services.
- Hence, the market is expected to grow during the forecast period.
Leading trends influencing the market
- The growing use of connected devices and technologies is a key trend in the market.
- In the healthcare industry, IoT helps in bridging the gap between physical and digital data sources by monitoring patients in real time.
- The rising use of connected medical devices has increased the number of data sources and the amount of data generated.
- Hence, device manufacturers and healthcare organizations are focusing on improving their network security, with the rising use of cloud-based infrastructure.
- These factors are compelling hospitals and clinics to adopt EHR, which will support market growth during the forecast period.
Major challenges hindering market growth
- Rising data security and privacy concerns are challenging market growth.
- The rise in the number of cyberattacks in the healthcare industry has raised concerns regarding privacy and data protection.
- The integration of data-generating devices into healthcare systems and the growing availability of data from health insurance companies and hospitals in a centralized place have made healthcare organizational information and patient data vulnerable to cyberattacks.
Hence, security and privacy issues are restricting the healthcare industry from adopting many advanced technologies, which will impede the market's growth during the forecast period.
Drivers, trends, and challenges have an impact on market dynamics, which can impact businesses. Find some insights from a sample report!
What are the key data covered in this electronic health records market report?
- CAGR of the market during the forecast period
- Detailed information on factors that will drive the growth of the electronic health records market between 2023 and 2027
- Precise estimation of the size of the electronic health records market and its contribution to the parent market
- Accurate predictions about upcoming trends and changes in consumer behavior
- Growth of the electronic health records market across North America, Europe, Asia, and Rest of World (ROW)
- A thorough analysis of the market's competitive landscape and detailed information about vendors
- Comprehensive analysis of factors that will challenge the growth of electronic health records market vendors
Gain instant access to 17,000+ market research reports.
Technavio's SUBSCRIPTION platform
Related Reports:
The size of the healthcare RCM outsourcing market in the US is expected to increase by USD 1.67 billion from 2021 to 2026, and the market's growth momentum will accelerate at a CAGR of 7.75%. This report extensively covers the segmentation by service (back-end services, middle services, and front-end services).
The environment, health, and safety (EHS) market size is expected to increase by USD 2.80 billion from 2021 to 2026, and the market's growth momentum will accelerate at a CAGR of 8.26%. This report extensively covers market segmentation by end-user (energy and utilities, chemicals and materials, healthcare, construction and engineering, and others) and geography (North America, APAC, Europe, South America, and Middle East and Africa).
Electronic Health Records Market Scope
|
Report Coverage
| Details
|
Page number
| 166
|
Base year
| 2022
|
Historic period
| 2017-2021
|
Forecast period
| 2023-2027
|
Growth momentum & CAGR
| Decelerate at a CAGR of 12.91%
|
Market growth 2023-2027
| USD 32.27 billion
|
Market structure
| Fragmented
|
YoY growth 2022-2023 (%)
| 13.53
|
Regional analysis
| North America, Europe, Asia, and Rest of World (ROW)
|
Performing market contribution
| North America at 41%
|
Key countries
| US, Canada, UK, Germany, and China
|
Competitive landscape
| Leading Vendors, Market Positioning of Vendors, Competitive Strategies, and Industry Risks
|
Key companies profiled
| Allscripts Healthcare Solutions Inc., CareCloud Inc., Computer Programs and Systems Inc., CureMD.com Inc., Dedalus Group, eClinicalWorks LLC, Epic Systems Corp., EverCommerce Inc., General Electric Co., Global Payments Inc., Greenway Health LLC, KareXpert Technologies Pvt. Ltd., McKesson Corp., MEDHOST, Medical Information Technology Inc., Oracle Corp., Siemens AG, Tebra Technologies Inc., Athenahealth Inc., and Dell Technologies Inc.
|
Market dynamics
| Parent market analysis, Market growth inducers and obstacles, Fast-growing and slow-growing segment analysis, COVID-19 impact and recovery analysis and future consumer dynamics, and Market condition analysis for the forecast period.
|
Customization purview
| If our report has not included the data that you are looking for, you can reach out to our analysts and get segments customized.
|
Customization purview
| If our report has not included the data that you are looking for, you can reach out to our analysts and get segments customized.
|
Browse for Technavio's information technology market reports
Table of contents
1 Executive Summary
- 1.1 Market overview
- Exhibit 01: Executive Summary – Chart on Market Overview
- Exhibit 02: Executive Summary – Data Table on Market Overview
- Exhibit 03: Executive Summary – Chart on Global Market Characteristics
- Exhibit 04: Executive Summary – Chart on Market by Geography
- Exhibit 05: Executive Summary – Chart on Market Segmentation by Deployment
- Exhibit 06: Executive Summary – Chart on Market Segmentation by Component
- Exhibit 07: Executive Summary – Chart on Incremental Growth
- Exhibit 08: Executive Summary – Data Table on Incremental Growth
- Exhibit 09: Executive Summary – Chart on Vendor Market Positioning
2 Market Landscape
- 2.1 Market ecosystem
- Exhibit 10: Parent market
- Exhibit 11: Market Characteristics
3 Market Sizing
- 3.1 Market definition
- Exhibit 12: Offerings of vendors included in the market definition
- 3.2 Market segment analysis
- Exhibit 13: Market segments
- 3.4 Market outlook: Forecast for 2022-2027
- Exhibit 14: Chart on Global - Market size and forecast 2022-2027 ($ billion)
- Exhibit 15: Data Table on Global - Market size and forecast 2022-2027 ($ billion)
- Exhibit 16: Chart on Global Market: Year-over-year growth 2022-2027 (%)
- Exhibit 17: Data Table on Global Market: Year-over-year growth 2022-2027 (%)
4 Historic Market Size
- 4.1 Global electronic health records market 2017 - 2021
- Exhibit 18: Historic Market Size – Data Table on Global electronic health records market 2017 - 2021 ($ billion)
- 4.2 Deployment Segment Analysis 2017 - 2021
- Exhibit 19: Historic Market Size – Deployment Segment 2017 - 2021 ($ billion)
- 4.3 Component Segment Analysis 2017 - 2021
- Exhibit 20: Historic Market Size – Component Segment 2017 - 2021 ($ billion)
- 4.4 Geography Segment Analysis 2017 - 2021
- Exhibit 21: Historic Market Size – Geography Segment 2017 - 2021 ($ billion)
- 4.5 Country Segment Analysis 2017 - 2021
- Exhibit 22: Historic Market Size – Country Segment 2017 - 2021 ($ billion)
5 Five Forces Analysis
- 5.1 Five forces summary
- Exhibit 23: Five forces analysis - Comparison between 2022 and 2027
- 5.2 Bargaining power of buyers
- Exhibit 24: Chart on Bargaining power of buyers – Impact of key factors 2022 and 2027
- 5.3 Bargaining power of suppliers
- Exhibit 25: Bargaining power of suppliers – Impact of key factors in 2022 and 2027
- 5.4 Threat of new entrants
- Exhibit 26: Threat of new entrants – Impact of key factors in 2022 and 2027
- 5.5 Threat of substitutes
- Exhibit 27: Threat of substitutes – Impact of key factors in 2022 and 2027
- 5.6 Threat of rivalry
- Exhibit 28: Threat of rivalry – Impact of key factors in 2022 and 2027
- 5.7 Market condition
- Exhibit 29: Chart on Market condition - Five forces 2022 and 2027
6 Market Segmentation by Deployment
- 6.1 Market segments
- Exhibit 30: Chart on Deployment - Market share 2022-2027 (%)
- Exhibit 31: Data Table on Deployment - Market share 2022-2027 (%)
- 6.2 Comparison by Deployment
- Exhibit 32: Chart on Comparison by Deployment
- Exhibit 33: Data Table on Comparison by Deployment
- 6.3 On-premise - Market size and forecast 2022-2027
- Exhibit 34: Chart on On-premise - Market size and forecast 2022-2027 ($ billion)
- Exhibit 35: Data Table on On-premise - Market size and forecast 2022-2027 ($ billion)
- Exhibit 36: Chart on On-premise - Year-over-year growth 2022-2027 (%)
- Exhibit 37: Data Table on On-premise - Year-over-year growth 2022-2027 (%)
- 6.4 Cloud-based - Market size and forecast 2022-2027
- Exhibit 38: Chart on Cloud-based - Market size and forecast 2022-2027 ($ billion)
- Exhibit 39: Data Table on Cloud-based - Market size and forecast 2022-2027 ($ billion)
- Exhibit 40: Chart on Cloud-based - Year-over-year growth 2022-2027 (%)
- Exhibit 41: Data Table on Cloud-based - Year-over-year growth 2022-2027 (%)
- 6.5 Market opportunity by Deployment
- Exhibit 42: Market opportunity by Deployment ($ billion)
7 Market Segmentation by Component
- 7.1 Market segments
- Exhibit 43: Chart on Component - Market share 2022-2027 (%)
- Exhibit 44: Data Table on Component - Market share 2022-2027 (%)
- 7.2 Comparison by Component
- Exhibit 45: Chart on Comparison by Component
- Exhibit 46: Data Table on Comparison by Component
- 7.3 Services - Market size and forecast 2022-2027
- Exhibit 47: Chart on Services - Market size and forecast 2022-2027 ($ billion)
- Exhibit 48: Data Table on Services - Market size and forecast 2022-2027 ($ billion)
- Exhibit 49: Chart on Services - Year-over-year growth 2022-2027 (%)
- Exhibit 50: Data Table on Services - Year-over-year growth 2022-2027 (%)
- 7.4 Software - Market size and forecast 2022-2027
- Exhibit 51: Chart on Software - Market size and forecast 2022-2027 ($ billion)
- Exhibit 52: Data Table on Software - Market size and forecast 2022-2027 ($ billion)
- Exhibit 53: Chart on Software - Year-over-year growth 2022-2027 (%)
- Exhibit 54: Data Table on Software - Year-over-year growth 2022-2027 (%)
- 7.5 Hardware - Market size and forecast 2022-2027
- Exhibit 55: Chart on Hardware - Market size and forecast 2022-2027 ($ billion)
- Exhibit 56: Data Table on Hardware - Market size and forecast 2022-2027 ($ billion)
- Exhibit 57: Chart on Hardware - Year-over-year growth 2022-2027 (%)
- Exhibit 58: Data Table on Hardware - Year-over-year growth 2022-2027 (%)
- 7.6 Market opportunity by Component
- Exhibit 59: Market opportunity by Component ($ billion)
8 Customer Landscape
- 8.1 Customer landscape overview
- Exhibit 60: Analysis of price sensitivity, lifecycle, customer purchase basket, adoption rates, and purchase criteria
9 Geographic Landscape
- 9.1 Geographic segmentation
- Exhibit 61: Chart on Market share by geography 2022-2027 (%)
- Exhibit 62: Data Table on Market share by geography 2022-2027 (%)
- 9.2 Geographic comparison
- Exhibit 63: Chart on Geographic comparison
- Exhibit 64: Data Table on Geographic comparison
- 9.3 North America - Market size and forecast 2022-2027
- Exhibit 65: Chart on North America - Market size and forecast 2022-2027 ($ billion)
- Exhibit 66: Data Table on North America - Market size and forecast 2022-2027 ($ billion)
- Exhibit 67: Chart on North America - Year-over-year growth 2022-2027 (%)
- Exhibit 68: Data Table on North America - Year-over-year growth 2022-2027 (%)
- 9.4 Europe - Market size and forecast 2022-2027
- Exhibit 69: Chart on Europe - Market size and forecast 2022-2027 ($ billion)
- Exhibit 70: Data Table on Europe - Market size and forecast 2022-2027 ($ billion)
- Exhibit 71: Chart on Europe - Year-over-year growth 2022-2027 (%)
- Exhibit 72: Data Table on Europe - Year-over-year growth 2022-2027 (%)
- 9.5 Asia - Market size and forecast 2022-2027
- Exhibit 73: Chart on Asia - Market size and forecast 2022-2027 ($ billion)
- Exhibit 74: Data Table on Asia - Market size and forecast 2022-2027 ($ billion)
- Exhibit 75: Chart on Asia - Year-over-year growth 2022-2027 (%)
- Exhibit 76: Data Table on Asia - Year-over-year growth 2022-2027 (%)
- 9.6 Rest of World (ROW) - Market size and forecast 2022-2027
- Exhibit 77: Chart on Rest of World (ROW) - Market size and forecast 2022-2027 ($ billion)
- Exhibit 78: Data Table on Rest of World (ROW) - Market size and forecast 2022-2027 ($ billion)
- Exhibit 79: Chart on Rest of World (ROW) - Year-over-year growth 2022-2027 (%)
- Exhibit 80: Data Table on Rest of World (ROW) - Year-over-year growth 2022-2027 (%)
- 9.7 US - Market size and forecast 2022-2027
- Exhibit 81: Chart on US - Market size and forecast 2022-2027 ($ billion)
- Exhibit 82: Data Table on US - Market size and forecast 2022-2027 ($ billion)
- Exhibit 83: Chart on US - Year-over-year growth 2022-2027 (%)
- Exhibit 84: Data Table on US - Year-over-year growth 2022-2027 (%)
- 9.8 Canada - Market size and forecast 2022-2027
- Exhibit 85: Chart on Canada - Market size and forecast 2022-2027 ($ billion)
- Exhibit 86: Data Table on Canada - Market size and forecast 2022-2027 ($ billion)
- Exhibit 87: Chart on Canada - Year-over-year growth 2022-2027 (%)
- Exhibit 88: Data Table on Canada - Year-over-year growth 2022-2027 (%)
- 9.9 UK - Market size and forecast 2022-2027
- Exhibit 89: Chart on UK - Market size and forecast 2022-2027 ($ billion)
- Exhibit 90: Data Table on UK - Market size and forecast 2022-2027 ($ billion)
- Exhibit 91: Chart on UK - Year-over-year growth 2022-2027 (%)
- Exhibit 92: Data Table on UK - Year-over-year growth 2022-2027 (%)
- 9.10 Germany - Market size and forecast 2022-2027
- Exhibit 93: Chart on Germany - Market size and forecast 2022-2027 ($ billion)
- Exhibit 94: Data Table on Germany - Market size and forecast 2022-2027 ($ billion)
- Exhibit 95: Chart on Germany - Year-over-year growth 2022-2027 (%)
- Exhibit 96: Data Table on Germany - Year-over-year growth 2022-2027 (%)
- 9.11 China - Market size and forecast 2022-2027
- Exhibit 97: Chart on China - Market size and forecast 2022-2027 ($ billion)
- Exhibit 98: Data Table on China - Market size and forecast 2022-2027 ($ billion)
- Exhibit 99: Chart on China - Year-over-year growth 2022-2027 (%)
- Exhibit 100: Data Table on China - Year-over-year growth 2022-2027 (%)
- 9.12 Market opportunity by geography
- Exhibit 101: Market opportunity by geography ($ billion)
10 Drivers, Challenges, and Trends
- 10.3 Impact of drivers and challenges
- Exhibit 102: Impact of drivers and challenges in 2022 and 2027
11 Vendor Landscape
- 11.2 Vendor landscape
- Exhibit 103: Overview on Criticality of inputs and Factors of differentiation
- 11.3 Landscape disruption
- Exhibit 104: Overview on factors of disruption
- 11.4 Industry risks
- Exhibit 105: Impact of key risks on business
12 Vendor Analysis
- 12.1 Vendors covered
- Exhibit 106: Vendors covered
- 12.2 Market positioning of vendors
- Exhibit 107: Matrix on vendor position and classification
- 12.3 Allscripts Healthcare Solutions Inc.
- Exhibit 108: Allscripts Healthcare Solutions Inc. - Overview
- Exhibit 109: Allscripts Healthcare Solutions Inc. - Business segments
- Exhibit 110: Allscripts Healthcare Solutions Inc. - Key news
- Exhibit 111: Allscripts Healthcare Solutions Inc. - Key offerings
- Exhibit 112: Allscripts Healthcare Solutions Inc. - Segment focus
- 12.4 Athenahealth Inc.
- Exhibit 113: Athenahealth Inc. - Overview
- Exhibit 114: Athenahealth Inc. - Product / Service
- Exhibit 115: Athenahealth Inc. - Key offerings
- 12.5 CareCloud Inc.
- Exhibit 116: CareCloud Inc. - Overview
- Exhibit 117: CareCloud Inc. - Business segments
- Exhibit 118: CareCloud Inc. - Key news
- Exhibit 119: CareCloud Inc. - Key offerings
- Exhibit 120: CareCloud Inc. - Segment focus
- 12.6 Computer Programs and Systems Inc.
- Exhibit 121: Computer Programs and Systems Inc. - Overview
- Exhibit 122: Computer Programs and Systems Inc. - Business segments
- Exhibit 123: Computer Programs and Systems Inc. - Key offerings
- Exhibit 124: Computer Programs and Systems Inc. - Segment focus
- 12.7 CureMD.com Inc.
- Exhibit 125: CureMD.com Inc. - Overview
- Exhibit 126: CureMD.com Inc. - Product / Service
- Exhibit 127: CureMD.com Inc. - Key offerings
- 12.8 Dedalus Group
- Exhibit 128: Dedalus Group - Overview
- Exhibit 129: Dedalus Group - Product / Service
- Exhibit 130: Dedalus Group - Key offerings
- 12.9 Dell Technologies Inc.
- Exhibit 131: Dell Technologies Inc. - Overview
- Exhibit 132: Dell Technologies Inc. - Business segments
- Exhibit 133: Dell Technologies Inc. - Key news
- Exhibit 134: Dell Technologies Inc. - Key offerings
- Exhibit 135: Dell Technologies Inc. - Segment focus
- 12.10 eClinicalWorks LLC
- Exhibit 136: eClinicalWorks LLC - Overview
- Exhibit 137: eClinicalWorks LLC - Product / Service
- Exhibit 138: eClinicalWorks LLC - Key news
- Exhibit 139: eClinicalWorks LLC - Key offerings
- 12.11 Epic Systems Corp.
- Exhibit 140: Epic Systems Corp. - Overview
- Exhibit 141: Epic Systems Corp. - Product / Service
- Exhibit 142: Epic Systems Corp. - Key offerings
- 12.12 EverCommerce Inc.
- Exhibit 143: EverCommerce Inc. - Overview
- Exhibit 144: EverCommerce Inc. - Product / Service
- Exhibit 145: EverCommerce Inc. - Key offerings
- 12.13 General Electric Co.
- Exhibit 146: General Electric Co. - Overview
- Exhibit 147: General Electric Co. - Business segments
- Exhibit 148: General Electric Co. - Key news
- Exhibit 149: General Electric Co. - Key offerings
- Exhibit 150: General Electric Co. - Segment focus
- 12.14 Global Payments Inc.
- Exhibit 151: Global Payments Inc. - Overview
- Exhibit 152: Global Payments Inc. - Business segments
- Exhibit 153: Global Payments Inc. - Key offerings
- Exhibit 154: Global Payments Inc. - Segment focus
- 12.15 Greenway Health LLC
- Exhibit 155: Greenway Health LLC - Overview
- Exhibit 156: Greenway Health LLC - Product / Service
- Exhibit 157: Greenway Health LLC - Key offerings
- 12.16 KareXpert Technologies Pvt. Ltd.
- Exhibit 158: KareXpert Technologies Pvt. Ltd. - Overview
- Exhibit 159: KareXpert Technologies Pvt. Ltd. - Product / Service
- Exhibit 160: KareXpert Technologies Pvt. Ltd. - Key offerings
- 12.17 Oracle Corp.
- Exhibit 161: Oracle Corp. - Overview
- Exhibit 162: Oracle Corp. - Business segments
- Exhibit 163: Oracle Corp. - Key news
- Exhibit 164: Oracle Corp. - Key offerings
- Exhibit 165: Oracle Corp. - Segment focus
13 Appendix
- 13.2 Inclusions and exclusions checklist
- Exhibit 166: Inclusions checklist
- Exhibit 167: Exclusions checklist
- 13.3 Currency conversion rates for US$
- Exhibit 168: Currency conversion rates for US$
- 13.4 Research methodology
- Exhibit 169: Research methodology
- Exhibit 170: Validation techniques employed for market sizing
- Exhibit 171: Information sources
- 13.5 List of abbreviations
- Exhibit 172: List of abbreviations
About Us
Technavio is a leading global technology research and advisory company. Their research and analysis focus on emerging market trends and provide actionable insights to help businesses identify market opportunities and develop effective strategies to optimize their market positions. With over 500 specialized analysts, Technavio's report library consists of more than 17,000 reports and counting, covering 800 technologies, spanning across 50 countries. Their client base consists of enterprises of all sizes, including more than 100 Fortune 500 companies. This growing client base relies on Technavio's comprehensive coverage, extensive research, and actionable market insights to identify opportunities in existing and potential markets and assess their competitive positions within changing market scenarios.
Contact
Technavio Research
Jesse Maida
Media & Marketing Executive
US: +1 844 364 1100
UK: +44 203 893 3200
Email: media@technavio.com
Website: www.technavio.com/
View original content to download multimedia:https://www.prnewswire.com/news-releases/electronic-health-records-market-2023-2027-a-descriptive-analysis-of-parent-market-five-forces-model-market-dynamics-and-segmentation---technavio-301715273.html
SOURCE Technavio


