Core Inflation Is Probably A Better Measure Of The Trend
Inflation is topical again. The crowd is becoming increasingly concerned that a combination of factors, including ramped-up fiscal spending and ongoing monetary stimulus, will conspire to unleash firmer pricing pressure. By some accounts, inflation is…
Share this:

Inflation is topical again. The crowd is becoming increasingly concerned that a combination of factors, including ramped-up fiscal spending and ongoing monetary stimulus, will conspire to unleash firmer pricing pressure. By some accounts, inflation is set to spiral higher and threaten the price stability that’s prevailed for several decades.
But the future’s still uncertain and so there’s a lively debate about how much a threat inflation actually poses. That’s in part because the economic and demographic forces that created disinflationary trends aren’t going away — aging workforce, global savings glut, expanding array of technologies that enhance efficiency, etc.
Regardless of how you’re thinking about inflation, monitoring the trend is a top priority these days and on that front core measures are usually the better choice over the more widely reported headline counterparts.
Core inflation strips out energy and food prices from mix, an adjustment that often elicits howls of criticism from some corners. Consumers, after all, don’t have the luxury of living in a core-inflation world. True, but the goal of core inflation is not to estimate how current inflation is affecting the overall population. Rather, the aim is two-fold: estimate a robust measure of the inflationary trend with an eye on making a reasonable forecast of where it’s headed. By those standards, core measures of inflation are usually the better choice.
Learn To Use R For Portfolio Analysis
Quantitative Investment Portfolio Analytics In R:
An Introduction To R For Modeling Portfolio Risk and Return
By James Picerno
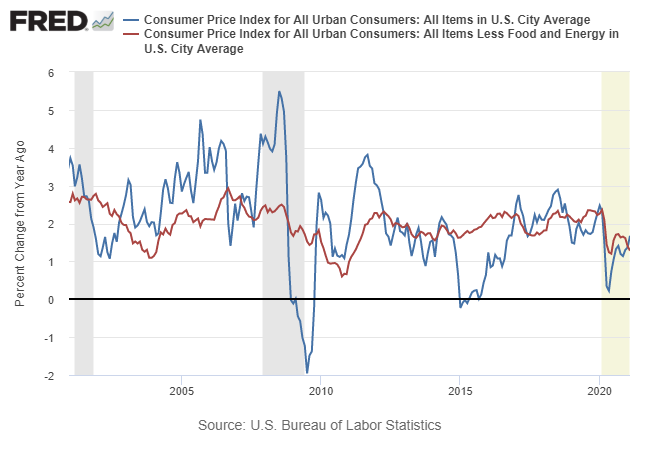
Let’s dig into the numbers to illustrate why that’s so. Before we begin, we’ll cut to the chase and note that core inflation continues to reflect low and, in recent history, a declining inflationary trend. The core Consumer Price Index (CPI), for example, slipped to a 1.3% annual pace in February (red line in chart below) – close to the lowest rate in over a decade and well below the Federal Reserve’s 2% inflation target.

Why should we put more stock in core inflation vs. headline? Let’s start with an empirical fact that’s clearly illustrated in the chart above: headline CPI fluctuates relatively widely around core. Sometimes headline inflation is substantially higher, sometimes lower. But headline inflation never permanently diverges from core and so history suggests that headline volatility is closer to noise relative to core’s signal.
We can quantify the core-reverting profile in several ways. One is to review how the difference in headline less core inflation varies through time, as shown in the next chart below. The fact that the difference cycles around zero is a critical point because it shows that the difference is stationary and exhibits a relatively constant mean. That’s persuasive econometric evidence that headline data has a relatively high level of noise vs. core’s signal. In short, the difference exhibits no trend, which is a compelling sign of a stable, mean-reverting time series. (The mean difference for headline less core CPI on a rolling one-year basis is virtually zero for data starting in 1958 through last month.)

Another test is to use core CPI as a one-year-ahead forecast of headline CPI and compare the results against using headline as a predictor of itself over the same time frame. To measure the degree of accuracy we’ll use a standard statistical tool: root-mean-square error (RMSE), which quantifies the variation in prediction errors. A higher RMSE indicates greater variation, which translates into a less-accurate forecast. A perfect prediction would have an RMSE of zero.
On that score, core fares better. Using core CPI to forecast year-ahead headline CPI generates an RMSE of 0.0203 since 1959. By contrast, using headline CPI to predict itself a year ahead generates an RMSE of 0.0466, or more than twice as high as the core model.
Note, too, that the correlation in the annual inflation data is higher for the core vs. year-ahead headline numbers: roughly 0.72 through the decades. By contrast, the correlation between current headline one-year changes vs. the year-ahead headline annual pace is lower at: 0.56. This is another bit of statistical support for thinking that core does a better job of anticipating year-ahead inflation.
Finally, let’s recognize that there are many ways to measure inflation. Like any one methodology, each comes with its own set of pros and cons and so looking beyond CPI is essential. But most of the alternative measures of inflation tell a story that echoes the core CPI trend: inflation remains low with minimal, if any, signs of trending higher.
For example, the Atlanta Fed’s Core Sticky Price Consumer Price Index shows a clear downside bias in recent history. The adjustment here is to focus on prices of goods and services that change infrequently, which “are thought to incorporate expectations about future inflation to a greater degree than prices that change on a more frequent basis. One possible explanation for sticky prices could be the costs firms incur when changing price. For further information about Sticky Price CPI.”

The low level of inflation could rebound, of course, and probably will, at least temporarily as the disinflation/deflation data during the initial stages of the coronavirus crisis last year washes on the year-over-year comparisons. In fact, as CapitalSpectator.com discussed earlier this month, a reflationary rebound is destiny in the short term.
Deciding if a temporary bout of reflation will lead to a longer-lasting run of higher inflation, on the other hand, remains open for debate, based on recent core readings of inflation.
How is recession risk evolving? Monitor the outlook with a subscription to:
The US Business Cycle Risk Report

International
Illegal Immigrants Leave US Hospitals With Billions In Unpaid Bills
Illegal Immigrants Leave US Hospitals With Billions In Unpaid Bills
By Autumn Spredemann of The Epoch Times
Tens of thousands of illegal…
Share this:

By Autumn Spredemann of The Epoch Times
Tens of thousands of illegal immigrants are flooding into U.S. hospitals for treatment and leaving billions in uncompensated health care costs in their wake.
The House Committee on Homeland Security recently released a report illustrating that from the estimated $451 billion in annual costs stemming from the U.S. border crisis, a significant portion is going to health care for illegal immigrants.
With the majority of the illegal immigrant population lacking any kind of medical insurance, hospitals and government welfare programs such as Medicaid are feeling the weight of these unanticipated costs.
Apprehensions of illegal immigrants at the U.S. border have jumped 48 percent since the record in fiscal year 2021 and nearly tripled since fiscal year 2019, according to Customs and Border Protection data.
Last year broke a new record high for illegal border crossings, surpassing more than 3.2 million apprehensions.
And with that sea of humanity comes the need for health care and, in most cases, the inability to pay for it.
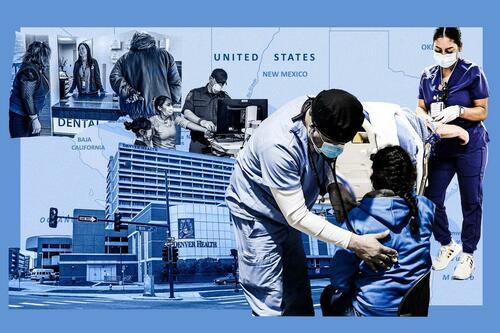
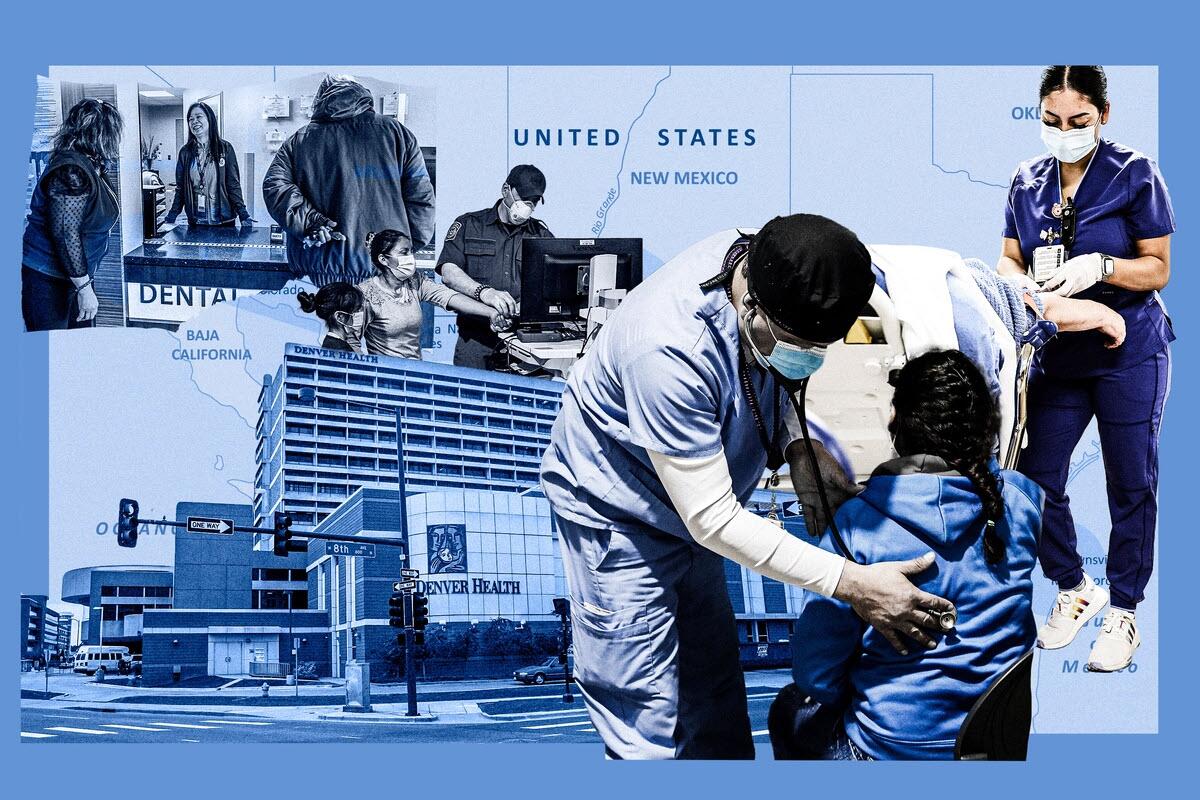
In January, CEO of Denver Health Donna Lynne told reporters that 8,000 illegal immigrants made roughly 20,000 visits to the city’s health system in 2023.
The total bill for uncompensated care costs last year to the system totaled $140 million, said Dane Roper, public information officer for Denver Health. More than $10 million of it was attributed to “care for new immigrants,” he told The Epoch Times.
Though the amount of debt assigned to illegal immigrants is a fraction of the total, uncompensated care costs in the Denver Health system have risen dramatically over the past few years.
The total uncompensated costs in 2020 came to $60 million, Mr. Roper said. In 2022, the number doubled, hitting $120 million.
He also said their city hospitals are treating issues such as “respiratory illnesses, GI [gastro-intenstinal] illnesses, dental disease, and some common chronic illnesses such as asthma and diabetes.”
“The perspective we’ve been trying to emphasize all along is that providing healthcare services for an influx of new immigrants who are unable to pay for their care is adding additional strain to an already significant uncompensated care burden,” Mr. Roper said.
He added this is why a local, state, and federal response to the needs of the new illegal immigrant population is “so important.”
Colorado is far from the only state struggling with a trail of unpaid hospital bills.
Dr. Robert Trenschel, CEO of the Yuma Regional Medical Center situated on the Arizona–Mexico border, said on average, illegal immigrants cost up to three times more in human resources to resolve their cases and provide a safe discharge.
“Some [illegal] migrants come with minor ailments, but many of them come in with significant disease,” Dr. Trenschel said during a congressional hearing last year.
“We’ve had migrant patients on dialysis, cardiac catheterization, and in need of heart surgery. Many are very sick.”
He said many illegal immigrants who enter the country and need medical assistance end up staying in the ICU ward for 60 days or more.
A large portion of the patients are pregnant women who’ve had little to no prenatal treatment. This has resulted in an increase in babies being born that require neonatal care for 30 days or longer.
Dr. Trenschel told The Epoch Times last year that illegal immigrants were overrunning healthcare services in his town, leaving the hospital with $26 million in unpaid medical bills in just 12 months.
ER Duty to Care
The Emergency Medical Treatment and Labor Act of 1986 requires that public hospitals participating in Medicare “must medically screen all persons seeking emergency care … regardless of payment method or insurance status.”
The numbers are difficult to gauge as the policy position of the Centers for Medicare & Medicaid Services (CMS) is that it “will not require hospital staff to ask patients directly about their citizenship or immigration status.”
In southern California, again close to the border with Mexico, some hospitals are struggling with an influx of illegal immigrants.
American patients are enduring longer wait times for doctor appointments due to a nursing shortage in the state, two health care professionals told The Epoch Times in January.
A health care worker at a hospital in Southern California, who asked not to be named for fear of losing her job, told The Epoch Times that “the entire health care system is just being bombarded” by a steady stream of illegal immigrants.
“Our healthcare system is so overwhelmed, and then add on top of that tuberculosis, COVID-19, and other diseases from all over the world,” she said.

A newly-enacted law in California provides free healthcare for all illegal immigrants residing in the state. The law could cost taxpayers between $3 billion and $6 billion per year, according to recent estimates by state and federal lawmakers.
In New York, where the illegal immigration crisis has manifested most notably beyond the southern border, city and state officials have long been accommodating of illegal immigrants’ healthcare costs.
Since June 2014, when then-mayor Bill de Blasio set up The Task Force on Immigrant Health Care Access, New York City has worked to expand avenues for illegal immigrants to get free health care.
“New York City has a moral duty to ensure that all its residents have meaningful access to needed health care, regardless of their immigration status or ability to pay,” Mr. de Blasio stated in a 2015 report.
The report notes that in 2013, nearly 64 percent of illegal immigrants were uninsured. Since then, tens of thousands of illegal immigrants have settled in the city.
“The uninsured rate for undocumented immigrants is more than three times that of other noncitizens in New York City (20 percent) and more than six times greater than the uninsured rate for the rest of the city (10 percent),” the report states.
The report states that because healthcare providers don’t ask patients about documentation status, the task force lacks “data specific to undocumented patients.”
Some health care providers say a big part of the issue is that without a clear path to insurance or payment for non-emergency services, illegal immigrants are going to the hospital due to a lack of options.
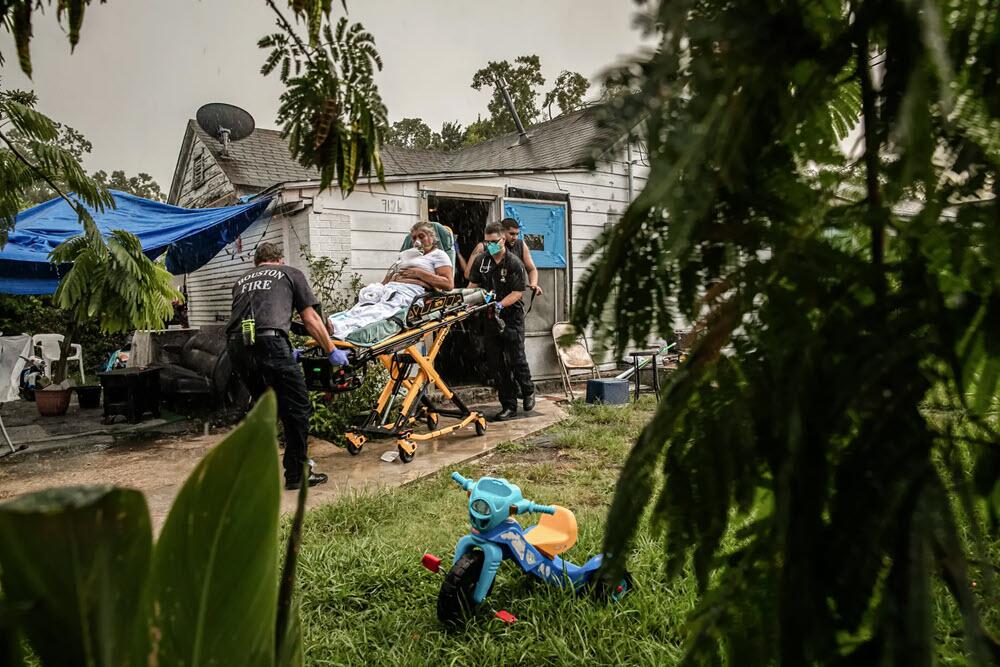
“It’s insane, and it has been for years at this point,” Dana, a Texas emergency room nurse who asked to have her full name omitted, told The Epoch Times.
Working for a major hospital system in the greater Houston area, Dana has seen “a zillion” migrants pass through under her watch with “no end in sight.” She said many who are illegal immigrants arrive with treatable illnesses that require simple antibiotics. “Not a lot of GPs [general practitioners] will see you if you can’t pay and don’t have insurance.”
She said the “undocumented crowd” tends to arrive with a lot of the same conditions. Many find their way to Houston not long after crossing the southern border. Some of the common health issues Dana encounters include dehydration, unhealed fractures, respiratory illnesses, stomach ailments, and pregnancy-related concerns.
“This isn’t a new problem, it’s just worse now,” Dana said.
Medicaid Factor
One of the main government healthcare resources illegal immigrants use is Medicaid.
All those who don’t qualify for regular Medicaid are eligible for Emergency Medicaid, regardless of immigration status. By doing this, the program helps pay for the cost of uncompensated care bills at qualifying hospitals.
However, some loopholes allow access to the regular Medicaid benefits. “Qualified noncitizens” who haven’t been granted legal status within five years still qualify if they’re listed as a refugee, an asylum seeker, or a Cuban or Haitian national.
Yet the lion’s share of Medicaid usage by illegal immigrants still comes through state-level benefits and emergency medical treatment.
A Congressional report highlighted data from the CMS, which showed total Medicaid costs for “emergency services for undocumented aliens” in fiscal year 2021 surpassed $7 billion, and totaled more than $5 billion in fiscal 2022.
Both years represent a significant spike from the $3 billion in fiscal 2020.
An employee working with Medicaid who asked to be referred to only as Jennifer out of concern for her job, told The Epoch Times that at a state level, it’s easy for an illegal immigrant to access the program benefits.
Jennifer said that when exceptions are sent from states to CMS for approval, “denial is actually super rare. It’s usually always approved.”
She also said it comes as no surprise that many of the states with the highest amount of Medicaid spending are sanctuary states, which tend to have policies and laws that shield illegal immigrants from federal immigration authorities.
Moreover, Jennifer said there are ways for states to get around CMS guidelines. “It’s not easy, but it can and has been done.”
The first generation of illegal immigrants who arrive to the United States tend to be healthy enough to pass any pre-screenings, but Jennifer has observed that the subsequent generations tend to be sicker and require more access to care. If a family is illegally present, they tend to use Emergency Medicaid or nothing at all.
The Epoch Times asked Medicaid Services to provide the most recent data for the total uncompensated care that hospitals have reported. The agency didn’t respond.
Continue reading over at The Epoch Times
Uncategorized
Fast-food chain closes restaurants after Chapter 11 bankruptcy
Several major fast-food chains recently have struggled to keep restaurants open.
Share this:


Competition in the fast-food space has been brutal as operators deal with inflation, consumers who are worried about the economy and their jobs and, in recent months, the falling cost of eating at home.
Add in that many fast-food chains took on more debt during the covid pandemic and that labor costs are rising, and you have a perfect storm of problems.
It's a situation where Restaurant Brands International (QSR) has suffered as much as any company.
Related: Wendy's menu drops a fan favorite item, adds something new
Three major Burger King franchise operators filed for bankruptcy in 2023, and the chain saw hundreds of stores close. It also saw multiple Popeyes franchisees move into bankruptcy, with dozens of locations closing.
RBI also stepped in and purchased one of its key franchisees.
"Carrols is the largest Burger King franchisee in the United States today, operating 1,022 Burger King restaurants in 23 states that generated approximately $1.8 billion of system sales during the 12 months ended Sept. 30, 2023," RBI said in a news release. Carrols also owns and operates 60 Popeyes restaurants in six states."
The multichain company made the move after two of its large franchisees, Premier Kings and Meridian, saw multiple locations not purchased when they reached auction after Chapter 11 bankruptcy filings. In that case, RBI bought select locations but allowed others to close.

Image source: Chen Jianli/Xinhua via Getty
Another fast-food chain faces bankruptcy problems
Bojangles may not be as big a name as Burger King or Popeye's, but it's a popular chain with more than 800 restaurants in eight states.
"Bojangles is a Carolina-born restaurant chain specializing in craveable Southern chicken, biscuits and tea made fresh daily from real recipes, and with a friendly smile," the chain says on its website. "Founded in 1977 as a single location in Charlotte, our beloved brand continues to grow nationwide."
Like RBI, Bojangles uses a franchise model, which makes it dependent on the financial health of its operators. The company ultimately saw all its Maryland locations close due to the financial situation of one of its franchisees.
Unlike. RBI, Bojangles is not public — it was taken private by Durational Capital Management LP and Jordan Co. in 2018 — which means the company does not disclose its financial information to the public.
That makes it hard to know whether overall softness for the brand contributed to the chain seeing its five Maryland locations after a Chapter 11 bankruptcy filing.
Bojangles has a messy bankruptcy situation
Even though the locations still appear on the Bojangles website, they have been shuttered since late 2023. The locations were operated by Salim Kakakhail and Yavir Akbar Durranni. The partners operated under a variety of LLCs, including ABS Network, according to local news channel WUSA9.
The station reported that the owners face a state investigation over complaints of wage theft and fraudulent W2s. In November Durranni and ABS Network filed for bankruptcy in New Jersey, WUSA9 reported.
"Not only do former employees say these men owe them money, WUSA9 learned the former owners owe the state, too, and have over $69,000 in back property taxes."
Former employees also say that the restaurant would regularly purchase fried chicken from Popeyes and Safeway when it ran out in their stores, the station reported.
Bojangles sent the station a comment on the situation.
"The franchisee is no longer in the Bojangles system," the company said. "However, it is important to note in your coverage that franchisees are independent business owners who are licensed to operate a brand but have autonomy over many aspects of their business, including hiring employees and payroll responsibilities."
Kakakhail and Durranni did not respond to multiple requests for comment from WUSA9.
bankruptcy pandemicUncategorized
Industrial Production Increased 0.1% in February
From the Fed: Industrial Production and Capacity Utilization
Industrial production edged up 0.1 percent in February after declining 0.5 percent in January. In February, the output of manufacturing rose 0.8 percent and the index for mining climbed 2.2 p…
Share this:


Industrial production edged up 0.1 percent in February after declining 0.5 percent in January. In February, the output of manufacturing rose 0.8 percent and the index for mining climbed 2.2 percent. Both gains partly reflected recoveries from weather-related declines in January. The index for utilities fell 7.5 percent in February because of warmer-than-typical temperatures. At 102.3 percent of its 2017 average, total industrial production in February was 0.2 percent below its year-earlier level. Capacity utilization for the industrial sector remained at 78.3 percent in February, a rate that is 1.3 percentage points below its long-run (1972–2023) average.Click on graph for larger image.
emphasis added
This graph shows Capacity Utilization. This series is up from the record low set in April 2020, and above the level in February 2020 (pre-pandemic).
Capacity utilization at 78.3% is 1.3% below the average from 1972 to 2022. This was below consensus expectations.
Note: y-axis doesn't start at zero to better show the change.
 The second graph shows industrial production since 1967.
Industrial production increased to 102.3. This is above the pre-pandemic level.
Industrial production was above consensus expectations.


Key shipping company files for Chapter 11 bankruptcy


Net Zero, The Digital Panopticon, & The Future Of Food


Pharma industry reputation remains steady at a ‘new normal’ after Covid, Harris Poll finds


These Cities Have The Highest (And Lowest) Share Of Unaffordable Neighborhoods In 2024


Problems After COVID-19 Vaccination More Prevalent Among Naturally Immune: Study


For-profit nursing homes are cutting corners on safety and draining resources with financial shenanigans − especially at midsize chains that dodge public scrutiny


Part 1: Current State of the Housing Market; Overview for mid-March 2024


‘Excess Mortality Skyrocketed’: Tucker Carlson and Dr. Pierre Kory Unpack ‘Criminal’ COVID Response


Tight inventory and frustrated buyers challenge agents in Virginia


The Question You Should Ask Whenever You’re Wrong
-

 Uncategorized3 weeks ago
All Of The Elements Are In Place For An Economic Crisis Of Staggering Proportions
-

 International1 week ago
EyePoint poaches medical chief from Apellis; Sandoz CFO, longtime BioNTech exec to retire
-

 Uncategorized4 weeks ago
California Counties Could Be Forced To Pay $300 Million To Cover COVID-Era Program
-

 Uncategorized3 weeks ago
Apparel Retailer Express Moving Toward Bankruptcy
-

 Uncategorized4 weeks ago
Industrial Production Decreased 0.1% in January
-

 International1 week ago
Walmart launches clever answer to Target’s new membership program
-

 Spread & Containment2 days ago
IFM’s Hat Trick and Reflections On Option-To-Buy M&A
-

 Uncategorized4 weeks ago
RFK Jr: The Wuhan Cover-Up & The Rise Of The Biowarfare-Industrial Complex