CHICAGO, Jan. 5, 2023 /PRNewswire/ -- Today Conagra Brands, Inc. (NYSE: CAG) reported results for the second quarter of fiscal year 2023, which ended on November 27, 2022. All comparisons are against the prior-year fiscal period, unless otherwise noted.
Highlights
- Second quarter net sales increased 8.3%; organic net sales increased 8.6%
- Operating margin increased 320 basis points in the quarter to 16.6%; adjusted operating margin increased 237 basis points to 17.0%
- Diluted earnings per share (EPS) for the second quarter increased 38.6% to $0.79, and adjusted EPS increased 26.6% to $0.81
- The company is raising its fiscal 2023 guidance to reflect:
- Organic net sales growth of 7% to 8% compared to fiscal 2022
- Adjusted operating margin between 15.3% and 15.6%
- Adjusted EPS between $2.60 and $2.70 representing growth of 10% to 14% compared to fiscal 2022
CEO Perspective
Sean Connolly, president and chief executive officer of Conagra Brands, commented, "Our second quarter results reflect the ongoing strength of our brands and successful execution of the Conagra Way playbook as evidenced by our robust top-line growth, margin recovery, and earnings results. Our decisive actions to offset inflation coupled with improved service levels and productivity allowed us to successfully navigate ongoing inflationary pressures and industry-wide supply chain challenges as each segment delivered adjusted operating margin expansion in the quarter."
He continued, "We are raising our fiscal 2023 guidance on all metrics - organic net sales growth, adjusted operating margin, and adjusted earnings per share due to continued positive business momentum and our strong first half performance. Looking ahead, we remain committed to executing on our strategic business priorities, including strengthening the balance sheet, as we continue our focus on generating value for our shareholders."
Total Company Second Quarter Results
In the quarter, net sales increased 8.3% to $3.3 billion. The increase in net sales primarily reflects:
- a 0.3% decrease from the unfavorable impact of foreign exchange; and
- an 8.6% increase in organic net sales.
The 8.6% increase in organic net sales was driven by a 17.0% improvement in price/mix, which was partially offset by an 8.4% decrease in volume. Price/mix was driven by the company's inflation-driven pricing actions that were reflected in the marketplace throughout the quarter. The volume decrease was primarily a result of the elasticity impact from inflation-driven pricing actions; however, the elasticity impact was favorable to expectations.
Gross profit increased 22.2% to $922 million in the quarter, and adjusted gross profit increased 21.7% to $933 million. Second quarter gross profit benefited from higher organic net sales and productivity, which more than offset the negative impacts of cost of goods sold inflation (including unfavorable commodity positions), unfavorable operating leverage, and continued elevated supply chain operating costs. Gross margin increased 316 basis points to 27.8% in the quarter, and adjusted gross margin increased 310 basis points to 28.2%.
Selling, general, and administrative expense (SG&A), which includes advertising and promotional expense (A&P), increased 7.9% to $373 million in the quarter and adjusted SG&A, which excludes A&P, increased 17.5% to $291 million driven by increased incentive compensation compared to the prior year quarter.
A&P for the quarter increased 10.3% to $79 million, driven primarily by increased investment in modern marketing, including social and digital platforms.
Net interest expense was $100 million in the quarter. Compared to the prior-year period, net interest expense increased 5.7% or $5 million, primarily due to a higher weighted average interest rate on outstanding debt.
The average diluted share count in the quarter was 481 million shares. During the second quarter, the company repurchased approximately 2.8 million shares of its common stock for approximately $100 million.
In the quarter, net income attributable to Conagra Brands increased 38.6% to $382 million, or $0.79 per diluted share. Adjusted net income attributable to Conagra Brands increased 27.9% to $392 million, or $0.81 per diluted share. The increase was driven primarily by the increase in gross profit and a strong performance from the company's Ardent Mills joint venture.
Adjusted EBITDA, which includes equity method investment earnings and pension and postretirement non-service income, increased 21.5% to $710 million in the quarter, primarily driven by the increase in adjusted gross profit and a strong performance from the company's Ardent Mills joint venture, slightly offset by lower pension income.
Grocery & Snacks Segment Second Quarter Results
Reported and organic net sales for the Grocery & Snacks segment increased 6.8% to $1.3 billion in the quarter.
In the quarter, price/mix increased 18.4% and volume decreased 11.6%. Price/mix was driven by favorability in inflation-driven pricing. The volume decrease was primarily a result of the elasticity impact from inflation-driven pricing actions. In the quarter, the company gained share in snacking categories including meat snacks and microwave popcorn, and staples categories including refried beans and canned meat.
Operating profit for the segment increased 36.6% to $340 million in the quarter. Adjusted operating profit increased 24.7% to $341 million as higher organic net sales and productivity more than offset the negative impacts of cost of goods sold inflation (including unfavorable commodity positions), unfavorable operating leverage, continued elevated supply chain costs, and increased SG&A.
Refrigerated & Frozen Segment Second Quarter Results
Reported and organic net sales for the Refrigerated & Frozen segment increased 10.5% to $1.4 billion in the quarter.
In the quarter, price mix increased 16.0% and volume decreased 5.5%. The price/mix increase was driven by favorability in inflation-driven pricing. The volume decrease was primarily a result of the elasticity impact from inflation-driven pricing actions. In the quarter, the company gained share in categories such as frozen single serve meals, plant-based protein, and frozen breakfast.
Operating profit for the segment increased 48.6% to $250 million in the quarter. Adjusted operating profit increased 37.1% to $259 million as higher organic net sales and productivity more than offset the negative impacts of cost of goods sold inflation (including unfavorable commodity positions), continued elevated supply chain operating costs, increased SG&A, and unfavorable operating leverage.
International Segment Second Quarter Results
Net sales for the International segment decreased 1.3% to $259 million in the quarter reflecting:
- a 3.4% decrease from the unfavorable impact of foreign exchange; and
- a 2.1% increase in organic net sales.
On an organic net sales basis, price/mix increased 12.8% and volume decreased 10.7%. The price/mix increase was driven by inflation-driven pricing. The volume decrease was primarily a result of the elasticity impact from inflation-driven pricing actions.
Operating profit for the segment decreased 0.6% to $37 million in the quarter. Adjusted operating profit decreased 0.9% to $37 million as the benefits from higher organic net sales and productivity were more than offset by the negative impact of cost of goods sold inflation (including unfavorable commodity positions) and unfavorable operating leverage.
Foodservice Segment Second Quarter Results
Reported and organic net sales for the Foodservice segment increased 14.8% to $283 million in the quarter.
In the quarter, price/mix increased 18.2% and volume decreased 3.4%. The price/mix increase was driven by inflation-driven pricing. The volume decline was primarily a result of the elasticity impact from inflation-driven pricing actions.
Operating profit for the segment increased 106.5% to $29 million and adjusted operating profit increased 53.4% to $29 million in the quarter as the benefits of higher organic net sales and productivity more than offset the impacts of cost of goods sold inflation (including unfavorable commodity positions) and unfavorable operating leverage.
Other Second Quarter Items
Corporate expenses increased 80.2% to $107 million in the quarter and adjusted corporate expense increased 44.4% to $102 million in the quarter driven by increased incentive compensation compared to the prior year quarter.
Pension and post-retirement non-service income was $6 million in the quarter compared to $16 million of income in the prior-year period.
In the quarter, equity method investment earnings were $49 million. The $20 million increase was primarily driven by favorable market conditions for the Ardent Mills joint venture, and the venture's effective management through recent volatility in the wheat markets.
In the quarter, the effective tax rate was 24.3% compared to 23.4% in the prior-year period. The adjusted effective tax rate was 24.3% compared to 22.9% in the prior-year period.
In the quarter, the company paid a dividend of $0.33 per share.
Outlook
Due to a strong performance in the first half of the fiscal year, the company is raising its full year outlook for fiscal 2023. The company continues to plan for supply chain inefficiencies tied to the dynamic operating environment and also expects both gross inflation (input cost inflation before the impacts of hedging and other sourcing benefits) and results from its Ardent Mills joint venture to moderate through the remainder of the fiscal year.
The company's updated fiscal 2023 guidance is as follows:
- Organic net sales growth is expected to be 7% to 8% compared to fiscal 2022
- Adjusted operating margin is expected to be between 15.3% and 15.6%
- Adjusted EPS is expected to be between $2.60 and $2.70, representing growth of 10% to 14% compared to fiscal 2022
- Capital expenditures of approximately $425M
- Interest expense of approximately $405M
- Adjusted effective tax rate of approximately 24%
- Pension income of approximately $25M
The inability to predict the amount and timing of the impacts of foreign exchange, acquisitions, divestitures, and other items impacting comparability makes a detailed reconciliation of forward-looking non-GAAP financial measures impracticable. Please see the end of this release for more information.
Items Affecting Comparability of EPS
The following are included in the $0.79 EPS for the second quarter of fiscal 2023 (EPS amounts are rounded and after tax). Please see the reconciliation schedules at the end of this release for additional details.
- Approximately $0.01 per diluted share of net expense due to fire related costs
- Approximately $0.01 per diluted share of net expense related to rounding
The following are included in the $0.57 EPS for the second quarter of fiscal 2022 (EPS amounts are rounded and after tax). Please see the reconciliation schedules at the end of this release for additional details.
- Approximately $0.02 per diluted share of net expense related to restructuring plans
- Approximately $0.07 per diluted share of net expense related to impairment of businesses held for sale
- Approximately $0.01 per diluted share of net benefit related to proceeds received from the sale of a legacy investment
- Approximately $0.02 per diluted share of net benefit related to legal matters
- Approximately $0.01 per diluted share of net expense related to rounding
Please note that certain prior year amounts have been reclassified to conform with current year presentation.
Discussion of Results
Conagra Brands will host a webcast and conference call at 9:30 a.m. Eastern time today to discuss the results. The live audio webcast and presentation slides will be available on www.conagrabrands.com/investor-relations under Events & Presentations. The conference call may be accessed by dialing 1-877-883-0383 for participants in the U.S. and 1-412-902-6506 for all other participants and using passcode 8026468. Please dial in 10 to 15 minutes prior to the call start time. Following the company's remarks, the conference call will include a question-and-answer session with the investment community. A replay of the webcast will be available on www.conagrabrands.com/investor-relations under Events & Presentations until January 5, 2024.
About Conagra Brands
Conagra Brands, Inc. (NYSE: CAG), headquartered in Chicago, is one of North America's leading branded food companies. Guided by an entrepreneurial spirit, Conagra Brands combines a rich heritage of making great food with a sharpened focus on innovation. The company's portfolio is evolving to satisfy people's changing food preferences. Conagra's iconic brands, such as Birds Eye®, Marie Callender's®, Banquet®, Healthy Choice®, Slim Jim®, Reddi-wip®, and Vlasic®, as well as emerging brands, including Angie's® BOOMCHICKAPOP®, Duke's®, Earth Balance®, Gardein®, and Frontera®, offer choices for every occasion. For more information, visit www.conagrabrands.com.
Note on Forward-Looking Statements
This document contains forward-looking statements within the meaning of the federal securities laws. These forward-looking statements are based on management's current expectations and are subject to uncertainty and changes in circumstances. Readers of this document should understand that these statements are not guarantees of performance or results. Many factors could affect our actual financial results and cause them to vary materially from the expectations contained in the forward-looking statements, including those set forth in this document. These risks, uncertainties, and factors include, among other things: the risk that the cost savings and any other synergies from the acquisition of Pinnacle Foods Inc. (the Pinnacle acquisition) may not be fully realized or may take longer to realize than expected; the risk that the Pinnacle acquisition may not be accretive within the expected timeframe or to the extent anticipated; the risks that the Pinnacle acquisition and related integration will create disruption to the company and its management and impede the achievement of business plans; risks related to our ability to achieve the intended benefits of other recent acquisitions and divestitures; risks associated with general economic and industry conditions; risks associated with our ability to successfully execute our long-term value creation strategies; risks related to our ability to deleverage on currently anticipated timelines, and to continue to access capital on acceptable terms or at all; risks related to our ability to execute operating and restructuring plans and achieve targeted operating efficiencies from cost-saving initiatives, and to benefit from trade optimization programs; risks related to the effectiveness of our hedging activities and ability to respond to volatility in commodities; risks related to the company's competitive environment and related market conditions; risks related to our ability to respond to changing consumer preferences and the success of our innovation and marketing investments; risks related to the ultimate impact of any product recalls and litigation, including litigation related to the lead paint and pigment matters, as well as any securities litigation, including securities class action lawsuits; risk associated with actions of governments and regulatory bodies that affect our businesses, including the ultimate impact of new or revised regulations or interpretations; risks related to the impact of the COVID-19 pandemic on our business, suppliers, consumers, customers and employees; risks related to our forecasts of consumer eat-at-home habits as the impacts of the COVID-19 pandemic abate; risks related to the availability and prices of supply chain resources, including raw materials, packaging, and transportation including any negative effects caused by changes in inflation rates, weather conditions, or health pandemics or outbreaks of disease, actual or threatened hostilities or war, or other geopolitical uncertainty; disruptions or inefficiencies in our supply chain and/or operations, including from the COVID-19 pandemic; risks related to disruptions in the global economy caused by the ongoing conflict between Russia and Ukraine; risks associated with actions by our customers, including changes in distribution and purchasing terms; risks and uncertainties associated with intangible assets, including any future goodwill or intangible assets impairment charges; risks related to a material failure in or breach of our or our vendors' information technology systems; the amount and timing of future dividends, which remain subject to Board approval and depend on market and other conditions; risks related to the company's ability to execute on its strategies or achieve expectations related to environmental, social, and governance matters, including as a result of evolving legal, regulatory, and other standards, processes, and assumptions, the pace of scientific and technological developments, increased costs, the availability of requisite financing, and changes in carbon markets, and other risks described in our reports filed from time to time with the Securities and Exchange Commission. We caution readers not to place undue reliance on any forward-looking statements included in this document, which speak only as of the date of this document. We undertake no responsibility to update these statements, except as required by law.
Note on Non-GAAP Financial Measures
This document includes certain non-GAAP financial measures, including adjusted EPS, organic net sales, adjusted gross profit, adjusted operating profit, adjusted SG&A, adjusted corporate expenses, adjusted gross margin, adjusted operating margin, adjusted effective tax rate, adjusted net income attributable to Conagra Brands, free cash flow, net debt, net leverage ratio, and adjusted EBITDA. Management considers GAAP financial measures as well as such non-GAAP financial information in its evaluation of the company's financial statements and believes these non-GAAP financial measures provide useful supplemental information to assess the company's operating performance and financial position. These measures should be viewed in addition to, and not in lieu of, the company's diluted earnings per share, operating performance and financial measures as calculated in accordance with GAAP.
Organic net sales excludes, from reported net sales, the impacts of foreign exchange, divested businesses and acquisitions, as well as the impact of any 53rd week. All references to changes in volume and price/mix throughout this release are on an organic net sales basis.
References to adjusted items throughout this release refer to measures computed in accordance with GAAP less the impact of items impacting comparability. Items impacting comparability are income or expenses (and related tax impacts) that management believes have had, or are likely to have, a significant impact on the earnings of the applicable business segment or on the total corporation for the period in which the item is recognized, and are not indicative of the company's core operating results. These items thus affect the comparability of underlying results from period to period.
References to earnings before interest, taxes, depreciation, and amortization (EBITDA) refer to net income attributable to Conagra Brands before the impacts of discontinued operations, income tax expense (benefit), interest expense, depreciation, and amortization. References to adjusted EBITDA refer to EBITDA before the impacts of items impacting comparability.
Hedge gains and losses are generally aggregated, and net amounts are reclassified from unallocated corporate expense to the operating segments when the underlying commodity or foreign currency being hedged is expensed in segment cost of goods sold. The net change in the derivative gains (losses) included in unallocated corporate expense during the period is reflected as a comparability item, Corporate hedging derivate gains (losses).
Note on Forward-Looking Non-GAAP Financial Measures
Our fiscal 2023 guidance includes certain non-GAAP financial measures (organic net sales growth, adjusted operating margin, adjusted EPS, and adjusted effective tax rate) that are presented on a forward-looking basis. Historically, the company has calculated these non-GAAP financial measures excluding the impact of certain items such as, but not limited to, foreign exchange, acquisitions, divestitures, restructuring expenses, the extinguishment of debt, hedging gains and losses, impairment charges, legacy legal contingencies, and unusual tax items. Reconciliations of these forward-looking non-GAAP financial measures to the most directly comparable GAAP financial measures are not provided because the company is unable to provide such reconciliations without unreasonable effort, due to the uncertainty and inherent difficulty of predicting the timing and financial impact of such items. For the same reasons, the company is unable to address the probable significance of the unavailable information, which could be material to future results.
Conagra Brands, Inc.
|
Consolidated Statements of Earnings
|
(in millions)
|
(unaudited)
|
|
|
| SECOND QUARTER
|
|
|
| Thirteen Weeks
Ended
|
|
| Thirteen Weeks
Ended
|
|
|
|
|
|
|
| November 27,
2022
|
|
| November 28,
2021
|
|
| Percent Change
|
|
Net sales
|
| $
| 3,312.9
|
|
| $
| 3,058.9
|
|
|
| 8.3
| %
|
Costs and expenses:
|
|
|
|
|
|
|
|
|
|
|
|
|
Cost of goods sold
|
|
| 2,390.6
|
|
|
| 2,304.1
|
|
|
| 3.8
| %
|
Selling, general and administrative expenses
|
|
| 372.7
|
|
|
| 345.4
|
|
|
| 7.9
| %
|
Pension and postretirement non-service income
|
|
| (6.1)
|
|
|
| (16.1)
|
|
|
| (62.2)
| %
|
Interest expense, net
|
|
| 100.3
|
|
|
| 94.9
|
|
|
| 5.7
| %
|
Income before income taxes and equity method investment earnings
|
|
| 455.4
|
|
|
| 330.6
|
|
|
| 37.7
| %
|
Income tax expense
|
|
| 122.5
|
|
|
| 84.2
|
|
|
| 45.4
| %
|
Equity method investment earnings
|
|
| 49.3
|
|
|
| 29.5
|
|
|
| 67.2
| %
|
Net income
|
| $
| 382.2
|
|
| $
| 275.9
|
|
|
| 38.5
| %
|
Less: Net income attributable to noncontrolling interests
|
|
| 0.3
|
|
|
| 0.4
|
|
|
| (28.1)
| %
|
Net income attributable to Conagra Brands, Inc.
|
| $
| 381.9
|
|
| $
| 275.5
|
|
|
| 38.6
| %
|
|
|
|
|
|
|
|
|
|
|
|
|
|
Earnings per share - basic
|
|
|
|
|
|
|
|
|
|
|
|
|
Net income attributable to Conagra Brands, Inc.
|
| $
| 0.80
|
|
| $
| 0.57
|
|
|
| 40.4
| %
|
Weighted average shares outstanding
|
|
| 479.4
|
|
|
| 480.2
|
|
|
| (0.2)
| %
|
|
|
|
|
|
|
|
|
|
|
|
|
|
Earnings per share - diluted
|
|
|
|
|
|
|
|
|
|
|
|
|
Net income attributable to Conagra Brands, Inc.
|
| $
| 0.79
|
|
| $
| 0.57
|
|
|
| 38.6
| %
|
Weighted average share and share equivalents outstanding
|
|
| 480.9
|
|
|
| 481.9
|
|
|
| (0.2)
| %
|
Conagra Brands, Inc.
|
Consolidated Statements of Earnings
|
(in millions)
|
(unaudited)
|
|
|
| SECOND QUARTER YEAR TO DATE
|
|
|
| Twenty-Six
Weeks Ended
|
|
| Twenty-Six
Weeks Ended
|
|
|
|
|
|
|
| November 27,
2022
|
|
| November 28,
2021
|
|
| Percent Change
|
|
Net sales
|
| $
| 6,217.2
|
|
| $
| 5,712.2
|
|
|
| 8.8
| %
|
Costs and expenses:
|
|
|
|
|
|
|
|
|
|
|
|
|
Cost of goods sold
|
|
| 4,574.6
|
|
|
| 4,284.0
|
|
|
| 6.8
| %
|
Selling, general and administrative expenses
|
|
| 1,114.3
|
|
|
| 655.5
|
|
|
| 70.0
| %
|
Pension and postretirement non-service income
|
|
| (12.2)
|
|
|
| (32.2)
|
|
|
| (62.2)
| %
|
Interest expense, net
|
|
| 197.4
|
|
|
| 189.1
|
|
|
| 4.3
| %
|
Income before income taxes and equity method investment earnings
|
|
| 343.1
|
|
|
| 615.8
|
|
|
| (44.3)
| %
|
Income tax expense
|
|
| 136.9
|
|
|
| 153.9
|
|
|
| (11.1)
| %
|
Equity method investment earnings
|
|
| 98.5
|
|
|
| 49.7
|
|
|
| 98.1
| %
|
Net income
|
| $
| 304.7
|
|
| $
| 511.6
|
|
|
| (40.4)
| %
|
Less: Net income attributable to noncontrolling interests
|
|
| 0.3
|
|
|
| 0.7
|
|
|
| (58.0)
| %
|
Net income attributable to Conagra Brands, Inc.
|
| $
| 304.4
|
|
| $
| 510.9
|
|
|
| (40.4)
| %
|
|
|
|
|
|
|
|
|
|
|
|
|
|
Earnings per share - basic
|
|
|
|
|
|
|
|
|
|
|
|
|
Net income attributable to Conagra Brands, Inc.
|
| $
| 0.63
|
|
| $
| 1.06
|
|
|
| (40.6)
| %
|
Weighted average shares outstanding
|
|
| 480.0
|
|
|
| 480.3
|
|
|
| (0.1)
| %
|
|
|
|
|
|
|
|
|
|
|
|
|
|
Earnings per share - diluted
|
|
|
|
|
|
|
|
|
|
|
|
|
Net income attributable to Conagra Brands, Inc.
|
| $
| 0.63
|
|
| $
| 1.06
|
|
|
| (40.6)
| %
|
Weighted average share and share equivalents outstanding
|
|
| 481.6
|
|
|
| 482.1
|
|
|
| (0.1)
| %
|
Conagra Brands, Inc.
|
Consolidated Balance Sheets
|
(in millions)
|
(unaudited)
|
|
|
| November 27, 2022
|
|
| May 29, 2022
|
|
ASSETS
|
|
|
|
|
|
|
|
|
Current assets
|
|
|
|
|
|
|
|
|
Cash and cash equivalents
|
| $
| 39.7
|
|
| $
| 83.3
|
|
Receivables, less allowance for doubtful accounts of $3.7 and $3.9
|
|
| 910.5
|
|
|
| 867.4
|
|
Inventories
|
|
| 2,347.7
|
|
|
| 1,966.7
|
|
Prepaid expenses and other current assets
|
|
| 118.5
|
|
|
| 116.3
|
|
Total current assets
|
|
| 3,416.4
|
|
|
| 3,033.7
|
|
Property, plant and equipment, net
|
|
| 2,688.2
|
|
|
| 2,737.2
|
|
Goodwill
|
|
| 11,180.1
|
|
|
| 11,329.2
|
|
Brands, trademarks and other intangibles, net
|
|
| 3,579.0
|
|
|
| 3,857.8
|
|
Other assets
|
|
| 1,550.3
|
|
|
| 1,477.2
|
|
|
| $
| 22,414.0
|
|
| $
| 22,435.1
|
|
LIABILITIES AND STOCKHOLDERS' EQUITY
|
|
|
|
|
|
|
|
|
Current liabilities
|
|
|
|
|
|
|
|
|
Notes payable
|
| $
| 365.5
|
|
| $
| 184.3
|
|
Current installments of long-term debt
|
|
| 954.3
|
|
|
| 707.3
|
|
Accounts payable
|
|
| 1,596.3
|
|
|
| 1,864.6
|
|
Accrued payroll
|
|
| 119.4
|
|
|
| 151.7
|
|
Other accrued liabilities
|
|
| 687.2
|
|
|
| 610.9
|
|
Total current liabilities
|
|
| 3,722.7
|
|
|
| 3,518.8
|
|
Senior long-term debt, excluding current installments
|
|
| 8,081.8
|
|
|
| 8,088.2
|
|
Other noncurrent liabilities
|
|
| 1,871.8
|
|
|
| 1,965.9
|
|
Total stockholders' equity
|
|
| 8,737.7
|
|
|
| 8,862.2
|
|
|
| $
| 22,414.0
|
|
| $
| 22,435.1
|
|
Conagra Brands, Inc. and Subsidiaries
|
Condensed Consolidated Statements of Cash Flows
|
(in millions)
|
(unaudited)
|
|
|
| Twenty-Six
Weeks Ended
|
|
| Twenty-Six
Weeks Ended
|
|
|
| November 27,
2022
|
|
| November 28,
2021
|
|
Cash flows from operating activities:
|
|
|
|
|
|
|
|
|
Net income
|
| $
| 304.7
|
|
| $
| 511.6
|
|
Adjustments to reconcile net income to net cash flows from operating activities:
|
|
|
|
|
|
|
|
|
Depreciation and amortization
|
|
| 185.5
|
|
|
| 193.5
|
|
Asset impairment charges
|
|
| 413.7
|
|
|
| 41.6
|
|
Equity method investment earnings in excess of distributions
|
|
| (55.6)
|
|
|
| (24.2)
|
|
Stock-settled share-based payments expense
|
|
| 59.0
|
|
|
| 14.3
|
|
Contributions to pension plans
|
|
| (5.9)
|
|
|
| (4.9)
|
|
Pension benefit
|
|
| (6.9)
|
|
|
| (25.5)
|
|
Other items
|
|
| (4.5)
|
|
|
| (14.5)
|
|
Change in operating assets and liabilities excluding effects of business acquisitions
and dispositions:
|
|
|
|
|
|
|
|
|
Receivables
|
|
| (46.1)
|
|
|
| (183.3)
|
|
Inventories
|
|
| (380.9)
|
|
|
| (148.4)
|
|
Deferred income taxes and income taxes payable, net
|
|
| (39.4)
|
|
|
| (13.9)
|
|
Prepaid expenses and other current assets
|
|
| (13.8)
|
|
|
| (10.4)
|
|
Accounts payable
|
|
| (109.8)
|
|
|
| (14.1)
|
|
Accrued payroll
|
|
| (32.2)
|
|
|
| (60.6)
|
|
Other accrued liabilities
|
|
| 30.0
|
|
|
| 0.9
|
|
Net cash flows from operating activities
|
|
| 297.8
|
|
|
| 262.1
|
|
Cash flows from investing activities:
|
|
|
|
|
|
|
|
|
Additions to property, plant and equipment
|
|
| (188.4)
|
|
|
| (257.5)
|
|
Sale of property, plant and equipment
|
|
| 2.4
|
|
|
| 9.9
|
|
Purchase of marketable securities
|
|
| (1.6)
|
|
|
| (1.9)
|
|
Sale of marketable securities
|
|
| 1.6
|
|
|
| 1.9
|
|
Proceeds from divestitures
|
|
| —
|
|
|
| 0.1
|
|
Other items
|
|
| 4.1
|
|
|
| 3.3
|
|
Net cash flows from investing activities
|
|
| (181.9)
|
|
|
| (244.2)
|
|
Cash flows from financing activities:
|
|
|
|
|
|
|
|
|
Issuances of short-term borrowings, maturities greater than 90 days
|
|
| 172.2
|
|
|
| 392.6
|
|
Repayment of short-term borrowings, maturities greater than 90 days
|
|
| (168.8)
|
|
|
| (249.8)
|
|
Net issuance (repayment) of other short-term borrowings
|
|
| 72.0
|
|
|
| (264.4)
|
|
Issuance of long-term debt
|
|
| 500.0
|
|
|
| 499.1
|
|
Repayment of long-term debt
|
|
| (265.8)
|
|
|
| (29.4)
|
|
Debt issuance costs
|
|
| (4.0)
|
|
|
| (2.5)
|
|
Repurchase of Conagra Brands, Inc. common shares
|
|
| (150.0)
|
|
|
| (50.0)
|
|
Payment of intangible asset financing arrangement
|
|
| —
|
|
|
| (12.6)
|
|
Cash dividends paid
|
|
| (308.6)
|
|
|
| (282.0)
|
|
Exercise of stock options and issuance of other stock awards, including tax withholdings
|
|
| (5.7)
|
|
|
| (17.4)
|
|
Other items
|
|
| 1.3
|
|
|
| (7.3)
|
|
Net cash flows from financing activities
|
|
| (157.4)
|
|
|
| (23.7)
|
|
Effect of exchange rate changes on cash and cash equivalents and restricted cash
|
|
| (2.1)
|
|
|
| (5.7)
|
|
Net change in cash and cash equivalents and restricted cash
|
|
| (43.6)
|
|
|
| (11.5)
|
|
Cash and cash equivalents and restricted cash at beginning of period
|
|
| 83.3
|
|
|
| 80.2
|
|
Cash and cash equivalents and restricted cash at end of period
|
| $
| 39.7
|
|
| $
| 68.7
|
|
Conagra Brands, Inc.
|
Reconciliation of Non-GAAP Financial Measures to Reported Financial Measures
|
(in millions)
|
|
Q2 FY23
|
| Grocery &
Snacks
|
|
| Refrigerated
& Frozen
|
|
| International
|
|
| Foodservice
|
|
| Total
Conagra
Brands
|
|
Net Sales
|
| $
| 1,349.9
|
|
| $
| 1,421.5
|
|
| $
| 258.7
|
|
| $
| 282.8
|
|
| $
| 3,312.9
|
|
Impact of foreign exchange
|
|
| —
|
|
|
| —
|
|
|
| 8.9
|
|
|
| —
|
|
|
| 8.9
|
|
Organic Net Sales
|
| $
| 1,349.9
|
|
| $
| 1,421.5
|
|
| $
| 267.6
|
|
| $
| 282.8
|
|
| $
| 3,321.8
|
|
|
|
|
|
|
|
|
|
|
|
|
|
|
|
|
|
|
|
|
|
|
Year-over-year change - Net Sales
|
|
| 6.8
| %
|
|
| 10.5
| %
|
|
| (1.3)
| %
|
|
| 14.8
| %
|
|
| 8.3
| %
|
Impact of foreign exchange (pp)
|
|
| —
|
|
|
| —
|
|
|
| 3.4
|
|
|
| —
|
|
|
| 0.3
|
|
Organic Net Sales
|
|
| 6.8
| %
|
|
| 10.5
| %
|
|
| 2.1
| %
|
|
| 14.8
| %
|
|
| 8.6
| %
|
|
|
|
|
|
|
|
|
|
|
|
|
|
|
|
|
|
|
|
|
|
Volume (Organic)
|
|
| (11.6)
| %
|
|
| (5.5)
| %
|
|
| (10.7)
| %
|
|
| (3.4)
| %
|
|
| (8.4)
| %
|
Price/Mix
|
|
| 18.4
| %
|
|
| 16.0
| %
|
|
| 12.8
| %
|
|
| 18.2
| %
|
|
| 17.0
| %
|
|
|
|
|
|
|
|
|
|
|
Q2 FY22
|
| Grocery &
Snacks
|
|
| Refrigerated
& Frozen
|
|
| International
|
|
| Foodservice
|
|
| Total
Conagra
Brands
|
|
Net Sales
|
| $
| 1,264.5
|
|
| $
| 1,285.9
|
|
| $
| 262.2
|
|
| $
| 246.3
|
|
| $
| 3,058.9
|
|
Net sales from divested businesses
|
|
| —
|
|
|
| —
|
|
|
| —
|
|
|
| —
|
|
|
| —
|
|
Organic Net Sales
|
| $
| 1,264.5
|
|
| $
| 1,285.9
|
|
| $
| 262.2
|
|
| $
| 246.3
|
|
| $
| 3,058.9
|
|
|
|
Q2 FY23 YTD
|
| Grocery &
Snacks
|
|
| Refrigerated
& Frozen
|
|
| International
|
|
| Foodservice
|
|
| Total
Conagra
Brands
|
|
Net Sales
|
| $
| 2,538.2
|
|
| $
| 2,629.1
|
|
| $
| 492.2
|
|
| $
| 557.7
|
|
| $
| 6,217.2
|
|
Impact of foreign exchange
|
|
| —
|
|
|
| —
|
|
|
| 14.4
|
|
|
| —
|
|
|
| 14.4
|
|
Organic Net Sales
|
| $
| 2,538.2
|
|
| $
| 2,629.1
|
|
| $
| 506.6
|
|
| $
| 557.7
|
|
| $
| 6,231.6
|
|
|
|
|
|
|
|
|
|
|
|
|
|
|
|
|
|
|
|
|
|
|
Year-over-year change - Net Sales
|
|
| 8.5
| %
|
|
| 10.1
| %
|
|
| (1.3)
| %
|
|
| 14.7
| %
|
|
| 8.8
| %
|
Impact of foreign exchange (pp)
|
|
| —
|
|
|
| —
|
|
|
| 2.9
|
|
|
| —
|
|
|
| 0.3
|
|
Organic Net Sales
|
|
| 8.5
| %
|
|
| 10.1
| %
|
|
| 1.6
| %
|
|
| 14.7
| %
|
|
| 9.1
| %
|
|
|
|
|
|
|
|
|
|
|
|
|
|
|
|
|
|
|
|
|
|
Volume (Organic)
|
|
| (9.0)
| %
|
|
| (4.1)
| %
|
|
| (9.1)
| %
|
|
| (3.8)
| %
|
|
| (6.6)
| %
|
Price/Mix
|
|
| 17.5
| %
|
|
| 14.2
| %
|
|
| 10.7
| %
|
|
| 18.5
| %
|
|
| 15.7
| %
|
|
|
|
|
|
|
|
|
|
|
|
|
|
|
|
|
|
|
|
|
|
Q2 FY22 YTD
|
| Grocery &
Snacks
|
|
| Refrigerated
& Frozen
|
|
| International
|
|
| Foodservice
|
|
| Total
Conagra
Brands
|
|
Net Sales
|
| $
| 2,339.6
|
|
| $
| 2,387.7
|
|
| $
| 498.8
|
|
| $
| 486.1
|
|
| $
| 5,712.2
|
|
Net sales from divested businesses
|
|
| —
|
|
|
| —
|
|
|
| —
|
|
|
| —
|
|
|
| —
|
|
Organic Net Sales
|
| $
| 2,339.6
|
|
| $
| 2,387.7
|
|
| $
| 498.8
|
|
| $
| 486.1
|
|
| $
| 5,712.2
|
|
Conagra Brands, Inc.
|
Reconciliation of Non-GAAP Financial Measures to Reported Financial Measures
|
(in millions)
|
|
|
Q2 FY23
|
| Grocery &
Snacks
|
|
| Refrigerated
& Frozen
|
|
| International
|
|
| Foodservice
|
|
| Corporate
Expense
|
|
| Total Conagra
Brands
|
|
Operating Profit
|
| $
| 340.4
|
|
| $
| 250.3
|
|
| $
| 36.9
|
|
| $
| 28.5
|
|
| $
| (106.5)
|
|
| $
| 549.6
|
|
Restructuring plans
|
|
| (0.1)
|
|
|
| 0.8
|
|
|
| (0.1)
|
|
|
| —
|
|
|
| 1.2
|
|
|
| 1.8
|
|
Acquisitions and divestitures
|
|
| —
|
|
|
| —
|
|
|
| —
|
|
|
| —
|
|
|
| 0.5
|
|
|
| 0.5
|
|
Fire related costs
|
|
| —
|
|
|
| 7.9
|
|
|
| —
|
|
|
| —
|
|
|
| —
|
|
|
| 7.9
|
|
Municipal water break costs
|
|
| 0.6
|
|
|
| —
|
|
|
| —
|
|
|
| —
|
|
|
| —
|
|
|
| 0.6
|
|
Corporate hedging derivative losses
(gains)
|
|
| —
|
|
|
| —
|
|
|
| —
|
|
|
| —
|
|
|
| 2.4
|
|
|
| 2.4
|
|
Adjusted Operating Profit
|
| $
| 340.9
|
|
| $
| 259.0
|
|
| $
| 36.8
|
|
| $
| 28.5
|
|
| $
| (102.4)
|
|
| $
| 562.8
|
|
|
|
|
|
|
|
|
|
|
|
|
|
|
|
|
|
|
|
|
|
|
|
|
|
|
Operating Profit Margin
|
|
| 25.2
| %
|
|
| 17.6
| %
|
|
| 14.3
| %
|
|
| 10.1
| %
|
|
|
|
|
|
| 16.6
| %
|
Adjusted Operating Profit Margin
|
|
| 25.3
| %
|
|
| 18.2
| %
|
|
| 14.2
| %
|
|
| 10.1
| %
|
|
|
|
|
|
| 17.0
| %
|
Year-over-year % change - Operating
Profit
|
|
| 36.6
| %
|
|
| 48.6
| %
|
|
| (0.6)
| %
|
|
| 106.5
| %
|
|
| 80.2
| %
|
|
| 34.2
| %
|
Year-over year % change - Adjusted
Operating Profit
|
|
| 24.7
| %
|
|
| 37.1
| %
|
|
| (0.9)
| %
|
|
| 53.4
| %
|
|
| 44.4
| %
|
|
| 25.9
| %
|
Year-over-year bps change - Operating
Profit
|
| 551 bps
|
|
| 451 bps
|
|
| 10 bps
|
|
| 447 bps
|
|
|
|
|
|
| 320 bps
|
|
Year-over-year bps change - Adjusted
Operating Profit
|
| 363 bps
|
|
| 353 bps
|
|
| 7 bps
|
|
| 253 bps
|
|
|
|
|
|
| 237 bps
|
|
|
|
|
|
|
|
|
|
|
|
|
|
|
|
|
|
|
|
|
|
Q2 FY22
|
| Grocery &
Snacks
|
|
| Refrigerated &
Frozen
|
|
| International
|
|
| Foodservice
|
|
| Corporate
Expense
|
|
| Total Conagra
Brands
|
|
Operating Profit
|
| $
| 249.2
|
|
| $
| 168.3
|
|
| $
| 37.1
|
|
| $
| 13.8
|
|
| $
| (59.0)
|
|
| $
| 409.4
|
|
Restructuring plans
|
|
| 2.0
|
|
|
| 6.8
|
|
|
| —
|
|
|
| —
|
|
|
| 3.6
|
|
|
| 12.4
|
|
Impairment of businesses held for sale
|
|
| 22.4
|
|
|
| 12.0
|
|
|
| —
|
|
|
| 4.8
|
|
|
| —
|
|
|
| 39.2
|
|
Acquisitions and divestitures
|
|
| —
|
|
|
| —
|
|
|
| —
|
|
|
| —
|
|
|
| 0.6
|
|
|
| 0.6
|
|
Proceeds received from the sale of a
legacy investment
|
|
| —
|
|
|
| —
|
|
|
| —
|
|
|
| —
|
|
|
| (3.3)
|
|
|
| (3.3)
|
|
Legal matters
|
|
| —
|
|
|
| —
|
|
|
| —
|
|
|
| —
|
|
|
| (14.6)
|
|
|
| (14.6)
|
|
Consulting fees on tax matters
|
|
| —
|
|
|
| 1.7
|
|
|
| —
|
|
|
| —
|
|
|
| —
|
|
|
| 1.7
|
|
Corporate hedging derivative losses
(gains)
|
|
| —
|
|
|
| —
|
|
|
| —
|
|
|
| —
|
|
|
| 1.8
|
|
|
| 1.8
|
|
Adjusted Operating Profit
|
| $
| 273.6
|
|
| $
| 188.8
|
|
| $
| 37.1
|
|
| $
| 18.6
|
|
| $
| (70.9)
|
|
| $
| 447.2
|
|
|
|
|
|
|
|
|
|
|
|
|
|
|
|
|
|
|
|
|
|
|
|
|
|
|
Operating Profit Margin
|
|
| 19.7
| %
|
|
| 13.1
| %
|
|
| 14.2
| %
|
|
| 5.6
| %
|
|
|
|
|
|
| 13.4
| %
|
Adjusted Operating Profit Margin
|
|
| 21.6
| %
|
|
| 14.7
| %
|
|
| 14.1
| %
|
|
| 7.5
| %
|
|
|
|
|
|
| 14.6
| %
|
Conagra Brands, Inc.
|
Reconciliation of Non-GAAP Financial Measures to Reported Financial Measures
|
(in millions)
|
|
Q2 FY23 YTD
|
| Grocery &
Snacks
|
|
| Refrigerated
& Frozen
|
|
| International
|
|
| Foodservice
|
|
| Corporate
Expense
|
|
| Total
Conagra
Brands
|
|
Operating Profit
|
| $
| 590.8
|
|
| $
| 34.0
|
|
| $
| 63.8
|
|
| $
| 29.7
|
|
| $
| (190.0)
|
|
| $
| 528.3
|
|
Restructuring plans
|
|
| 0.2
|
|
|
| 1.4
|
|
|
| (0.2)
|
|
|
| —
|
|
|
| 5.3
|
|
|
| 6.7
|
|
Impairment of businesses held for sale
|
|
| 0.5
|
|
|
| 5.7
|
|
|
| —
|
|
|
| 20.5
|
|
|
| —
|
|
|
| 26.7
|
|
Acquisitions and divestitures
|
|
| —
|
|
|
| —
|
|
|
| —
|
|
|
| —
|
|
|
| 0.6
|
|
|
| 0.6
|
|
Goodwill and brand impairment
charges
|
|
| —
|
|
|
| 385.7
|
|
|
| —
|
|
|
| —
|
|
|
| —
|
|
|
| 385.7
|
|
Fire related costs
|
|
| —
|
|
|
| 7.9
|
|
|
| —
|
|
|
| —
|
|
|
| —
|
|
|
| 7.9
|
|
Municipal water break costs
|
|
| 3.2
|
|
|
| —
|
|
|
| —
|
|
|
| —
|
|
|
| —
|
|
|
| 3.2
|
|
Corporate hedging derivative losses
(gains)
|
|
| —
|
|
|
| —
|
|
|
| —
|
|
|
| —
|
|
|
| 1.9
|
|
|
| 1.9
|
|
Adjusted Operating Profit
|
| $
| 594.7
|
|
| $
| 434.7
|
|
| $
| 63.6
|
|
| $
| 50.2
|
|
| $
| (182.2)
|
|
| $
| 961.0
|
|
|
|
|
|
|
|
|
|
|
|
|
|
|
|
|
|
|
|
|
|
|
|
|
|
|
Operating Profit Margin
|
|
| 23.3
| %
|
|
| 1.3
| %
|
|
| 13.0
| %
|
|
| 5.3
| %
|
|
|
|
|
|
| 8.5
| %
|
Adjusted Operating Profit Margin
|
|
| 23.4
| %
|
|
| 16.5
| %
|
|
| 12.9
| %
|
|
| 9.0
| %
|
|
|
|
|
|
| 15.5
| %
|
Year-over-year % change - Operating
Profit
|
|
| 27.0
| %
|
|
| (89.6)
| %
|
|
| (10.5)
| %
|
|
| (13.0)
| %
|
|
| 53.6
| %
|
|
| (31.6)
| %
|
Year-over year % change - Adjusted
Operating Profit
|
|
| 20.5
| %
|
|
| 23.6
| %
|
|
| (10.7)
| %
|
|
| 28.2
| %
|
|
| 36.7
| %
|
|
| 16.9
| %
|
Year-over-year bps change - Operating
Profit
|
|
| 340 bps
|
|
|
| (1236) bps
|
|
|
| (132) bps
|
|
|
| (169) bps
|
|
|
|
|
|
|
| (503) bps
|
|
Year-over-year bps change - Adjusted
Operating Profit
|
|
| 234 bps
|
|
|
| 181 bps
|
|
|
| (136) bps
|
|
|
| 95 bps
|
|
|
|
|
|
|
| 107 bps
|
|
|
|
|
|
|
|
|
|
|
|
|
|
|
|
|
|
|
|
|
|
|
|
|
|
|
Q2 FY22 YTD
|
| Grocery &
Snacks
|
|
| Refrigerated
& Frozen
|
|
| International
|
|
| Foodservice
|
|
| Corporate
Expense
|
|
| Total
Conagra
Brands
|
|
Operating Profit
|
| $
| 465.1
|
|
| $
| 325.9
|
|
| $
| 71.2
|
|
| $
| 34.1
|
|
| $
| (123.6)
|
|
| $
| 772.7
|
|
Restructuring plans
|
|
| 6.1
|
|
|
| 11.8
|
|
|
| —
|
|
|
| 0.3
|
|
|
| 10.0
|
|
|
| 28.2
|
|
Impairment of businesses held for sale
|
|
| 22.4
|
|
|
| 12.0
|
|
|
| —
|
|
|
| 4.8
|
|
|
| —
|
|
|
| 39.2
|
|
Acquisitions and divestitures
|
|
| —
|
|
|
| —
|
|
|
| —
|
|
|
| —
|
|
|
| 1.6
|
|
|
| 1.6
|
|
Proceeds received from the sale of a
legacy investment
|
|
| —
|
|
|
| —
|
|
|
| —
|
|
|
| —
|
|
|
| (3.3)
|
|
|
| (3.3)
|
|
Legal matters
|
|
| —
|
|
|
| —
|
|
|
| —
|
|
|
| —
|
|
|
| (14.6)
|
|
|
| (14.6)
|
|
Consulting fees on tax matters
|
|
| —
|
|
|
| 1.7
|
|
|
| —
|
|
|
| —
|
|
|
| —
|
|
|
| 1.7
|
|
Corporate hedging derivative losses
(gains)
|
|
| —
|
|
|
| —
|
|
|
| —
|
|
|
| —
|
|
|
| (3.4)
|
|
|
| (3.4)
|
|
Adjusted Operating Profit
|
| $
| 493.6
|
|
| $
| 351.4
|
|
| $
| 71.2
|
|
| $
| 39.2
|
|
| $
| (133.3)
|
|
| $
| 822.1
|
|
|
|
|
|
|
|
|
|
|
|
|
|
|
|
|
|
|
|
|
|
|
|
|
|
|
Operating Profit Margin
|
|
| 19.9
| %
|
|
| 13.6
| %
|
|
| 14.3
| %
|
|
| 7.0
| %
|
|
|
|
|
|
| 13.5
| %
|
Adjusted Operating Profit Margin
|
|
| 21.1
| %
|
|
| 14.7
| %
|
|
| 14.3
| %
|
|
| 8.1
| %
|
|
|
|
|
|
| 14.4
| %
|
Conagra Brands, Inc.
|
Reconciliation of Non-GAAP Financial Measures to Reported Financial Measures
|
(in millions)
|
|
Q2 FY23
|
| Gross profit
|
|
| Selling, general
and
administrative
expenses
|
|
| Operating
profit1
|
|
| Income before
income taxes
and equity
method
investment
earnings
|
|
| Income tax
expense
|
|
| Effective tax
rate
|
|
| Net income
attributable to
Conagra
Brands, Inc.
|
|
| Diluted EPS
from income
attributable to
Conagra
Brands, Inc
common
stockholders
|
|
Reported
|
| $
| 922.3
|
|
| $
| 372.7
|
|
| $
| 549.6
|
|
| $
| 455.4
|
|
| $
| 122.5
|
|
|
| 24.3
| %
|
| $
| 381.9
|
|
| $
| 0.79
|
|
% of Net Sales
|
|
| 27.8
| %
|
|
| 11.3
| %
|
|
| 16.6
| %
|
|
|
|
|
|
|
|
|
|
|
|
|
|
|
|
|
|
|
|
|
Restructuring plans
|
|
| 0.1
|
|
|
| 1.7
|
|
|
| 1.8
|
|
|
| 1.8
|
|
|
| 0.5
|
|
|
|
|
|
|
| 1.3
|
|
|
| —
|
|
Acquisitions and divestitures
|
|
| —
|
|
|
| 0.5
|
|
|
| 0.5
|
|
|
| 0.5
|
|
|
| 0.1
|
|
|
|
|
|
|
| 0.4
|
|
|
| —
|
|
Corporate hedging derivative losses
(gains)
|
|
| 2.4
|
|
|
| —
|
|
|
| 2.4
|
|
|
| 2.4
|
|
|
| 0.6
|
|
|
|
|
|
|
| 1.8
|
|
|
| —
|
|
Advertising and promotion expenses2
|
|
| —
|
|
|
| 78.8
|
|
|
| —
|
|
|
| —
|
|
|
| —
|
|
|
|
|
|
|
| —
|
|
|
| —
|
|
Fire related costs
|
|
| 7.4
|
|
|
| 0.5
|
|
|
| 7.9
|
|
|
| 7.9
|
|
|
| 1.9
|
|
|
|
|
|
|
| 6.0
|
|
|
| 0.01
|
|
Municipal water break costs
|
|
| 0.6
|
|
|
| —
|
|
|
| 0.6
|
|
|
| 0.6
|
|
|
| 0.2
|
|
|
|
|
|
|
| 0.4
|
|
|
| —
|
|
Rounding
|
|
| —
|
|
|
| —
|
|
|
| —
|
|
|
| —
|
|
|
| —
|
|
|
|
|
|
|
| —
|
|
|
| 0.01
|
|
Adjusted
|
| $
| 932.8
|
|
| $
| 291.2
|
|
| $
| 562.8
|
|
| $
| 468.6
|
|
| $
| 125.8
|
|
|
| 24.3
| %
|
| $
| 391.8
|
|
| $
| 0.81
|
|
% of Net Sales
|
|
| 28.2
| %
|
|
| 8.8
| %
|
|
| 17.0
| %
|
|
|
|
|
|
|
|
|
|
|
|
|
|
|
|
|
|
|
|
|
Year-over-year % of net sales change -
reported
|
|
| 316 bps
|
|
|
| (4) bps
|
|
|
| 320 bps
|
|
|
|
|
|
|
|
|
|
|
|
|
|
|
|
|
|
|
|
|
|
Year-over-year % of net sales change -
adjusted
|
|
| 310 bps
|
|
|
| 69 bps
|
|
|
| 237 bps
|
|
|
|
|
|
|
|
|
|
|
|
|
|
|
|
|
|
|
|
|
|
|
|
|
|
|
|
|
|
|
|
|
|
|
|
|
|
|
|
|
|
|
|
|
|
|
|
|
|
|
|
|
|
|
Year-over-year change - reported
|
|
| 22.2
| %
|
|
| 7.9
| %
|
|
| 34.2
| %
|
|
| 37.7
| %
|
|
| 45.4
| %
|
|
|
|
|
|
| 38.6
| %
|
|
| 38.6
| %
|
Year-over-year change - adjusted
|
|
| 21.7
| %
|
|
| 17.5
| %
|
|
| 25.9
| %
|
|
| 27.2
| %
|
|
| 37.9
| %
|
|
|
|
|
|
| 27.9
| %
|
|
| 26.6
| %
|
|
Q2 FY22
|
| Gross profit
|
|
| Selling, general
and
administrative
expenses
|
|
| Operating
profit1
|
|
| Income before
income taxes
and equity
method
investment
earnings
|
|
| Income tax
expense
|
|
| Effective tax
rate
|
|
| Net income
attributable to
Conagra
Brands, Inc.
|
|
| Diluted EPS
from income
attributable to
Conagra
Brands, Inc
common
stockholders
|
|
Reported
|
| $
| 754.8
|
|
| $
| 345.4
|
|
| $
| 409.4
|
|
| $
| 330.6
|
|
| $
| 84.2
|
|
|
| 23.4
| %
|
| $
| 275.5
|
|
| $
| 0.57
|
|
% of Net Sales
|
|
| 24.7
| %
|
|
| 11.3
| %
|
|
| 13.4
| %
|
|
|
|
|
|
|
|
|
|
|
|
|
|
|
|
|
|
|
|
|
Restructuring plans
|
|
| 9.9
|
|
|
| 2.5
|
|
|
| 12.4
|
|
|
| 12.4
|
|
|
| 3.1
|
|
|
|
|
|
|
| 9.3
|
|
|
| 0.02
|
|
Acquisitions and divestitures
|
|
| —
|
|
|
| 0.6
|
|
|
| 0.6
|
|
|
| 0.6
|
|
|
| 0.1
|
|
|
|
|
|
|
| 0.5
|
|
|
| —
|
|
Corporate hedging derivative losses
(gains)
|
|
| 1.8
|
|
|
| —
|
|
|
| 1.8
|
|
|
| 1.8
|
|
|
| 0.4
|
|
|
|
|
|
|
| 1.4
|
|
|
| —
|
|
Advertising and promotion expenses2
|
|
| —
|
|
|
| 71.4
|
|
|
| —
|
|
|
| —
|
|
|
| —
|
|
|
|
|
|
|
| —
|
|
|
| —
|
|
Consulting fees on tax matters
|
|
| —
|
|
|
| 1.7
|
|
|
| 1.7
|
|
|
| 1.7
|
|
|
| 0.5
|
|
|
|
|
|
|
| 1.2
|
|
|
| —
|
|
Impairment of businesses held for sale
|
|
| —
|
|
|
| 39.2
|
|
|
| 39.2
|
|
|
| 39.2
|
|
|
| 7.0
|
|
|
|
|
|
|
| 32.2
|
|
|
| 0.07
|
|
Proceeds received from the sale of a
legacy investment
|
|
| —
|
|
|
| (3.3)
|
|
|
| (3.3)
|
|
|
| (3.3)
|
|
|
| (0.5)
|
|
|
|
|
|
|
| (2.8)
|
|
|
| (0.01)
|
|
Legal matters
|
|
| —
|
|
|
| (14.6)
|
|
|
| (14.6)
|
|
|
| (14.6)
|
|
|
| (3.6)
|
|
|
|
|
|
|
| (11.0)
|
|
|
| (0.02)
|
|
Rounding
|
|
| —
|
|
|
| —
|
|
|
| —
|
|
|
| —
|
|
|
| —
|
|
|
|
|
|
|
| —
|
|
|
| 0.01
|
|
Adjusted
|
| $
| 766.5
|
|
| $
| 247.9
|
|
| $
| 447.2
|
|
| $
| 368.4
|
|
| $
| 91.2
|
|
|
| 22.9
| %
|
| $
| 306.3
|
|
| $
| 0.64
|
|
% of Net Sales
|
|
| 25.1
| %
|
|
| 8.1
| %
|
|
| 14.6
| %
|
|
|
|
|
|
|
|
|
|
|
|
|
|
|
|
|
|
|
|
|
|
1 Operating profit is derived from taking Income from continuing operations before income taxes and equity method investment earnings, adding back Interest expense, net and removing Pension and postretirement non-service income.
|
2 Advertising and promotion expense (A&P) has been removed from adjusted selling, general and administrative expense because this metric is used in reporting to management, and management believes this adjusted measure provides useful supplemental information to assess the company's operating performance. Please note that A&P is not removed from adjusted profit measures.
|
Conagra Brands, Inc.
|
Reconciliation of Non-GAAP Financial Measures to Reported Financial Measures
|
(in millions)
|
|
Q2 FY23 YTD
|
| Gross profit
|
|
| Selling, general
and
administrative
expenses
|
|
| Operating
profit1
|
|
| Income before
income taxes
and equity
method
investment
earnings
|
|
| Income tax
expense
|
|
| Effective tax
rate
|
|
| Net income
attributable to
Conagra
Brands, Inc.
|
|
| Diluted EPS
from income
attributable to
Conagra
Brands, Inc
common
stockholders
|
|
Reported
|
| $
| 1,642.6
|
|
| $
| 1,114.3
|
|
| $
| 528.3
|
|
| $
| 343.1
|
|
| $
| 136.9
|
|
|
| 31.0
| %
|
| $
| 304.4
|
|
| $
| 0.63
|
|
% of Net Sales
|
|
| 26.4
| %
|
|
| 17.9
| %
|
|
| 8.5
| %
|
|
|
|
|
|
|
|
|
|
|
|
|
|
|
|
|
|
|
|
|
Restructuring plans
|
|
| 0.3
|
|
|
| 6.4
|
|
|
| 6.7
|
|
|
| 6.7
|
|
|
| 1.7
|
|
|
|
|
|
|
| 5.0
|
|
|
| 0.01
|
|
Acquisitions and divestitures
|
|
| —
|
|
|
| 0.6
|
|
|
| 0.6
|
|
|
| 0.6
|
|
|
| 0.1
|
|
|
|
|
|
|
| 0.5
|
|
|
| —
|
|
Corporate hedging derivative losses
(gains)
|
|
| 1.9
|
|
|
| —
|
|
|
| 1.9
|
|
|
| 1.9
|
|
|
| 0.5
|
|
|
|
|
|
|
| 1.4
|
|
|
| —
|
|
Advertising and promotion expenses2
|
|
| —
|
|
|
| 140.7
|
|
|
| —
|
|
|
| —
|
|
|
| —
|
|
|
|
|
|
|
| —
|
|
|
| —
|
|
Fire related costs
|
|
| 7.4
|
|
|
| 0.5
|
|
|
| 7.9
|
|
|
| 7.9
|
|
|
| 1.9
|
|
|
|
|
|
|
| 6.0
|
|
|
| 0.01
|
|
Municipal water break costs
|
|
| 3.2
|
|
|
| —
|
|
|
| 3.2
|
|
|
| 3.2
|
|
|
| 0.8
|
|
|
|
|
|
|
| 2.4
|
|
|
| —
|
|
Impairment of businesses held for sale
|
|
| —
|
|
|
| 26.7
|
|
|
| 26.7
|
|
|
| 26.7
|
|
|
| 6.6
|
|
|
|
|
|
|
| 20.1
|
|
|
| 0.04
|
|
Goodwill and brand impairment charges
|
|
| —
|
|
|
| 385.7
|
|
|
| 385.7
|
|
|
| 385.7
|
|
|
| 58.9
|
|
|
|
|
|
|
| 326.8
|
|
|
| 0.68
|
|
Rounding
|
|
| —
|
|
|
| —
|
|
|
| —
|
|
|
| —
|
|
|
| —
|
|
|
|
|
|
|
| —
|
|
|
| 0.01
|
|
Adjusted
|
| $
| 1,655.4
|
|
| $
| 553.7
|
|
| $
| 961.0
|
|
| $
| 775.8
|
|
| $
| 207.4
|
|
|
| 23.7
| %
|
| $
| 666.6
|
|
| $
| 1.38
|
|
% of Net Sales
|
|
| 26.6
| %
|
|
| 8.9
| %
|
|
| 15.5
| %
|
|
|
|
|
|
|
|
|
|
|
|
|
|
|
|
|
|
|
|
|
Year-over-year % of net sales change -
reported
|
| 142 bps
|
|
| 645 bps
|
|
| (503) bps
|
|
|
|
|
|
|
|
|
|
|
|
|
|
|
|
|
|
|
|
|
|
Year-over-year % of net sales change -
adjusted
|
| 140 bps
|
|
| 41 bps
|
|
| 107 bps
|
|
|
|
|
|
|
|
|
|
|
|
|
|
|
|
|
|
|
|
|
|
|
|
|
|
|
|
|
|
|
|
|
|
|
|
|
|
|
|
|
|
|
|
|
|
|
|
|
|
|
|
|
|
|
Year-over-year change - reported
|
|
| 15.0
| %
|
|
| 70.0
| %
|
|
| (31.6)
| %
|
|
| (44.3)
| %
|
|
| (11.1)
| %
|
|
|
|
|
|
| (40.4)
| %
|
|
| (40.6)
| %
|
Year-over-year change - adjusted
|
|
| 14.9
| %
|
|
| 14.1
| %
|
|
| 16.9
| %
|
|
| 16.6
| %
|
|
| 23.9
| %
|
|
|
|
|
|
| 21.9
| %
|
|
| 22.1
| %
|
|
Q2 FY22 YTD
|
| Gross profit
|
|
| Selling, general
and
administrative
expenses
|
|
| Operating
profit1
|
|
| Income before
income taxes
and equity
method
investment
earnings
|
|
| Income tax
expense
|
|
| Effective tax
rate
|
|
| Net income
attributable to
Conagra
Brands, Inc.
|
|
| Diluted EPS
from income
attributable to
Conagra
Brands, Inc
common
stockholders
|
|
Reported
|
| $
| 1,428.2
|
|
| $
| 655.5
|
|
| $
| 772.7
|
|
| $
| 615.8
|
|
| $
| 153.9
|
|
|
| 23.1
| %
|
| $
| 510.9
|
|
| $
| 1.06
|
|
% of Net Sales
|
|
| 25.0
| %
|
|
| 11.5
| %
|
|
| 13.5
| %
|
|
|
|
|
|
|
|
|
|
|
|
|
|
|
|
|
|
|
|
|
Restructuring plans
|
|
| 16.3
|
|
|
| 11.9
|
|
|
| 28.2
|
|
|
| 28.2
|
|
|
| 7.0
|
|
|
|
|
|
|
| 21.2
|
|
|
| 0.04
|
|
Acquisitions and divestitures
|
|
| —
|
|
|
| 1.6
|
|
|
| 1.6
|
|
|
| 1.6
|
|
|
| 0.4
|
|
|
|
|
|
|
| 1.2
|
|
|
| —
|
|
Corporate hedging derivative losses
(gains)
|
|
| (3.4)
|
|
|
| —
|
|
|
| (3.4)
|
|
|
| (3.4)
|
|
|
| (0.9)
|
|
|
|
|
|
|
| (2.5)
|
|
|
| (0.01)
|
|
Advertising and promotion expenses2
|
|
| —
|
|
|
| 133.6
|
|
|
| —
|
|
|
| —
|
|
|
| —
|
|
|
|
|
|
|
| —
|
|
|
| —
|
|
Consulting fees on tax matters
|
|
| —
|
|
|
| 1.7
|
|
|
| 1.7
|
|
|
| 1.7
|
|
|
| 0.5
|
|
|
|
|
|
|
| 1.2
|
|
|
| —
|
|
Impairment of businesses held for sale
|
|
| —
|
|
|
| 39.2
|
|
|
| 39.2
|
|
|
| 39.2
|
|
|
| 7.0
|
|
|
|
|
|
|
| 32.2
|
|
|
| 0.07
|
|
Proceeds received from the sale of a
legacy investment
|
|
| —
|
|
|
| (3.3)
|
|
|
| (3.3)
|
|
|
| (3.3)
|
|
|
| (0.5)
|
|
|
|
|
|
|
| (2.8)
|
|
|
| (0.01)
|
|
Legal matters
|
|
| —
|
|
|
| (14.6)
|
|
|
| (14.6)
|
|
|
| (14.6)
|
|
|
| (3.6)
|
|
|
|
|
|
|
| (11.0)
|
|
|
| (0.02)
|
|
Unusual tax items
|
|
| —
|
|
|
| —
|
|
|
| —
|
|
|
| —
|
|
|
| 3.6
|
|
|
|
|
|
|
| (3.6)
|
|
|
| (0.01)
|
|
Rounding
|
|
| —
|
|
|
| —
|
|
|
| —
|
|
|
| —
|
|
|
| —
|
|
|
|
|
|
|
| —
|
|
|
| 0.01
|
|
Adjusted
|
| $
| 1,441.1
|
|
| $
| 485.4
|
|
| $
| 822.1
|
|
| $
| 665.2
|
|
| $
| 167.4
|
|
|
| 23.4
| %
|
| $
| 546.8
|
|
| $
| 1.13
|
|
% of Net Sales
|
|
| 25.2
| %
|
|
| 8.5
| %
|
|
| 14.4
| %
|
|
|
|
|
|
|
|
|
|
|
|
|
|
|
|
|
|
|
|
|
|
1 Operating profit is derived from taking Income from continuing operations before income taxes and equity method investment earnings, adding back Interest expense, net and removing Pension and postretirement non-service income.
|
2 Advertising and promotion expense (A&P) has been removed from adjusted selling, general and administrative expense because this metric is used in reporting to management, and management believes this adjusted measure provides useful supplemental information to assess the company's operating performance. Please note that A&P is not removed from adjusted profit measures.
|
Conagra Brands, Inc.
|
Reconciliation of Non-GAAP Financial Measures to Reported Financial Measures
|
(in millions)
|
|
|
| November 27,
2022
|
|
| November 28,
2021
|
|
| % Change
|
|
Net cash flows from operating activities
|
| $
| 297.8
|
|
| $
| 262.1
|
|
|
| 13.6
| %
|
Additions to property, plant and equipment
|
|
| (188.4)
|
|
|
| (257.5)
|
|
|
| (26.8)
| %
|
Free cash flow
|
| $
| 109.4
|
|
| $
| 4.6
|
|
|
| N/A
|
|
|
| Q2 FY23
|
|
| Q2 FY22
|
|
Notes payable
|
| $
| 365.5
|
|
| $
| 585.8
|
|
Current installments of long-term debt
|
|
| 954.3
|
|
|
| 270.6
|
|
Senior long-term debt, excluding current installments
|
|
| 8,081.8
|
|
|
| 8,527.8
|
|
Total Debt
|
| $
| 9,401.6
|
|
| $
| 9,384.2
|
|
Less: Cash
|
|
| 39.7
|
|
|
| 68.7
|
|
Net Debt
|
| $
| 9,361.9
|
|
| $
| 9,315.5
|
|
|
| Q2 FY23 LTM2
|
|
Net Debt
|
| $
| 9,361.9
|
|
|
|
|
|
|
Net income attributable to Conagra Brands, Inc.
|
| $
| 681.7
|
|
Add Back: Income tax expense
|
|
| 273.5
|
|
Income tax expense attributable to noncontrolling interests
|
|
| 0.1
|
|
Interest expense, net
|
|
| 388.2
|
|
Depreciation
|
|
| 308.3
|
|
Amortization
|
|
| 59.1
|
|
Earnings before interest, taxes, depreciation, and amortization (EBITDA)
|
| $
| 1,710.9
|
|
Restructuring plans1
|
|
| 24.3
|
|
Acquisitions and divestitures
|
|
| 1.4
|
|
Consulting fees on tax matters
|
|
| 1.1
|
|
Corporate hedging derivative gains
|
|
| 0.9
|
|
Impairment of businesses held for sale
|
|
| 57.6
|
|
Goodwill and brand impairment charges
|
|
| 592.7
|
|
Legal matters
|
|
| (5.0)
|
|
Environmental matters
|
|
| (6.5)
|
|
Fire related costs
|
|
| 19.2
|
|
Municipal water break costs
|
|
| 3.2
|
|
Adjusted EBITDA
|
| $
| 2,399.8
|
|
|
|
|
|
|
Net Debt to Adjusted EBITDA
|
|
| 3.9
|
|
|
1 Excludes comparability items related to depreciation.
|
2 Last twelve months
|
Conagra Brands, Inc.
|
Reconciliation of Non-GAAP Financial Measures to Reported Financial Measures
|
(in millions)
|
|
|
| Q2 FY23
|
|
| Q2 FY22
|
|
| % Change
|
|
Net income attributable to Conagra Brands, Inc.
|
| $
| 381.9
|
|
| $
| 275.5
|
|
|
| 38.6
| %
|
Add Back: Income tax expense
|
|
| 122.5
|
|
|
| 84.2
|
|
|
|
|
|
Income tax expense attributable to noncontrolling interests
|
|
| (0.1)
|
|
|
| (0.1)
|
|
|
|
|
|
Interest expense, net
|
|
| 100.3
|
|
|
| 94.9
|
|
|
|
|
|
Depreciation
|
|
| 77.8
|
|
|
| 82.2
|
|
|
|
|
|
Amortization
|
|
| 14.7
|
|
|
| 14.8
|
|
|
|
|
|
Earnings before interest, taxes, depreciation, and amortization
|
| $
| 697.1
|
|
| $
| 551.5
|
|
|
| 26.4
| %
|
Restructuring plans1
|
|
| 1.8
|
|
|
| 7.7
|
|
|
|
|
|
Acquisitions and divestitures
|
|
| 0.5
|
|
|
| 0.6
|
|
|
|
|
|
Corporate hedging derivative losses (gains)
|
|
| 2.4
|
|
|
| 1.8
|
|
|
|
|
|
Fire related costs
|
|
| 7.9
|
|
|
| —
|
|
|
|
|
|
Municipal water break costs
|
|
| 0.6
|
|
|
| —
|
|
|
|
|
|
Consulting fees on tax matters
|
|
| —
|
|
|
| 1.7
|
|
|
|
|
|
Impairment of businesses held for sale
|
|
| —
|
|
|
| 39.2
|
|
|
|
|
|
Proceeds from the sale of a legacy investment
|
|
| —
|
|
|
| (3.3)
|
|
|
|
|
|
Legal matters
|
|
| —
|
|
|
| (14.6)
|
|
|
|
|
|
Adjusted Earnings before interest, taxes, depreciation, and
amortization
|
| $
| 710.3
|
|
| $
| 584.6
|
|
|
| 21.5
| %
|
|
|
| Q2 FY23 YTD
|
|
| Q2 FY22 YTD
|
|
| % Change
|
|
Net income attributable to Conagra Brands, Inc.
|
| $
| 304.4
|
|
| $
| 510.9
|
|
|
| (40.4)
| %
|
Add Back: Income tax expense
|
|
| 136.9
|
|
|
| 153.9
|
|
|
|
|
|
Income tax expense attributable to noncontrolling interests
|
|
| (0.1)
|
|
|
| (0.2)
|
|
|
|
|
|
Interest expense, net
|
|
| 197.4
|
|
|
| 189.1
|
|
|
|
|
|
Depreciation
|
|
| 156.0
|
|
|
| 163.8
|
|
|
|
|
|
Amortization
|
|
| 29.5
|
|
|
| 29.7
|
|
|
|
|
|
Earnings before interest, taxes, depreciation, and amortization
|
| $
| 824.1
|
|
| $
| 1,047.2
|
|
|
| (21.3)
| %
|
Restructuring plans1
|
|
| 6.7
|
|
|
| 17.2
|
|
|
|
|
|
Acquisitions and divestitures
|
|
| 0.6
|
|
|
| 1.6
|
|
|
|
|
|
Corporate hedging derivative losses (gains)
|
|
| 1.9
|
|
|
| (3.4)
|
|
|
|
|
|
Fire related costs
|
|
| 7.9
|
|
|
| —
|
|
|
|
|
|
Municipal water break costs
|
|
| 3.2
|
|
|
| —
|
|
|
|
|
|
Consulting fees on tax matters
|
|
| —
|
|
|
| 1.7
|
|
|
|
|
|
Impairment of businesses held for sale
|
|
| 26.7
|
|
|
| 39.2
|
|
|
|
|
|
Proceeds from the sale of a legacy investment
|
|
| —
|
|
|
| (3.3)
|
|
|
|
|
|
Legal matters
|
|
| —
|
|
|
| (14.6)
|
|
|
|
|
|
Goodwill and brand impairment charges
|
|
| 385.7
|
|
|
| —
|
|
|
|
|
|
Adjusted Earnings before interest, taxes, depreciation, and
amortization
|
| $
| 1,256.8
|
|
| $
| 1,085.6
|
|
|
| 15.8
| %
|
|
1 Excludes comparability items related to depreciation.
|
For more information, please contact:
MEDIA: Mike Cummins
312-549-5257
Michael.Cummins@conagra.com
INVESTORS: Melissa Napier
312-549-5738
IR@conagra.com
View original content to download multimedia:https://www.prnewswire.com/news-releases/conagra-brands-reports-second-quarter-results-301713974.html
SOURCE Conagra Brands, Inc.

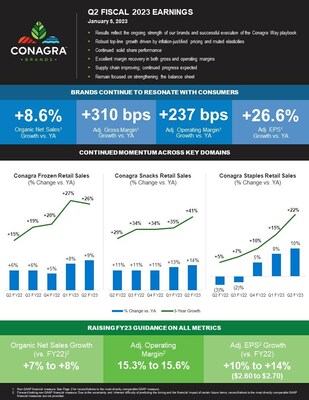


