Uncategorized
ChoiceOne Financial Reports Fourth Quarter and Year End 2022 Results
ChoiceOne Financial Reports Fourth Quarter and Year End 2022 Results
PR Newswire
SPARTA, Mich., Jan. 25, 2023
SPARTA, Mich., Jan. 25, 2023 /PRNewswire/ — ChoiceOne Financial Services, Inc. (“ChoiceOne”, NASDAQ:COFS), the parent company for ChoiceO…
Share this:


ChoiceOne Financial Reports Fourth Quarter and Year End 2022 Results
PR Newswire
SPARTA, Mich., Jan. 25, 2023
SPARTA, Mich., Jan. 25, 2023 /PRNewswire/ -- ChoiceOne Financial Services, Inc. ("ChoiceOne", NASDAQ:COFS), the parent company for ChoiceOne Bank, reported financial results for the quarter ended December 31, 2022.
Financial Highlights
- ChoiceOne reported net income of $6,684,000 and $23,640,000 for the three and twelve months ended December 31, 2022, compared to $5,012,000 and $22,042,000 for the same periods in 2021.
- Diluted earnings per share were $0.89 and $3.15 in the three and twelve months ended December 31, 2022, compared to $0.66 and $2.86 per share in the same periods in the prior year.
- Core loans, which exclude Paycheck Protection Program ("PPP") loans, held for sale loans, and loans to other financial institutions, grew organically by $57.4 million or 20.3% on an annualized basis during the fourth quarter of 2022 and $206.1 million or 21.0% during the full year 2022.
- Deposits increased by $65.7 million or 3.2% for the full year 2022 with related deposit interest expense increasing $2.5 million. Deposits declined $38.7 million in the fourth quarter of 2022 due to some seasonality in municipal deposits and increased competition.
- ChoiceOne opened a loan production office in Oakland County, Michigan during the fourth quarter 2022. It is intended that this location will host both commercial and mortgage lenders and is ChoiceOne's fourth loan production office opened in recent years.
- ChoiceOne plans to launch an enhanced treasury services online platform for business clients in 2023. This new platform targets mid-sized businesses and municipalities who require enhanced reporting, security, and payment capabilities.
"Our investment in growing an experienced commercial lending team continues to drive strong organic core loan growth, with core loans growing organically over 20% during 2022," said Kelly Potes, Chief Executive Officer. "Our focus on customer relationships is reflected in our deposit balances which increased $65.7 million compared to the end of 2021 despite increased pressure from competition. With higher interest rates, our local low-cost core deposit franchise provides significant value, and we expect to continue to fund our growth with local deposits and other on-balance sheet liquidity."
ChoiceOne reported net income of $6,684,000 and $23,640,000 for the three and twelve months ended December 31, 2022, compared to $5,012,000 and $22,042,000 for the same periods in 2021. Diluted earnings per share were $0.89 and $3.15 in the three and twelve months ended December 31, 2022, compared to $0.66 and $2.86 per share in the same periods in the prior year.
Total assets as of December 31, 2022, increased $19.2 million as compared to December 31, 2021. ChoiceOne saw deposits decline $38.7 million in the fourth quarter of 2022 due to some seasonality in municipal deposits and increased competition. The cost of these deposits also increased by $940,000 in the fourth quarter of 2022 compared to the third quarter of 2022 and $1.8 million compared to the fourth quarter of 2021. Deposits have increased by $65.7 million in the twelve months ended December 31, 2022; however, during that time deposit expense has increased $2.5 million. Cost of interest-bearing deposits increased to 0.66% in the fourth quarter of 2022 primarily due to the increases in rates offered to retain clients and an increased interest in certificates of deposit. ChoiceOne is actively managing these costs while still retaining funds, and anticipates that deposit expense will continue to lag the expected additional increases in the federal funds rate. Borrowing interest expense for the twelve months ended December 31, 2022, increased $1.2 million as compared to the same period in 2021 primarily due to the issuance of $32.5 million in subordinated debt that was completed in the third quarter of 2021 and the increase in rates on borrowings.
Core loans grew organically by $57.4 million or 20.3% on an annualized basis during the fourth quarter of 2022 and $206.1 million or 21.0% during the full year 2022. Loans to other financial institutions, consisting of a warehouse line of credit, were suspended at the end of the third quarter 2022 to preserve liquidity for loan growth. ChoiceOne continues to have ample on balance sheet liquidity to fund future loan growth, including an estimated $168 million of cash flow from securities over the next two years. Interest income increased $10.4 million in the twelve months ended December 31, 2022, compared to the same period in the prior year. The increase was driven by a $6.3 million increase in securities interest income despite the average balance of securities decreasing $7.0 million during the year. In 2022, ChoiceOne liquidated a total of $46.8 million in securities resulting in an $809,000 realized loss, in order to redeploy funds into higher yielding loans and securities, and to reduce the risk of extension on certain fixed income securities which include a call option. $4.2 million of the increase in interest income is from loan interest income and was primarily a result of higher loan balances and $2.0 million of accretion income from acquired loans partially offset by a decrease in PPP fee income of $3.9 million.
ChoiceOne had $250,000 of provision for loan losses expense for the year ended December 31, 2022. Management has seen declining deferrals and very few past due loans; however, the additional provision was deemed necessary due to consistent loan growth. On December 31, 2022, the allowance for loan losses represented 0.64% of total loans. ChoiceOne will adopt ASU 2016-13 current expected credit loss ("CECL") on January 1, 2023. Due to the current economic environment, the nature of the new calculation, and purchase accounting with our recent mergers, we anticipate an increase in our current reserve of between $6.5 million and $7.0 million which results in a reserve to total loan coverage ratio between 1.15% and 1.20% on January 1, 2023. Approximately 20% to 25% of this increase is related to the migration of purchased loans into the portfolio assessed by the CECL calculation. Purchased loans carry approximately $4 million of accretable yield which will be recognized into income over the remaining life of the loans. ChoiceOne will also book a liability for expected credit losses on unfunded loans and other commitments of between $2.5 million to $3.0 million related to the adoption of CECL guidance. These unfunded loans are open credit lines with current customers and loans approved by ChoiceOne but not funded. The increase in the reserve and the cost of the liability will be funded through equity, net of tax, in accordance with FASB guidance.
Shareholders' equity totaled $168.9 million as of December 31, 2022, down from $221.7 million as of December 31, 2021, primarily due to an increase in the after-tax net unrealized loss on securities available for sale resulting from higher market interest rates. ChoiceOne's derivative strategy implemented during the second quarter of 2022 and repositioned during the fourth quarter of 2022, is expected to better prepare the bank should rates continue to rise. The net impact on equity of the derivative strategy as of December 31, 2022, was $957,000 net of tax. ChoiceOne Bank remains "well-capitalized" with a total risk-based capital ratio of 13.0% as of December 31, 2022, compared to 12.9% on December 31, 2021. No shares of common stock were repurchased during the fourth quarter of 2022; however, ChoiceOne may strategically repurchase shares of common stock in the future depending on market and other conditions.
Total noninterest income declined $5.1 million during the year ended 2022 compared to the year ended 2021. $4.1 million of this decline is due to the change in the mortgage sales environment from the prior year. With the rapid rise in interest rates, refinancing activity has slowed, and demand has shifted towards adjustable-rate products. Customer service charges increased $722,000 during 2022 compared to 2021 as prior year service charges were depressed by the effects of the COVID-19 pandemic. The change in market value of equity securities declined $1.4 million during 2022 compared to 2021 consistent with general market conditions. Equity investments include local community bank stocks and Community Reinvestment Act bond mutual funds.
Total noninterest expense increased $557,000, or 1.1%, in 2022 compared to 2021. Overall expense management was a focus in 2022 and will continue to be in 2023 given inflationary pressures. The increase in total noninterest expense was related to an increase in salaries and wages due to annual wage increases and the addition of new commercial loan production and wealth management staff. This increase was offset by decreases in other categories including professional fees. ChoiceOne continues to monitor expenses and looks to improve our efficiency through automation and use of digital tools. ChoiceOne plans to launch an enhanced treasury services online platform for business clients in 2023. This new platform targets mid-sized businesses and municipalities who require enhanced reporting, security, and payment capabilities. Management believes that continuing to invest in our technology and people is the right way to maintain sustainable growth.
Potes further commented, "Our growth and well managed expenses in 2022 are a result of the hard work of our employees and the client relationships that they foster. ChoiceOne's mission is to provide superior service, quality advice, and treat all we meet with utmost respect. Our value is not measured in the interest rate we pay, but the interest we take in our client's success. I am very pleased with our 2022 results and believe we have the right pieces in place to have a successful 2023."
About ChoiceOne
ChoiceOne Financial Services, Inc. is a financial holding company headquartered in Sparta, Michigan and the parent corporation of ChoiceOne Bank. Member FDIC. ChoiceOne Bank operates 36 offices in parts of Kent, Lapeer, Macomb, Muskegon, Newaygo, Ottawa, and St. Clair counties. ChoiceOne Bank offers insurance and investment products through its subsidiary, ChoiceOne Insurance Agencies, Inc. For more information, please visit Investor Relations at ChoiceOne's website at choiceone.com.
Forward-Looking Statements
This release may contain forward-looking statements. Words such as "anticipates," "believes," "estimates," "expects," "forecasts," "intends," "is likely," "plans," "predicts," "projects," "may," "could," "look forward," "continue", "future", "will" and variations of such words and similar expressions are intended to identify such forward looking statements. These statements reflect current beliefs as to the expected outcomes of future events and are not guarantees of future performance. These statements involve certain risks, uncertainties and assumptions ("risk factors") that are difficult to predict with regard to timing, extent, likelihood and degree of occurrence. Therefore, actual results and outcomes may materially differ from what may be expressed, implied or forecasted in such forward-looking statements. Furthermore, ChoiceOne undertakes no obligation to update, amend, or clarify forward-looking statements, whether as a result of new information, future events, or otherwise. Risk factors include, but are not limited to, the risk factors described in Item 1A in ChoiceOne Financial Services, Inc.'s Annual Report on Form 10-K for the year ended December 31, 2021.
Condensed Balance Sheets | ||||||||
(In thousands) | 12/31/2022 | 12/31/2021 | ||||||
Cash and cash equivalents | $ | 43,943 | $ | 31,887 | ||||
Securities Held to Maturity | 425,906 | - | ||||||
Securities Available for Sale | 546,897 | 1,116,265 | ||||||
Loans held for sale | 4,834 | 9,351 | ||||||
Loans to other financial institutions | - | 42,632 | ||||||
Loans, net of allowance for loan losses | 1,182,163 | 1,009,160 | ||||||
Premises and equipment | 28,232 | 29,880 | ||||||
Cash surrender value of life insurance policies | 43,978 | 43,356 | ||||||
Goodwill | 59,946 | 59,946 | ||||||
Core deposit intangible | 2,809 | 3,962 | ||||||
Other assets | 47,206 | 20,243 | ||||||
Total Assets | $ | 2,385,914 | $ | 2,366,682 | ||||
Noninterest-bearing deposits | $ | 599,579 | $ | 560,931 | ||||
Interest-bearing deposits | 1,518,424 | 1,491,363 | ||||||
Borrowings | 50,000 | 50,000 | ||||||
Subordinated debentures | 35,262 | 35,017 | ||||||
Other liabilities | 13,775 | 7,702 | ||||||
Total Liabilities | 2,217,040 | 2,145,013 | ||||||
Common stock and paid-in capital, no par value; shares authorized: 12,000,000; shares outstanding: 7,516,098 at December 31, 2022 and 7,510,379 at December 31, 2021 | 172,277 | 171,913 | ||||||
Retained earnings | 68,394 | 52,332 | ||||||
Accumulated other comprehensive income (loss), net | (71,797) | (2,576) | ||||||
Shareholders' Equity | 168,874 | 221,669 | ||||||
Total Liabilities and Shareholders' Equity | $ | 2,385,914 | $ | 2,366,682 | ||||
Condensed Statements of Income | ||||||||||||||||
Three Months Ended | Twelve Months Ended | |||||||||||||||
(In thousands, except per share data) | 12/31/2022 | 12/31/2021 | 12/31/2022 | 12/31/2021 | ||||||||||||
Interest income | ||||||||||||||||
Loans, including fees | $ | 14,391 | $ | 12,002 | $ | 52,823 | $ | 48,657 | ||||||||
Securities and other | 6,244 | 4,816 | 22,237 | 15,961 | ||||||||||||
Total Interest Income | 20,635 | 16,818 | 75,060 | 64,618 | ||||||||||||
Interest expense | ||||||||||||||||
Deposits | 2,503 | 749 | 5,845 | 3,305 | ||||||||||||
Borrowings | 766 | 324 | 1,901 | 672 | ||||||||||||
Total Interest Expense | 3,269 | 1,073 | 7,746 | 3,977 | ||||||||||||
Net interest income | 17,366 | 15,745 | 67,314 | 60,641 | ||||||||||||
Provision for loan losses | 150 | - | 250 | 416 | ||||||||||||
Net Interest Income After Provision for Loan Losses | 17,216 | 15,745 | 67,064 | 60,225 | ||||||||||||
Noninterest income | ||||||||||||||||
Customer service charges | 2,350 | 2,319 | 9,350 | 8,628 | ||||||||||||
Insurance and investment commissions | 183 | 141 | 779 | 765 | ||||||||||||
Gains on sales of loans | 220 | 1,061 | 2,343 | 6,402 | ||||||||||||
Gains (loss) on sales of securities | (4) | (43) | (809) | (40) | ||||||||||||
Gains (loss) on sales of other assets | (73) | 3 | 99 | 6 | ||||||||||||
Trust income | 206 | 178 | 734 | 790 | ||||||||||||
Earnings on life insurance policies | 519 | 239 | 1,312 | 809 | ||||||||||||
Change in market value of equity securities | 51 | 18 | (955) | 479 | ||||||||||||
Other income | 297 | 228 | 1,219 | 1,355 | ||||||||||||
Total Noninterest Income | 3,749 | 4,144 | 14,072 | 19,194 | ||||||||||||
Noninterest expense | ||||||||||||||||
Salaries and benefits | 7,580 | 7,581 | 30,391 | 29,300 | ||||||||||||
Occupancy and equipment | 1,501 | 1,577 | 6,189 | 6,168 | ||||||||||||
Data processing | 1,673 | 1,616 | 6,729 | 6,189 | ||||||||||||
Professional fees | 547 | 583 | 2,175 | 3,009 | ||||||||||||
Core deposit intangible amortization | 252 | 302 | 1,153 | 1,307 | ||||||||||||
Other expenses | 1,662 | 2,099 | 6,841 | 6,948 | ||||||||||||
Total Noninterest Expense | 13,215 | 13,758 | 53,478 | 52,921 | ||||||||||||
Income Before Income Tax | 7,750 | 6,131 | 27,658 | 26,498 | ||||||||||||
Income Tax Expense | 1,066 | 1,119 | 4,018 | 4,456 | ||||||||||||
Net Income | $ | 6,684 | $ | 5,012 | $ | 23,640 | $ | 22,042 | ||||||||
Basic Earnings Per Share | $ | 0.89 | $ | 0.67 | $ | 3.15 | $ | 2.87 | ||||||||
Diluted Earnings Per Share | $ | 0.89 | $ | 0.66 | $ | 3.15 | $ | 2.86 | ||||||||
Other Selected Financial Highlights | ||||||||||||||||||||
Quarterly | ||||||||||||||||||||
Earnings | 2022 4th Qtr. | 2022 3rd Qtr. | 2022 2nd Qtr. | 2022 1st Qtr. | 2021 4th Qtr. | |||||||||||||||
(in thousands except per share data) | ||||||||||||||||||||
Net interest income | $ | 17,366 | $ | 17,338 | $ | 16,289 | $ | 16,321 | $ | 15,745 | ||||||||||
Provision for loan losses | 150 | 100 | - | - | - | |||||||||||||||
Noninterest income | 3,749 | 3,047 | 3,430 | 3,845 | 4,144 | |||||||||||||||
Noninterest expense | 13,215 | 13,416 | 13,157 | 13,690 | 13,758 | |||||||||||||||
Net income before federal income tax expense | 7,750 | 6,869 | 6,562 | 6,476 | 6,131 | |||||||||||||||
Income tax expense | 1,066 | 1,056 | 947 | 948 | 1,119 | |||||||||||||||
Net income | 6,684 | 5,813 | 5,615 | 5,528 | 5,012 | |||||||||||||||
Basic earnings per share | 0.89 | 0.77 | 0.75 | 0.74 | 0.67 | |||||||||||||||
Diluted earnings per share | 0.89 | 0.77 | 0.75 | 0.74 | 0.66 | |||||||||||||||
End of period balances | 2022 4th Qtr. | 2022 3rd Qtr. | 2022 2nd Qtr. | 2022 1st Qtr. | 2021 4th Qtr. | |||||||||||||||
(in thousands) | ||||||||||||||||||||
Gross loans | $ | 1,194,616 | $ | 1,141,319 | $ | 1,129,439 | $ | 1,040,856 | $ | 1,068,832 | ||||||||||
Loans held for sale (1) | 4,834 | 8,848 | 10,628 | 13,450 | 9,351 | |||||||||||||||
Loans to other financial institutions (2) | - | 70 | 37,422 | - | 42,632 | |||||||||||||||
PPP loans (3) | - | - | 1,758 | 8,476 | 33,129 | |||||||||||||||
Core loans (gross loans excluding 1, 2, and 3 above) | 1,189,782 | 1,132,401 | 1,079,631 | 1,018,930 | 983,720 | |||||||||||||||
Allowance for loan losses | 7,619 | 7,457 | 7,416 | 7,601 | 7,688 | |||||||||||||||
Securities available for sale | 546,897 | 546,627 | 582,987 | 657,887 | 1,116,264 | |||||||||||||||
Securities held to maturity | 425,906 | 428,205 | 429,675 | 429,918 | - | |||||||||||||||
Other interest-earning assets | 15,447 | 21,744 | 9,532 | 62,945 | 9,751 | |||||||||||||||
Total earning assets (before allowance) | 2,182,866 | 2,137,895 | 2,151,633 | 2,191,606 | 2,194,847 | |||||||||||||||
Total assets | 2,385,914 | 2,363,529 | 2,360,205 | 2,376,778 | 2,366,682 | |||||||||||||||
Noninterest-bearing deposits | 599,579 | 599,360 | 578,927 | 565,657 | 560,931 | |||||||||||||||
Interest-bearing deposits | 1,518,424 | 1,557,294 | 1,559,577 | 1,579,944 | 1,491,363 | |||||||||||||||
Total deposits | 2,118,003 | 2,156,654 | 2,138,504 | 2,145,601 | 2,052,294 | |||||||||||||||
Total subordinated debt | 35,262 | 35,201 | 35,140 | 35,078 | 35,017 | |||||||||||||||
Total borrowed funds | 50,000 | - | 7,000 | - | 50,000 | |||||||||||||||
Total interest-bearing liabilities | 1,603,686 | 1,592,495 | 1,601,717 | 1,615,022 | 1,576,380 | |||||||||||||||
Shareholders' equity | 168,874 | 156,657 | 166,460 | 191,118 | 221,669 | |||||||||||||||
Average Balances | 2022 4th Qtr. | 2022 3rd Qtr. | 2022 2nd Qtr. | 2022 1st Qtr. | 2021 4th Qtr. | |||||||||||||||
(in thousands) | ||||||||||||||||||||
Loans | $ | 1,169,605 | $ | 1,128,679 | $ | 1,076,934 | $ | 1,037,646 | $ | 1,019,966 | ||||||||||
Securities | 1,072,594 | 1,079,584 | 1,098,419 | 1,130,681 | 1,079,616 | |||||||||||||||
Other interest-earning assets | 14,809 | 45,210 | 40,728 | 36,460 | 29,999 | |||||||||||||||
Total earning assets (before allowance) | 2,257,008 | 2,253,473 | 2,216,081 | 2,204,787 | 2,129,581 | |||||||||||||||
Total assets | 2,373,851 | 2,389,550 | 2,361,479 | 2,375,864 | 2,298,579 | |||||||||||||||
Noninterest-bearing deposits | 605,318 | 593,793 | 578,943 | 553,267 | 556,214 | |||||||||||||||
Interest-bearing deposits | 1,522,510 | 1,576,240 | 1,555,721 | 1,548,685 | 1,472,022 | |||||||||||||||
Total deposits | 2,127,828 | 2,170,033 | 2,134,664 | 2,101,952 | 2,028,236 | |||||||||||||||
Total subordinated debt | 35,230 | 35,168 | 35,095 | 35,342 | 35,674 | |||||||||||||||
Total borrowed funds | 36,773 | 2,414 | 5,765 | 10,239 | 8,010 | |||||||||||||||
Total interest-bearing liabilities | 1,594,513 | 1,613,822 | 1,596,581 | 1,594,266 | 1,515,706 | |||||||||||||||
Shareholders' equity | 160,284 | 164,758 | 177,085 | 206,280 | 221,076 | |||||||||||||||
Performance Ratios | 2022 4th Qtr. | 2022 3rd Qtr. | 2022 2nd Qtr. | 2022 1st Qtr. | 2021 4th Qtr. | |||||||||||||||
Return on average assets | 1.13 | % | 0.97 | % | 0.95 | % | 0.93 | % | 0.87 | % | ||||||||||
Return on average equity | 16.68 | % | 14.11 | % | 12.68 | % | 10.72 | % | 9.07 | % | ||||||||||
Return on average tangible common equity | 26.63 | % | 21.96 | % | 18.87 | % | 14.85 | % | 12.16 | % | ||||||||||
Net interest margin (fully tax-equivalent) | 3.15 | % | 3.15 | % | 3.02 | % | 3.04 | % | 3.04 | % | ||||||||||
Efficiency ratio | 60.15 | % | 61.06 | % | 61.43 | % | 64.37 | % | 66.15 | % | ||||||||||
Cost of funds | 0.59 | % | 0.35 | % | 0.25 | % | 0.21 | % | 0.21 | % | ||||||||||
Cost of deposits | 0.47 | % | 0.29 | % | 0.19 | % | 0.15 | % | 0.15 | % | ||||||||||
Shareholders' equity to total assets | 7.08 | % | 6.63 | % | 7.05 | % | 8.04 | % | 9.37 | % | ||||||||||
Tangible common equity to tangible assets | 4.57 | % | 4.07 | % | 4.49 | % | 5.51 | % | 6.85 | % | ||||||||||
Full-time equivalent employees | 376 | 383 | 380 | 376 | 374 | |||||||||||||||
Capital Ratios ChoiceOne Financial Services Inc. | 2022 4th Qtr. | 2022 3rd Qtr. | 2022 2nd Qtr. | 2022 1st Qtr. | 2021 4th Qtr. | |||||||||||||||
Total capital (to risk weighted assets) | 13.8 | % | 13.7 | % | 13.8 | % | 14.6 | % | 14.4 | % | ||||||||||
Common equity Tier 1 capital (to risk weighted assets) | 11.1 | % | 10.9 | % | 11.0 | % | 11.5 | % | 11.3 | % | ||||||||||
Tier 1 capital (to risk weighted assets) | 11.4 | % | 11.2 | % | 11.3 | % | 11.9 | % | 11.6 | % | ||||||||||
Tier 1 capital (to average assets) | 7.9 | % | 7.6 | % | 7.5 | % | 7.3 | % | 7.4 | % | ||||||||||
Capital Ratios ChoiceOne Bank | 2022 4th Qtr. | 2022 3rd Qtr. | 2022 2nd Qtr. | 2022 1st Qtr. | 2021 4th Qtr. | |||||||||||||||
Total capital (to risk weighted assets) | 13.0 | % | 12.8 | % | 12.7 | % | 13.3 | % | 12.9 | % | ||||||||||
Common equity Tier 1 capital (to risk weighted assets) | 12.5 | % | 12.3 | % | 12.2 | % | 12.8 | % | 12.3 | % | ||||||||||
Tier 1 capital (to risk weighted assets) | 12.5 | % | 12.3 | % | 12.2 | % | 12.8 | % | 12.3 | % | ||||||||||
Tier 1 capital (to average assets) | 8.7 | % | 8.3 | % | 8.1 | % | 7.9 | % | 7.8 | % | ||||||||||
Asset Quality | 2022 4th Qtr. | 2022 3rd Qtr. | 2022 2nd Qtr. | 2022 1st Qtr. | 2021 4th Qtr. | ||||||||||
(in thousands) | |||||||||||||||
Net loan charge-offs (recoveries) | $ | (12) | $ | 59 | $ | 185 | $ | 87 | $ | 67 | |||||
Annualized net loan charge-offs (recoveries) to average loans | 0.00 | % | 0.02 | % | 0.07 | % | 0.03 | % | 0.03 | % | |||||
Allowance for loan losses | $ | 7,619 | $ | 7,457 | $ | 7,416 | $ | 7,601 | $ | 7,688 | |||||
Allowance to loans (excludes held for sale) | 0.64 | % | 0.66 | % | 0.66 | % | 0.74 | % | 0.73 | % | |||||
Non-Accruing loans | $ | 1,263 | $ | 1,197 | $ | 1,242 | $ | 1,167 | $ | 1,727 | |||||
Non performing loans (includes OREO) | 2,666 | 2,628 | 2,714 | 4,852 | 5,737 | ||||||||||
Nonperforming loans to total loans (excludes held for sale) | 0.22 | % | 0.23 | % | 0.24 | % | 0.47 | % | 0.54 | % | |||||
Nonperforming assets to total assets | 0.11 | % | 0.11 | % | 0.11 | % | 0.20 | % | 0.24 | % | |||||
View original content to download multimedia:https://www.prnewswire.com/news-releases/choiceone-financial-reports-fourth-quarter-and-year-end-2022-results-301730790.html
SOURCE ChoiceOne Financial Services, Inc.
Uncategorized
These Cities Have The Highest (And Lowest) Share Of Unaffordable Neighborhoods In 2024
These Cities Have The Highest (And Lowest) Share Of Unaffordable Neighborhoods In 2024
Authored by Sam Bourgi via CreditNews.com,
Homeownership…
Share this:


Authored by Sam Bourgi via CreditNews.com,
Homeownership is one of the key pillars of the American dream. But for many families, the idyllic fantasy of a picket fence and backyard barbecues remains just that—a fantasy.
Thanks to elevated mortgage rates, sky-high house prices, and scarce inventory, millions of American families have been locked out of the opportunity to buy a home in many cities.
To shed light on America’s housing affordability crisis, Creditnews Research ranked the 50 most populous cities by the percentage of neighborhoods within reach for the typical married-couple household to buy a home in.
The study reveals a stark reality, with many cities completely out of reach for the most affluent household type. Not only that, the unaffordability has radically worsened in recent years.
Comparing how affordability has changed since Covid, Creditnews Research discovered an alarming pattern—indicating consistently more unaffordable housing in all but three cities.
Fortunately, there’s still hope for households seeking to put down roots in more affordable cities—especially for those looking beyond Los Angeles, New York, Boston, San Jone, and Miami.
The typical American family has a hard time putting down roots in many parts of the country. In 11 of the top 50 cities, at least 50% of neighborhoods are out of reach for the average married-couple household. The affordability gap has widened significantly since Covid; in fact, no major city has reported an improvement in affordability post-pandemic.
Sam Bourgi, Senior Analyst at Creditnews
Key findings
-
The most unaffordable cities are Los Angeles, Boston, St. Louis, and San Jose; in each city, 100% of neighborhoods are out of reach for for married-couple households earning a median income;
-
The most affordable cities are Cleveland, Hartford, and Memphis—in these cities, the typical family can afford all neighborhoods;
-
None of the top 50 cities by population saw an improvement in affordable neighborhoods post-pandemic;
-
California recorded the biggest spike in unaffordable neighborhoods since pre-Covid;
-
The share of unaffordable neighborhoods has increased the most since pre-Covid in San Jose (70 percentage points), San Diego (from 57.8 percentage points), and Riverside-San Bernardino (51.9 percentage points);
-
Only three cities have seen no change in housing affordability since pre-Covid: Cleveland, Memphis, and Hartford. They’re also the only cities that had 0% of unaffordable neighborhoods before Covid.
Cities with the highest share of unaffordable neighborhoods
With few exceptions, the most unaffordable cities for married-couple households tend to be located in some of the nation’s most expensive housing markets.
Four cities in the ranking have an unaffordability percentage of 100%—indicating that the median married-couple household couldn’t qualify for an average home in any neighborhood.
The following are the cities ranked from the least affordable to the most:
-
Los Angeles, CA: Housing affordability in Los Angeles has deteriorated over the last five years, as average incomes have failed to keep pace with rising property values and elevated mortgage rates. The median household income of married-couple families in LA is $117,056, but even at that rate, 100% of the city’s neighborhoods are unaffordable.
-
St. Louis, MO: It may be surprising to see St. Louis ranking among the most unaffordable housing markets for married-couple households. But a closer look reveals that the Mound City was unaffordable even before Covid. In 2019, 98% of the city’s neighborhoods were unaffordable—way worse than Los Angeles, Boston, or San Jose.
-
Boston, MA: Boston’s housing affordability challenges began long before Covid but accelerated after the pandemic. Before Covid, married couples earning a median income were priced out of 90.7% of Boston’s neighborhoods. But that figure has since jumped to 100%, despite a comfortable median household income of $172,223.
-
San Jose, CA: Nestled in Silicon Valley, San Jose has long been one of the most expensive cities for housing in America. But things have gotten far worse since Covid, as 100% of its neighborhoods are now out of reach for the average family. Perhaps the most shocking part is that the median household income for married-couple families is $188,403—much higher than the national average.
-
San Diego, CA: Another California city, San Diego, is among the most unaffordable places in the country. Despite boasting a median married-couple household income of $136,297, 95.6% of the city’s neighborhoods are unaffordable.
-
San Francisco, CA: San Francisco is another California city with a high married-couple median income ($211,585) but low affordability. The percentage of unaffordable neighborhoods for these homebuyers stands at 89.2%.
-
New York, NY: As one of the most expensive cities in America, New York is a difficult housing market for married couples with dual income. New York City’s share of unaffordable neighborhoods is 85.9%, marking a 33.4% rise from pre-Covid times.
-
Miami, FL: Partly due to a population boom post-Covid, Miami is now one of the most unaffordable cities for homebuyers. Roughly four out of five (79.4%) of Miami’s neighborhoods are out of reach price-wise for married-couple families. That’s a 34.7% increase from 2019.
-
Nashville, TN: With Nashville’s population growth rebounding to pre-pandemic levels, the city has also seen greater affordability challenges. In the Music City, 73.7% of neighborhoods are considered unaffordable for married-couple households—an increase of 11.9% from pre-Covid levels.
-
Richmond, VA: Rounding out the bottom 10 is Richmond, where 55.9% of the city’s 161 neighborhoods are unaffordable for married-couple households. That’s an 11.9% increase from pre-Covid levels.
Cities with the lowest share of unaffordable neighborhoods
All the cities in our top-10 ranking have less than 10% unaffordable neighborhoods—meaning the average family can qualify for a home in at least 90% of the city.
Interestingly, these cities are also outside the top 15 cities by population, and eight are in the bottom half.
The following are the cities ranked from the most affordable to the least:
-
Hartford, CT: Hartford ranks first with the percentage of unaffordable neighborhoods at 0%, unchanged since pre-Covid times. Married couples earning a median income of $135,612 can afford to live in any of the city’s 16 neighborhoods. Interestingly, Hartford is the smallest city to rank in the top 10.
-
Memphis, TN: Like Hartford, Memphis has 0% unaffordable neighborhoods, meaning any married couple earning a median income of $101,734 can afford an average homes in any of the city’s 12 neighborhoods. The percentage of unaffordable neighborhoods also stood at 0% before Covid.
-
Cleveland, OH: The Midwestern city of Cleveland is also tied for first, with the percentage of unaffordable neighborhoods at 0%. That means households with a median-couple income of $89,066 can qualify for an average home in all of the city’s neighborhoods. Cleveland is also among the three cities that have seen no change in unaffordability compared to 2019.
-
Minneapolis, MN: The largest city in the top 10, Minneapolis’ share of unaffordable neighborhoods stood at 2.41%, up slightly from 2019. Married couples earning the median income ($149,214) have access to the vast majority of the city’s 83 neighborhoods.
-
Baltimore, MD: Married-couple households in Baltimore earn a median income of $141,634. At that rate, they can afford to live in 97.3% of the city’s 222 neighborhoods, making only 2.7% of neighborhoods unaffordable. That’s up from 0% pre-Covid.
-
Louisville, KY: Louisville is a highly competitive market for married households. For married-couple households earning a median wage, only 3.6% of neighborhoods are unaffordable, up 11.9% from pre-Covid times.
-
Cincinnati, OH: The second Ohio city in the top 10 ranks close to Cleveland in population but has a much higher median married-couple household income of $129,324. Only 3.6% of the city’s neighborhoods are unaffordable, up slightly from pre-pandemic levels.
-
Indianapolis, IN: Another competitive Midwestern market, only 4.4% of Indianapolis is unaffordable, making the vast majority of the city’s 92 neighborhoods accessible to the average married couple. Still, the percentage of unaffordable neighborhoods before Covid was less than 1%.
-
Oklahoma City, OK: Before Covid, Oklahoma City had 0% neighborhoods unaffordable for married-couple households earning the median wage. It has since increased to 4.69%, which is still tiny compared to the national average.
-
Kansas City, MO: Kansas City has one of the largest numbers of neighborhoods in the top 50 cities. Its married-couple residents can afford to live in nearly 95% of them, making only 5.6% of neighborhoods out of reach. Like Indiana, Kansas City’s share of unaffordable neighborhoods was less than 1% before Covid.
The biggest COVID losers
What's particularly astonishing about the current housing market is just how quickly affordability has declined since Covid.
Even factoring in the market correction after the 2022 peak, the price of existing homes is still nearly one-third higher than before Covid. Mortgage rates have also more than doubled since early 2022.
Combined, the rising home prices and interest rates led to the worst mortgage affordability in more than 40 years.
Against this backdrop, it’s hardly surprising that unaffordability increased in 47 of the 50 cities studied and remained flat in the other three. No city reported improved affordability in 2024 compared to 2019.
The biggest increases are led by San Jose (70 percentage points), San Diego (57.8 percentage points), Riverside-San Bernardino (51.9 percentage points), Sacramento (43 percentage points), Orlando (37.4 percentage points), Miami (34.7 percentage points), and New York City (33.4 percentage points).
The following cities in our study are ranked by the largest percentage point change in unaffordable neighborhoods since pre-Covid:
Uncategorized
Your financial plan may be riskier without bitcoin
It might actually be riskier to not have bitcoin in your portfolio than it is to have a small allocation.
Share this:


This article originally appeared in the Sound Advisory blog. Sound Advisory provide financial advisory services and are specialize in educating and guiding clients to thrive financially in a bitcoin-powered world. Click here to learn more.
“Belief is a wise wager. Granted that faith cannot be proved, what harm will come to you if you gamble on its truth and it proves false? If you gain, you gain all; if you lose, you lose nothing. Wager, then, without hesitation, that He exists.”
- Blaise Pascal
Blaise Pascal only lived to age 39 but became world-famous for many contributions in the fields of mathematics, physics, and theology. The above quote encapsulates Pascal’s wager—a philosophical argument for the Christian belief in the existence of God.
The argument's conclusion states that a rational person should live as though God exists. Even if the probability is low, the reward is worth the risk.
Pascal’s wager as a justification for bitcoin? Yes, I’m aware of the fallacies: false dichotomy, appeal to emotion, begging the question, etc. That is not the point. The point is that binary outcomes instigate extreme results, and the game theory of money suggests that it’s a winner-take-all game.
The Pascalian investor: A rational approach to bitcoin
Humanity’s adoption of “the best money over time” mimics a series of binary outcomes—A/B tests.
Throughout history, inferior forms of money have faded as better alternatives emerged (see India’s failed transition to a gold standard). And if bitcoin is trying to be the premier money of the future, it will either succeed or it won’t.
“If you ain’t first, you’re last.” -Ricky Bobby, Talladega Nights, on which monies succeed over time.
So, we can look at bitcoin success similarly to Pascal’s wager—let’s call it Satoshi’s wager. The translated points would go something like this:
- If you own bitcoin early and it becomes a globally valuable money, you gain immensely. ????
- If you own bitcoin and it fails, you’ve lost that value. ????
- If you don’t own bitcoin and it goes to zero, no pain and no gain. ????
- If you don’t own bitcoin and it succeeds, you will have missed out on the significant financial revolution of our lifetimes and fall comparatively behind. ????
If bitcoin is successful, it will be worth far more than it is today and have a massive impact on your financial future. If it fails, the losses are only limited to your exposure. The most that you could lose is the money that you invested.
It is hypothetically possible that bitcoin could be worth 100x more than it is today, but it can only possibly lose 1x its value as it goes to zero. The concept we’re discussing here is asymmetric upside - significant gains with relatively limited downside. In other words, the potential rewards of the investment outweigh the potential risks.
Bitcoin offers an asymmetric upside that makes it a wise investment for most portfolios. Even a small allocation provides potential protection against extreme currency debasement.
Salt, gasoline, and insurance

“Don’t over salt your steak, pour too much gas on the fire, or buy too much insurance.”
A little bit goes a long way, and you can easily overdo it. The same applies when looking at bitcoin in the context of a financial plan.
Bitcoin’s asymmetric upside gives it “insurance-like” qualities, and that insurance pays off very well in times of money printing. This was exemplified in 2020 when bitcoin's value increased over 300% in response to pandemic money printing, far outpacing stocks, gold, and bonds.
Bitcoin offers a similar asymmetric upside today. Bitcoin's supply is capped at 21 million coins, making it resistant to inflationary debasement. In contrast, the dollar's purchasing power consistently declines through unrestrained money printing. History has shown that societies prefer money that is hard to inflate.
If recent rampant inflation is uncontainable and the dollar system falters, bitcoin is well-positioned as a successor. This global monetary A/B test is still early, but given their respective sizes, a little bitcoin can go a long way. If it succeeds, early adopters will benefit enormously compared to latecomers. Of course, there are no guarantees, but the potential reward justifies reasonable exposure despite the risks.
Let’s imagine Nervous Nancy, an extremely conservative investor. She wants to invest but also take the least risk possible. She invests 100% of her money in short-term cash equivalents (short-term treasuries, money markets, CDs, maybe some cash in the coffee can). With this investment allocation, she’s nearly certain to get her initial investment back and receive a modest amount of interest as a gain. However, she has no guarantees that the investment returned to her will purchase the same amount as it used to. Inflation and money printing cause each dollar to be able to purchase less and less over time. Depending on the severity of the inflation, it might not buy anything at all. In other words, she didn’t lose any dollars, but the dollar lost purchasing power.
Now, let’s salt her portfolio with bitcoin.
99% short-term treasuries. 1% bitcoin.
With a 1% allocation, if bitcoin goes to zero overnight, she’ll have only lost a penny on the dollar, and her treasury interest will quickly fill the gap. Not at all catastrophic to her financial future.
However, if the hypothetical hyperinflationary scenario from above plays out and bitcoin grows 100x in purchasing power, she’s saved everything. Metaphorically, her entire dollar house burned down, and “bitcoin insurance” made her whole. Powerful. A little bitcoin salt goes a long way.
(When protecting against the existing system, it’s important to remember that you need to get your bitcoin out of the system. Keeping bitcoin on an exchange or with a counterparty will do you no good if that entity fails. If you view bitcoin as insurance, it’s essential to keep your bitcoin in cold storage and hold your keys. Otherwise, it’s someone else’s insurance.)
When all you have a hammer, everything looks like a…

A construction joke:
There are only three rules to construction: 1.) Always use the right tool for the job! 2.) A hammer is always the right tool! 3.) Anything can be a hammer!
Yeah. That’s what I thought, too. Slightly funny and mostly useless.
But if you spend enough time swinging a hammer, you’ll eventually realize it can be more than it first appears. Not everything is a nail. A hammer can tear down walls, break concrete, tap objects into place, and wiggle other things out. A hammer can create and destroy; it builds tall towers and humbles novice fingers. The use cases expand with the skill of the carpenter.
Like hammers, bitcoin is a monetary tool. And a 1-5% allocator to the asset typically sees a “speculative insurance” use case - valid. Bitcoin is speculative insurance, but it is not only speculative insurance. People invest and save in bitcoin for many different reasons.
I’ve seen people use bitcoin to pursue all of the following use cases:
- Hedging against a financial collapse (speculative insurance)
- Saving for family and future (long-term general savings and safety net)
- Growing a downpayment for a house (medium-term specific savings)
- Shooting for the moon in a manner equivalent to winning the lottery (gambling)
- Opting out of government-run, bank-controlled financial systems (financial optionality)
- Making a quick buck (short-term trading)
- Escaping a hostile country (wealth evacuation)
- Locking away wealth that can’t be confiscated (wealth preservation)
- As a means to influence opinions and gain followers (social status)
- Fix the money and fix the world (mission and purpose)
Keep this in mind when taking other people’s financial advice. They are often playing a different game than you. They have different goals, upbringings, worldviews, family dynamics, and circumstances. Even though they might use the same hammer as you, it could be for a completely different job.
Wrapping Up
A massive allocation to bitcoin may seem crazy to some people, yet perfectly reasonable to others. The same goes for having a 1% allocation.
But, given today’s macroeconomic environment and bitcoin’s trajectory, I find very few use cases where 0% bitcoin makes sense. By not owning bitcoin, you implicitly say that you are 100% certain it will fail and go to zero. Given its 14-year history so far, I’d recommend reducing your confidence. Nobody is 100% right forever. A little salt goes a long way. Your financial plan may be riskier without bitcoin. Diversify accordingly.
“We must learn our limits. We are all something, but none of us are everything.” - Blaise Pascal.
bonds pandemic stocks bitcoin link goldContact
Office: (208)-254-0142
Ste. 205
Eagle, ID 83616
Check the background of your financial professional on FINRA's BrokerCheck.The content is developed from sources believed to be providing accurate information. The information in this material is not intended as tax or legal advice. Please consult legal or tax professionals for specific information regarding your individual situation. Some of this material was developed and produced by FMG Suite to provide information on a topic that may be of interest. FMG Suite is not affiliated with the named representative, broker - dealer, state - or SEC - registered investment advisory firm. The opinions expressed and material provided are for general information, and should not be considered a solicitation for the purchase or sale of any security.
We take protecting your data and privacy very seriously. As of January 1, 2020 the California Consumer Privacy Act (CCPA) suggests the following link as an extra measure to safeguard your data: Do not sell my personal information.
Copyright 2024 FMG Suite.
Sound Advisory, LLC (“SA”) is a registered investment advisor offering advisory services in the State of Idaho and in other jurisdictions where exempt. Registration does not imply a certain level of skill or training. The information on this site is not intended as tax, accounting, or legal advice, as an offer or solicitation of an offer to buy or sell, or as an endorsement of any company, security, fund, or other securities or non-securities offering. This information should not be relied upon as the sole factor in an investment-making decision. Past performance is no indication of future results. Investment in securities involves significant risk and has the potential for partial or complete loss of funds invested. It should not be assumed that any recommendations made will be profitable or equal any performance noted on this site.
The information on this site is provided “AS IS” and without warranties of any kind, either express or implied. To the fullest extent permissible pursuant to applicable laws, Sound Advisory LLC disclaims all warranties, express or implied, including, but not limited to, implied warranties of merchantability, non-infringement, and suitability for a particular purpose.
SA does not warrant that the information on this site will be free from error. Your use of the information is at your sole risk. Under no circumstances shall SA be liable for any direct, indirect, special or consequential damages that result from the use of, or the inability to use, the information provided on this site, even if SA or an SA authorized representative has been advised of the possibility of such damages. Information contained on this site should not be considered a solicitation to buy, an offer to sell, or a recommendation of any security in any jurisdiction where such offer, solicitation, or recommendation would be unlawful or unauthorized.
Uncategorized
The Question You Should Ask Whenever You’re Wrong
“Never bet on the end of the world. It only comes once, which is pretty long odds.” — Arthur Cashin, New York Stock Exchange Floor Manager (“Maxims…
Share this:

“Never bet on the end of the world. It only comes once, which is pretty long odds.” — Arthur Cashin, New York Stock Exchange Floor Manager (“Maxims of Wall Street,” p. 110)
Since Joe Biden gave his State of the Union (or shall we say “Disunion”) speech last week, I’ve encountered a plethora of negative comments about the future of America.
Is the American Dream Over?
“If Biden is re-elected, it will be the end of the American Dream as we know it,” said one pundit on Fox News.
The critics are out in force. Supply-side economist Steve Moore writes, “Biden is intentionally trying to dismantle the American economy with his imbecile energy, climate change, crime, border, inflation, debt and high tax policies.”
Glenn Beck, the host of Blaze TV, recently warned that America may face multiple terrorist attacks in one day, similar to 9/11, given the open borders policy of the Biden Administration.
Recently, I attended a private meeting of political leaders and pundits who thought that President Biden’s address was the most polemical, shrill and divisive talk they had ever heard.
I’ve been watching State of the Union addresses all my adult life, by both Republicans and Democrats, and in many ways they are always polemical and divisive. What was amazing to me is how “sleepy” Joe Biden performed. He must have been well rested and jacked up with some pretty incredible drugs to do as well as he did.
President Biden did say some things that were crazy, such as when he asserted that voting for former president Donald Trump is a “vote against democracy.”
Hey, wasn’t it the Democrats who want to remove Trump from the November ballot in Colorado and other states? Talk about anti-democratic! I was glad to see the Supreme Court ruled 9-0 against the Colorado decision. Let the people decide. Isn’t that what democracy is all about?
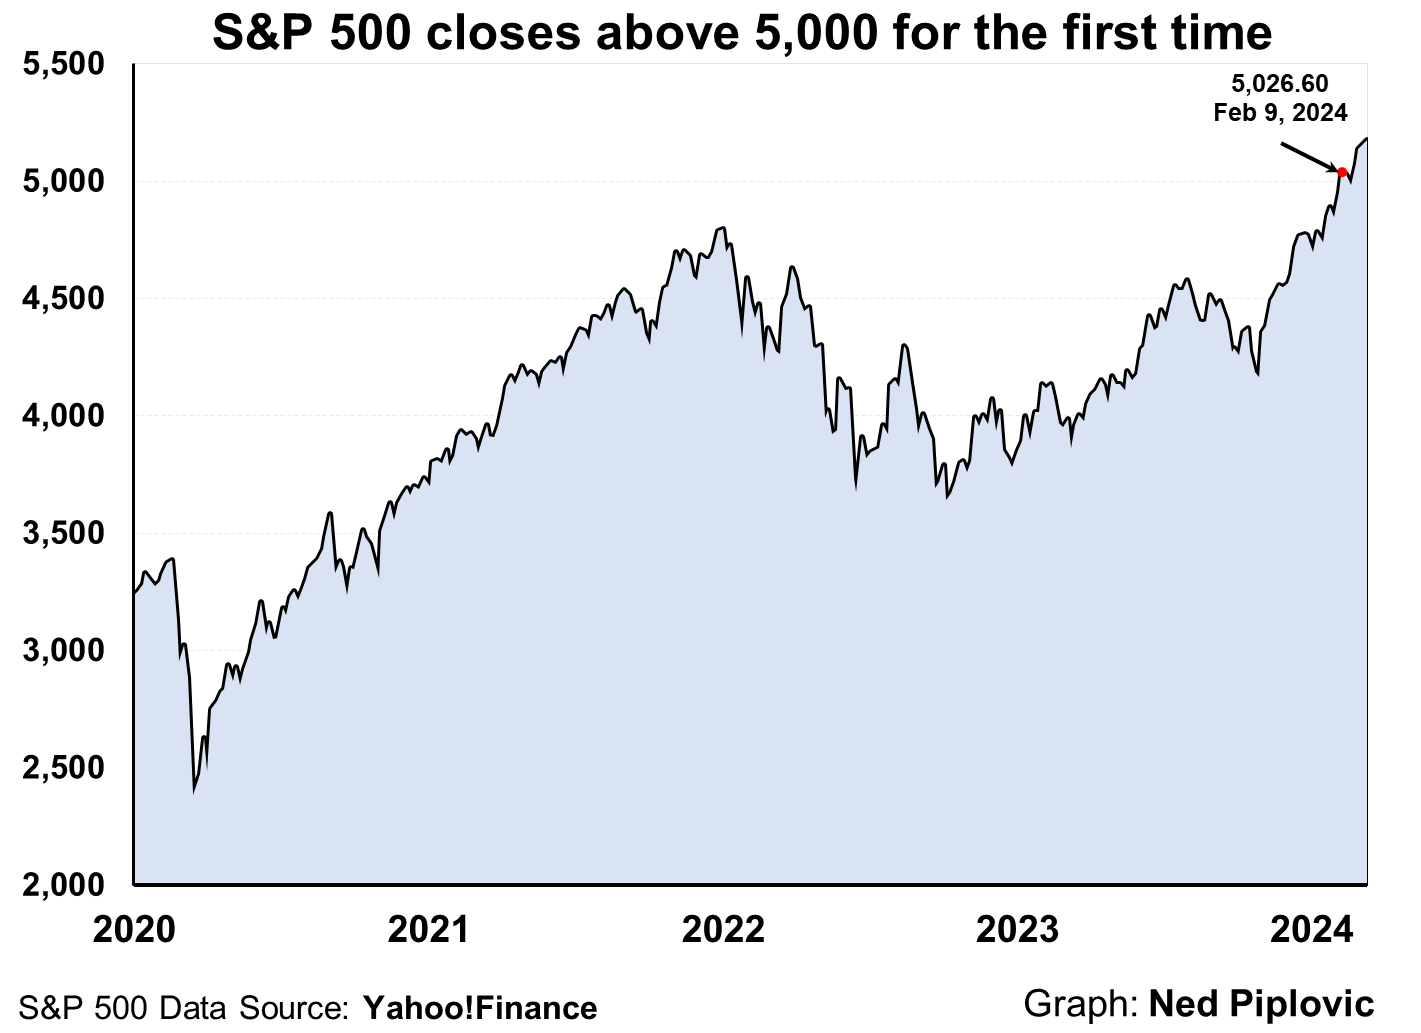
Why Then Is the Stock Market at an All-Time High?
Kevin Roberts, the new president of the Heritage Foundation, recently declared, “The American Dream is being threatened as never before!”
If that is true, why is the stock market at or near an all-time high? What are the prophets of doom and gloom missing?
That’s the question I always ask when I’m wrong about something:
“What am I missing?”
Wall Street is a good bellwether of what is going on the country. So far, the benefits outweigh the costs. The economy is recovering from the Covid pandemic, inflation is coming down, corporate profits are strong, new technologies are being introduced and there’s a strong movement to reverse the “cancel” and “woke” culture in the United States.
We have gridlock on Capitol Hill that is keeping a lot of bad legislation from becoming law. The Supreme Court has reversed many bad decisions by the lower courts.
We Remain Fully Invested
So, all is not lost after all. In my newsletter, Forecasts & Strategies, we remain fully invested, despite occasional corrections in the market.
We are also well diversified in some “contrarian” investments such as Bitcoin and gold, both of which continue to outperform and offset any selloffs in the stock market.
By remaining positive and fully invested, we have made good money in 2024.
The American Obituary Has Been Written Many Times
The American economy has been left for dead many times, only to be resuscitated with renewed vigor. We have survived civil and world wars, the Great Depression, the inflationary 1970s, terrorist attacks and more.
As J.P. Morgan once said, “The man who is a bear on the United States will eventually go broke” (“Maxims,” p. 111).
I encourage you to read my favorite J.P. Morgan story found on pp. 218-219 in “The Maxims of Wall Street.” See www.skousenbooks.com.
American exceptionalism is alive and well. We are still the Promised Land with millions wanting to live and work here.
Solving Our Unfunded Liability Problem: Look to Canada!
One serious problem in America is the irresponsible, out-of-control deficit spending and national debt, created by both Republican and Democratic leaders over the years. The trouble is getting worse, with rising interest rates to pay the debt and the growing unfunded liabilities from Social Security and Medicare.
Robert Poole of the Reason Foundation warns:
“The Congressional Budget Office (CBO)’s latest 10-year projection is frightening. CBO projects annual federal budget deficits to increase steadily, exceeding $2.5 trillion by 2034, assuming current policies continue… The federal government is projected to borrow an additional $20 trillion over the next decade, the CBO estimates.
“One driving factor is the impact of higher interest rates on the current $34 trillion (and growing) national debt… By 2034, annual interest expense is projected to be $1.6 trillion — more than one-fourth of all federal tax revenue.
“The Penn Wharton Budget Model suggests that the United States has about 20 years to fix this debt/deficit problem — ‘after which no amount of future tax increases or spending cuts could avoid the government defaulting on its debt.’
“On August 2, 2023, Fitch Ratings downgraded the federal government’s long-term debt rating from AAA to AA+. And on November 10, 2023, Moody’s Investors Service reduced its outlook on the U.S. credit rating from ‘stable’ to ‘negative.’ Standard & Poor’s did its downgrade in 2011. These are warning shots across the ship of state’s bow.”
Sounds ominous. What to do?
Canada faced a similar problem back in the mid-1990s. Deficits were getting out of hand, and the Canadian dollar was sinking. The Conservative Party and the Liberty Party of Canada worked together and resolved to cut government spending, lay off federal workers and then went on a supply-side tax-cutting program that resulted in economic growth and deficit reduction.
What about the unfunded liability problem, which causes national bankruptcy? Again, Canada offers an incredible example of solving the issue.
Last week, Andy Puzder and Terrence Keeley wrote an op-ed in The Wall Street Journal on the success of the Canadian social security system, which has earned a 9.3% annualized return over the past 10 years (versus almost zero return in our Social Security Trust Fund). They wrote:
“The Canada Pension Plan’s superiority stems from its asset allocation. The fund invests about 57% of its assets in equities and 12% in bonds; the rest is divided among real estate, infrastructure and credit. Over the past 10 years, the Canada Pension Plan has realized a 9.3% annualized net return. Similarly to how Social Security works, Canadian citizens pay into the program and are guaranteed lifetime benefits.”
At some point, the United States will need to imitate the Canadian model. Here is a chart on the difference between the two:

In sum, there are solutions to all of our problems — if we know where to look and remain optimistic.
Sound Advice from the ‘Investment Bible’
In my home, I have a whole section of my library devoted to dozens of books written by doomsayers and Cassandras, such as “The Coming Deflation”…. “How to Prosper During the Coming Bad Years”… “Bankruptcy 1995”… “The End of Inflation” and so on.
I’ve also collected a bunch of quotes on doomsayers and Cassandras in “The Maxims of Wall Street.”
Jim Woods, my colleague at Eagle Publishing, is a big fan.

Jim states, “I’ve always felt that a collection of wisdom from the best brains in that industry has been most special to me. And on this front, there is no better ‘how to’ anthology than the one by my friend, fellow Fast Money Alert co-editor and brilliant economist, Dr. Mark Skousen. The ‘Maxims of Wall Street’ is a collection of some of the greatest wisdom ever to flow from the biggest and brightest names on Wall Street. Great investors such as Jesse Livermore, Baron Rothschild, J.P. Morgan, Benjamin Graham, Warren Buffett, Peter Lynch and John Templeton are just a sneak peek at some of the names you’ll discover in this fantastic collection. Then, there is profundity from the likes of Ben Franklin, John D. Rockefeller, Joe Kennedy, Bernard Baruch, John Maynard Keynes, Steve Forbes and numerous other luminaries too copious to mention.”
If you don’t have an autographed copy of my collection of quotes, stories and wisdom of the world’s top traders and investors, please order a copy now.
It is in its 10th edition, having sold nearly 50,000 copies. It has been endorsed by Warren Buffett, Kevin O’Leary, Jack Bogle, Kim Githler, Bert Dohmen, Richard Band and Gene Epstein in Barron’s.
I offer it cheaply to my Skousen CAFÉ readers: Only $21 for the first copy, and all additional copies are $11 each (they make a great gift to clients, friends, relatives and your favorite broker or money manager). I sign and number each one, then mail it at no extra charge if you live in the United States. If you order an entire box (32 copies), the price is only $327. As Hetty Green, the first female millionaire, once said, “When I see a good thing going cheap, I buy a lot of it!”
To order, go to www.skousenbooks.com.
You Nailed it!
Friedrich Hayek Won the Nobel Prize 50 Years Ago
“Mises and Hayek articulated and vastly enriched the principles of Adam Smith at a crucial time in this century.” — Vernon Smith (2002 Nobel prize in economics)
March 23 is the anniversary of the passing of a giant in economics — the Austrian economist Friedrich Hayek (1899-1992).
He is most famous for his bestselling book “The Road to Serfdom,” written near the end of World War II, an admittedly a pessimistic book, warning the West that its move toward socialism, fascism and communism was indeed a “road to serfdom.”
Then, when he won the Nobel prize in economics in 1974, he warned again of the dangers of “accelerating inflation,” which he said, were “brought about by policies which the majority of economists recommended and even urged governments to pursue. We have indeed at the moment little cause for pride: as a profession we have made a mess of things.”
Fortunately, we have moved away from the road to serfdom, especially after the collapse of the Berlin Wall and the Soviet socialist central planning model.
But the road to freedom has been a checkered one, and we must always be alert to losing our liberties in the name of inequality, fairness and social justice.
Last month, Tom Woods interviewed me in honor of the 50th anniversary of Hayek’s winning the Nobel prize. Watch the interview here.

Mark Skousen, Friedrich Hayek and Gary North in Austria, 1985
I had the pleasure of interviewing Hayek for three hours in the Austrian alps in 1985. He was especially happy to hear I resurrected his macroeconomic model in developing gross output (GO). See www.grossoutput.com, a measure of Hayek’s triangles.
This week, Larry Reed, former president of the Foundation for Economic Education, wrote this wonderful tribute to Hayek.
Highly recommended.
Good investing, AEIOU,
Mark Skousen
The post The Question You Should Ask Whenever You’re Wrong appeared first on Stock Investor.
bonds pandemic equities bitcoin real estate canadian dollar gold

Q4 Update: Delinquencies, Foreclosures and REO


Pharma industry reputation remains steady at a ‘new normal’ after Covid, Harris Poll finds


These Cities Have The Highest (And Lowest) Share Of Unaffordable Neighborhoods In 2024


The Question You Should Ask Whenever You’re Wrong


Part 1: Current State of the Housing Market; Overview for mid-March 2024


Walmart and Target make key self-checkout changes to fight theft


Your financial plan may be riskier without bitcoin


The best real estate coaching programs for 2024


Bougie Broke The Financial Reality Behind The Facade


Futures Rise To New Record High Ahead Of Data Deluge
-

 Uncategorized3 weeks ago
All Of The Elements Are In Place For An Economic Crisis Of Staggering Proportions
-

 International6 days ago
EyePoint poaches medical chief from Apellis; Sandoz CFO, longtime BioNTech exec to retire
-

 Uncategorized4 weeks ago
California Counties Could Be Forced To Pay $300 Million To Cover COVID-Era Program
-

 Uncategorized3 weeks ago
Apparel Retailer Express Moving Toward Bankruptcy
-

 Uncategorized4 weeks ago
Industrial Production Decreased 0.1% in January
-

 International6 days ago
Walmart launches clever answer to Target’s new membership program
-

 Uncategorized4 weeks ago
RFK Jr: The Wuhan Cover-Up & The Rise Of The Biowarfare-Industrial Complex
-

 Uncategorized3 weeks ago
GOP Efforts To Shore Up Election Security In Swing States Face Challenges