California home sales edge higher in February amid geopolitical tensions and inflation uncertainty, C.A.R. reports
California home sales edge higher in February amid geopolitical tensions and inflation uncertainty, C.A.R. reports
PR Newswire
LOS ANGELES, March 15, 2022
Existing, single-family home sales totaled 424,640 in February on a seasonally adjusted annua…
Share this:

California home sales edge higher in February amid geopolitical tensions and inflation uncertainty, C.A.R. reports
PR Newswire
LOS ANGELES, March 15, 2022
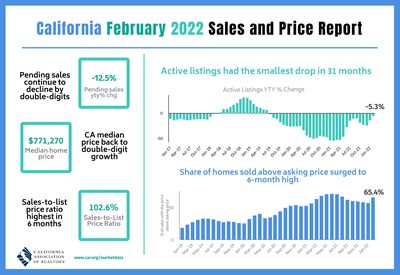
- Existing, single-family home sales totaled 424,640 in February on a seasonally adjusted annualized rate, down 4.5 percent from January and down 8.2 percent from February 2021.
- February's statewide median home price was $771,270, up 0.7 percent from January and up 10.3 percent from February 2021.
- Year-to-date statewide home sales were down 8.3 percent in February.
LOS ANGELES, March 15, 2022 /PRNewswire/ -- Despite higher interest rates alongside geopolitical uncertainty caused by the Russia-Ukraine conflict, California's housing market continued to maintain a solid sales pace even while the number of homes sold were lower than last year's unusually strong market, the CALIFORNIA ASSOCIATION OF REALTORS® (C.A.R.) said today.
Infographic: https://www.car.org/Global/Infographics/2022-02-Sales-and-Price
Closed escrow sales of existing, single-family detached homes in California totaled a seasonally adjusted annualized rate of 424,640 in February, according to information collected by C.A.R. from more than 90 local REALTOR® associations and MLSs statewide. The statewide annualized sales figure represents what would be the total number of homes sold during 2022 if sales maintained the February pace throughout the year. It is adjusted to account for seasonal factors that typically influence home sales.
February's sales pace was down 4.5 percent on a monthly basis from 444,540 in January and was down 8.2 percent from a year ago, when 462,720 homes were sold on an annualized basis. The year-over-year sales decrease was the eighth straight decline and the smallest in seven months.
"Despite higher mortgage rates, California's housing market is holding up remarkably strong, with home prices reaccelerating, market competition growing and signs that the listings crunch is thawing," said C.A.R. President Otto Catrina, a Bay Area real estate broker and REALTOR®. "Prospective buyers are taking advantage of still-low rates before they move higher and getting a jump on competition before the start of the spring homebuying season."
California home prices continued to increase from the prior year, picking up momentum again after slowing down for eight consecutive months. The statewide median price inched up to $771,270 in February, up 0.7 percent from January's $765,610 and up 10.3 percent from the $699,000 recorded in February 2021. The stronger-than-expected growth in the statewide median price is attributed partly to a change in the mix of sales toward homes in the million-dollar price range, as sales jumped in higher-priced regions such as the Central Coast and the San Francisco Bay Area.
"While home sales declined from both the previous month and year, February's sales pace was still the second highest sales level for a February in the last 10 years and strong relative to pre-pandemic levels of 2018 and 2019," said C.A.R. Vice President and Chief Economist Jordan Levine. "However, the invasion of Ukraine has created geopolitical headwinds and pushed up inflation up a notch, which may keep mortgage rates elevated and cause the housing market to retreat amid the uncertainty."
At an index of 67 in February, C.A.R.'s monthly Consumer Housing Sentiment Index dropped 2 points from last month as consumers acknowledged the current market challenges and felt increasingly pessimistic about homebuying opportunities. Consumers who thought it was a "Good time to buy" dropped to 16 in February from 19 last month and from 28 points last year. Still, one in every four consumers are holding out hope that it will be easier to find a home in the next 12 months and nearly two in every three believe that home prices will rise over the same period of time.
Other key points from C.A.R.'s February 2022 resale housing report include:
- At the regional level, all major regions except the Central Valley recorded a decrease in sales on a year-over-year basis, but lower-priced areas continued to fare better than higher-priced areas in the Golden State. The Central Coast region had the sharpest decline of all regions, with sales in February dropping 16.3 percent from a year ago. To put things into perspective though, housing demand was abnormally strong early last year with sales in February 2021 surging 22.4 percent from the prior year. The San Francisco Bay Area and Southern California also experienced a double-digit or a near double-digit sales loss of -13.7 percent and -9.9 percent, respectively in February. Home sales in the Far North also dipped 8.5 percent, but the pace was slightly better than the aforementioned regions. The Central Valley was the only region with a sales gain in February, increasing 1.2 percent from a year ago.
- Over 70 percent of all counties tracked by C.A.R. experienced a dip in existing home sales from a year ago, with 24 counties declining more than 10 percent on a year-over-year basis. With many properties destroyed by the Dixie Fire last summer, Plumas had the largest decline of all counties in February, falling 62.1 percent from a year ago. Mariposa (-50.0 percent), Amador (-35.2 percent), and Mendocino (-32.7 percent) were three other counties in California that also experienced a sales drop of more than 30 percent last month. Counties with a sales decline from last year had an average decrease of -17.7 percent in February. Fourteen counties experienced a sales gain from last year, with Yuba (65.3 percent) surging the most, followed by Siskiyou (45.8 percent) and Sutter (31.9 percent).
- Home prices continued to grow in all major regions in the state, with all five posting double-digit year-over-year gains in their median price. The San Francisco Bay Area recorded the highest year-over-year price gain at a 15.9 percent increase, followed by the Central Valley (14.8 percent), Southern California (12.6 percent), the Far North (11.9 percent), and the Central Coast (10.1 percent).
- Despite slower price growth due to rising mortgage rates, home prices continued to increase across the state, with 24 California counties setting new record high median prices in February. All but three counties tracked by C.A.R. experienced an increase in their median price in February, with 38 of them surging by double-digits from a year ago. Santa Cruz had the biggest year-over-year price increase at 30.4 percent, followed by Glenn (29.1 percent) and Yolo (28.2 percent). Three counties registered a median price decline from last year, with Mono dropping the most at -30.8 percent, followed by Santa Barbara (-10.6 percent) and Mendocino (-4.8 percent).
- California's Unsold Inventory Index (UII) rose in February as active listings climbed from January to the highest level in three months. February's UII was 2.0 months and 2.1 months in February 2021. The index indicates the number of months it would take to sell the supply of homes on the market at the current rate of sales.
- The median number of days it took to sell a California single-family home was 9 days in February and 10 days in February 2021.
- C.A.R.'s statewide sales-price-to-list-price ratio* was 102.6 percent in February 2022 and 101.0 percent in February 2021.
- The statewide average price per square foot** for an existing single-family home remained elevated. February's price per square foot was $392, up from $338 in February a year ago.
- The 30-year, fixed-mortgage interest rate averaged 3.76 percent in February, up from 2.81 percent in February 2021, according to Freddie Mac. The five-year, adjustable mortgage interest rate averaged 2.87 percent, compared to 2.83 percent in February 2021.
Note: The County MLS median price and sales data in the tables are generated from a survey of more than 90 associations of REALTORS® throughout the state and represent statistics of existing single-family detached homes only. County sales data are not adjusted to account for seasonal factors that can influence home sales. Movements in sales prices should not be interpreted as changes in the cost of a standard home. The median price is where half sold for more and half sold for less; medians are more typical than average prices, which are skewed by a relatively small share of transactions at either the lower end or the upper end. Median prices can be influenced by changes in cost, as well as changes in the characteristics and the size of homes sold. The change in median prices should not be construed as actual price changes in specific homes.
*Sales-to-list-price ratio is an indicator that reflects the negotiation power of home buyers and home sellers under current market conditions. The ratio is calculated by dividing the final sales price of a property by its last list price and is expressed as a percentage. A sales-to-list ratio with 100 percent or above suggests that the property sold for more than the list price, and a ratio below 100 percent indicates that the price sold below the asking price.
**Price per square foot is a measure commonly used by real estate agents and brokers to determine how much a square foot of space a buyer will pay for a property. It is calculated as the sale price of the home divided by the number of finished square feet. C.A.R. currently tracks price-per-square foot statistics for 50 counties.
Leading the way…® in California real estate for more than 110 years, the CALIFORNIA ASSOCIATION OF REALTORS® (www.car.org) is one of the largest state trade organizations in the United States with more than 217,000 members dedicated to the advancement of professionalism in real estate. C.A.R. is headquartered in Los Angeles.
February 2022 County Sales and Price Activity | |||||||||
(Regional and condo sales data not seasonally adjusted) | |||||||||
February 2022 | Median Sold Price of Existing Single-Family Homes | Sales | |||||||
State/Region/County | Feb. 2022 | Jan. 2022 | Feb. 2021 | Price | Price | Sales | Sales | ||
Calif. Single-family home | $771,270 | $765,610 | r | $699,000 | 0.7% | 10.3% | -4.5% | -8.2% | |
Calif. Condo/Townhome | $640,000 | $600,000 | $530,000 | 6.7% | 20.8% | 9.4% | -11.2% | ||
Los Angeles Metro Area | $725,000 | $700,000 | $649,000 | 3.6% | 11.7% | -4.7% | -10.9% | ||
Central Coast | $912,250 | $920,400 | $828,500 | -0.9% | 10.1% | 7.8% | -16.3% | ||
Central Valley | $465,000 | $455,000 | $405,000 | 2.2% | 14.8% | -1.0% | 1.2% | ||
Far North | $375,000 | $380,000 | $335,000 | -1.3% | 11.9% | -3.0% | -8.5% | ||
Inland Empire | $551,000 | $539,000 | $470,000 | 2.2% | 17.2% | -5.0% | -6.4% | ||
San Francisco Bay Area | $1,335,000 | $1,200,000 | $1,151,500 | 11.3% | 15.9% | 6.6% | -13.7% | ||
Southern California | $760,000 | $740,000 | $675,000 | 2.7% | 12.6% | -2.5% | -9.9% | ||
San Francisco Bay Area | |||||||||
Alameda | $1,350,000 | $1,250,000 | $1,100,000 | 8.0% | 22.7% | 13.0% | -9.4% | ||
Contra Costa | $935,000 | $829,000 | $817,500 | 12.8% | 14.4% | -4.3% | -19.6% | ||
Marin | $1,580,000 | $1,450,000 | $1,540,000 | 9.0% | 2.6% | 38.6% | -22.5% | ||
Napa | $1,034,500 | $884,000 | $931,500 | 17.0% | 11.1% | 19.2% | -8.8% | ||
San Francisco | $1,900,000 | $1,630,000 | $1,786,400 | 16.6% | 6.4% | 12.6% | 5.9% | ||
San Mateo | $2,100,000 | $2,000,000 | $1,900,000 | 5.0% | 10.5% | -0.5% | -24.4% | ||
Santa Clara | $1,820,000 | $1,716,000 | $1,486,250 | 6.1% | 22.5% | 9.9% | -17.1% | ||
Solano | $605,000 | $579,000 | $509,750 | 4.5% | 18.7% | 4.4% | 8.7% | ||
Sonoma | $819,000 | $789,000 | $740,000 | 3.8% | 10.7% | 6.0% | -15.2% | ||
Southern California | |||||||||
Los Angeles | $773,490 | $800,960 | $686,760 | r | -3.4% | 12.6% | -4.5% | -7.3% | |
Orange | $1,260,000 | $1,195,000 | $995,000 | 5.4% | 26.6% | -5.1% | -26.0% | ||
Riverside | $605,030 | $590,000 | $519,500 | 2.5% | 16.5% | -4.7% | -8.2% | ||
San Bernardino | $450,000 | $450,000 | $389,900 | 0.0% | 15.4% | -5.3% | -3.4% | ||
San Diego | $888,000 | $875,000 | $765,000 | 1.5% | 16.1% | 7.3% | -5.6% | ||
Ventura | $887,500 | $850,000 | $750,000 | 4.4% | 18.3% | -1.7% | -16.8% | ||
Central Coast | |||||||||
Monterey | $885,000 | $875,000 | $820,000 | 1.1% | 7.9% | -0.6% | -12.8% | ||
San Luis Obispo | $830,500 | $851,500 | $700,000 | -2.5% | 18.6% | 23.3% | -26.2% | ||
Santa Barbara | $1,050,000 | $912,500 | $1,174,080 | 15.1% | -10.6% | 1.1% | -5.3% | ||
Santa Cruz | $1,380,000 | $1,257,500 | $1,058,000 | 9.7% | 30.4% | 10.7% | -18.4% | ||
Central Valley | |||||||||
Fresno | $405,000 | $395,500 | $350,000 | 2.4% | 15.7% | 5.3% | 7.2% | ||
Glenn | $412,500 | $332,500 | $319,500 | 24.1% | 29.1% | 42.9% | 25.0% | ||
Kern | $370,000 | $367,000 | $295,000 | 0.8% | 25.4% | -3.3% | -4.9% | ||
Kings | $327,000 | $322,500 | $280,000 | 1.4% | 16.8% | -13.6% | -8.1% | ||
Madera | $400,000 | $394,000 | $354,500 | 1.5% | 12.8% | 13.4% | -0.8% | ||
Merced | $390,000 | $387,380 | $318,750 | 0.7% | 22.4% | -29.0% | -6.6% | ||
Placer | $675,000 | $670,000 | $599,500 | 0.7% | 12.6% | 2.1% | -2.0% | ||
Sacramento | $541,500 | $524,000 | $463,000 | 3.3% | 17.0% | 5.2% | 2.4% | ||
San Benito | $860,000 | $842,500 | $700,000 | 2.1% | 22.9% | 2.8% | 8.8% | ||
San Joaquin | $505,500 | $499,950 | $436,300 | 1.1% | 15.9% | -6.2% | 2.8% | ||
Stanislaus | $452,400 | $450,000 | $405,000 | 0.5% | 11.7% | -16.3% | -1.3% | ||
Tulare | $338,000 | $333,000 | $288,500 | 1.5% | 17.2% | -3.1% | 2.8% | ||
Far North | |||||||||
Butte | $426,500 | $456,000 | $397,000 | -6.5% | 7.4% | 14.3% | 5.7% | ||
Lassen | $239,000 | $259,000 | $208,250 | -7.7% | 14.8% | 0.0% | 15.0% | ||
Plumas | $339,000 | $460,000 | $329,500 | -26.3% | 2.9% | -59.3% | -62.1% | ||
Shasta | $375,000 | $375,000 | $329,950 | 0.0% | 13.7% | -0.5% | -12.1% | ||
Siskiyou | $340,000 | $296,000 | $322,500 | 14.9% | 5.4% | -16.7% | 45.8% | ||
Tehama | $311,250 | $359,000 | $299,000 | -13.3% | 4.1% | -7.7% | -26.5% | ||
Other Calif. Counties | |||||||||
Amador | $449,000 | $400,000 | $406,280 | 12.3% | 10.5% | -10.3% | -35.2% | ||
Calaveras | $510,000 | $467,500 | $441,500 | 9.1% | 15.5% | -3.8% | 1.3% | ||
Del Norte | $390,000 | $372,500 | $359,000 | 4.7% | 8.6% | -12.5% | -26.3% | ||
El Dorado | $730,000 | $607,500 | $577,500 | 20.2% | 26.4% | 6.6% | -13.5% | ||
Humboldt | $452,500 | $425,000 | $360,000 | 6.5% | 25.7% | -21.4% | -21.4% | ||
Lake | $360,000 | $349,900 | $326,500 | 2.9% | 10.3% | -6.2% | -29.1% | ||
Mariposa | $446,250 | $350,000 | $397,500 | 27.5% | 12.3% | -25.0% | -50.0% | ||
Mendocino | $500,000 | $508,500 | $525,000 | -1.7% | -4.8% | -13.2% | -32.7% | ||
Mono | $992,500 | $950,000 | $1,435,000 | 4.5% | -30.8% | -33.3% | -28.6% | ||
Nevada | $547,500 | $550,000 | $519,500 | -0.5% | 5.4% | -22.9% | -22.2% | ||
Sutter | $420,000 | $415,000 | $395,000 | 1.2% | 6.3% | -13.9% | 31.9% | ||
Tuolumne | $433,500 | $386,750 | $375,000 | 12.1% | 15.6% | 28.6% | -11.1% | ||
Yolo | $666,420 | $542,500 | $520,000 | 22.8% | 28.2% | 31.4% | -13.2% | ||
Yuba | $450,000 | $402,500 | $370,000 | 11.8% | 21.6% | -8.0% | 65.3% | ||
r = revised |
February 2022 County Unsold Inventory and Days on Market | ||||||||||
(Regional and condo sales data not seasonally adjusted) | ||||||||||
February 2022 | Unsold Inventory Index | Median Time on Market | ||||||||
State/Region/County | Feb. 2022 | Jan. 2022 | Feb. 2021 | Feb. 2022 | Jan. 2022 | Feb. 2021 | ||||
Calif. Single-family home | 2.0 | 1.8 | 2.1 | r | 9.0 | 12.0 | 10.0 | |||
Calif. Condo/Townhome | 1.8 | 1.8 | 2.3 | r | 8.0 | 11.0 | 13.0 | |||
Los Angeles Metro Area | 2.1 | 1.9 | 2.3 | r | 10.0 | 13.0 | 11.0 | |||
Central Coast | 2.0 | 2.1 | 2.5 | r | 10.0 | 11.0 | 13.0 | |||
Central Valley | 1.9 | 1.7 | 1.9 | 7.0 | 10.0 | 7.0 | ||||
Far North | 3.0 | 2.7 | 2.8 | 22.0 | 27.0 | 37.0 | ||||
Inland Empire | 2.0 | 1.9 | 2.1 | r | 14.0 | 16.0 | 15.0 | |||
San Francisco Bay Area | 1.9 | 1.6 | 2.1 | 9.0 | 12.0 | 10.0 | ||||
Southern California | 2.0 | 1.8 | 2.2 | r | 9.0 | 12.0 | 10.0 | |||
San Francisco Bay Area | ||||||||||
Alameda | 1.7 | 1.5 | 1.7 | 8.0 | 10.0 | 8.0 | ||||
Contra Costa | 1.9 | 1.4 | 1.7 | 8.0 | 9.0 | 7.5 | ||||
Marin | 1.6 | 2.0 | 2.1 | 10.0 | 29.0 | 22.0 | ||||
Napa | 3.1 | 3.4 | 3.8 | 30.0 | 47.5 | 38.0 | ||||
San Francisco | 2.4 | 2.0 | 2.3 | r | 12.0 | 13.0 | 13.0 | |||
San Mateo | 2.1 | 1.6 | 2.4 | 7.0 | 10.0 | 9.0 | ||||
Santa Clara | 2.0 | 1.6 | 2.2 | 7.0 | 7.0 | 8.0 | ||||
Solano | 1.4 | 1.3 | 1.6 | 24.0 | 32.5 | 29.0 | ||||
Sonoma | 2.2 | 1.9 | 3.0 | 27.0 | 42.0 | 38.0 | ||||
Southern California | ||||||||||
Los Angeles | 2.2 | 2.0 | 2.4 | r | 10.0 | 13.0 | 10.0 | |||
Orange | 2.0 | 1.6 | 2.4 | r | 7.0 | 8.0 | 9.0 | |||
Riverside | 1.9 | 1.8 | 2.1 | r | 14.0 | 16.0 | 14.0 | |||
San Bernardino | 2.1 | 2.1 | 2.1 | r | 13.0 | 16.0 | 15.0 | |||
San Diego | 1.5 | 1.5 | 1.8 | 7.0 | 9.0 | 7.0 | ||||
Ventura | 2.3 | 2.0 | 2.4 | r | 20.0 | 20.0 | 24.0 | |||
Central Coast | ||||||||||
Monterey | 2.2 | 2.1 | 2.8 | 10.0 | 10.0 | 14.0 | ||||
San Luis Obispo | 2.0 | 2.3 | 2.2 | r | 9.0 | 9.0 | 12.0 | |||
Santa Barbara | 1.9 | 1.9 | 2.4 | 10.0 | 12.0 | 13.0 | ||||
Santa Cruz | 2.2 | 2.0 | 2.5 | 9.0 | 13.5 | 14.5 | ||||
Central Valley | ||||||||||
Fresno | 2.0 | 1.9 | 2.0 | 7.0 | 9.0 | 7.0 | ||||
Glenn | 2.0 | 3.0 | 2.7 | r | 14.0 | 7.5 | 12.5 | |||
Kern | 1.9 | 1.7 | 2.2 | 8.0 | 9.0 | 9.0 | ||||
Kings | 2.3 | 2.1 | 2.7 | 7.0 | 10.0 | 6.0 | ||||
Madera | 2.8 | 3.1 | 2.4 | 12.0 | 17.0 | 10.0 | ||||
Merced | 2.5 | 1.5 | 2.4 | r | 9.0 | 14.5 | 10.0 | |||
Placer | 1.8 | 1.6 | 1.8 | 6.0 | 9.0 | 6.0 | ||||
Sacramento | 1.5 | 1.4 | 1.6 | 7.0 | 8.0 | 6.0 | ||||
San Benito | 2.4 | 2.2 | 3.3 | 19.0 | 12.0 | 11.0 | ||||
San Joaquin | 2.0 | 1.6 | 1.9 | 8.0 | 12.5 | 7.0 | ||||
Stanislaus | 1.9 | 1.4 | 1.9 | r | 9.0 | 10.0 | 7.0 | |||
Tulare | 1.9 | 1.9 | 2.0 | 12.0 | 11.0 | 11.5 | ||||
Far North | ||||||||||
Butte | 2.1 | 2.4 | 2.6 | r | 7.0 | 14.5 | 13.5 | |||
Lassen | 3.4 | 3.6 | 3.3 | 107.0 | 80.0 | 106.0 | ||||
Plumas | 8.7 | 3.1 | 4.7 | 124.0 | 127.0 | 96.0 | ||||
Shasta | 2.9 | 2.5 | 2.5 | 19.0 | 19.0 | 27.0 | ||||
Siskiyou | 3.9 | 3.5 | 4.8 | 66.5 | 39.0 | 44.0 | ||||
Tehama | 3.2 | 2.9 | 2.7 | 58.5 | 49.0 | 77.0 | ||||
Other Calif. Counties | ||||||||||
Amador | 3.1 | 2.3 | 2.2 | r | 23.0 | 33.0 | 12.0 | |||
Calaveras | 2.5 | 2.1 | 2.0 | 66.0 | 73.0 | 57.0 | ||||
Del Norte | 5.1 | 4.2 | 3.8 | 78.0 | 70.0 | 167.0 | ||||
El Dorado | 2.3 | 2.0 | 2.1 | 14.0 | 33.0 | 13.0 | ||||
Humboldt | 4.3 | 3.0 | 2.4 | 10.0 | 10.0 | 10.0 | ||||
Lake | 4.9 | 4.2 | 3.0 | r | 41.0 | 39.0 | 35.5 | |||
Mariposa | 6.4 | 4.3 | 2.1 | r | 10.5 | 62.0 | 11.5 | |||
Mendocino | 6.5 | 5.2 | 3.2 | 45.0 | 52.5 | 61.0 | ||||
Mono | 3.7 | 2.5 | 2.9 | 89.5 | 90.0 | 62.5 | ||||
Nevada | 3.2 | 2.3 | 2.5 | r | 20.5 | 30.0 | 35.5 | |||
Sutter | 1.7 | 1.2 | 1.8 | 10.0 | 8.0 | 10.0 | ||||
Tuolumne | 2.9 | 3.4 | 2.4 | 40.0 | 39.5 | 17.5 | ||||
Yolo | 1.6 | 1.8 | 1.7 | r | 9.0 | 10.0 | 7.5 | |||
Yuba | 1.9 | 1.5 | 2.2 | 8.0 | 11.0 | 12.0 | ||||
r = revised |
")
View original content to download multimedia:https://www.prnewswire.com/news-releases/california-home-sales-edge-higher-in-february-amid-geopolitical-tensions-and-inflation-uncertainty-car-reports-301503119.html
SOURCE CALIFORNIA ASSOCIATION OF REALTORS
Government
CDC Warns Thousands Of Children Sent To ER After Taking Common Sleep Aid
CDC Warns Thousands Of Children Sent To ER After Taking Common Sleep Aid
Authored by Jack Phillips via The Epoch Times (emphasis ours),
A…
Share this:


Authored by Jack Phillips via The Epoch Times (emphasis ours),
A U.S. Centers for Disease Control (CDC) paper released Thursday found that thousands of young children have been taken to the emergency room over the past several years after taking the very common sleep-aid supplement melatonin.
The agency said that melatonin, which can come in gummies that are meant for adults, was implicated in about 7 percent of all emergency room visits for young children and infants “for unsupervised medication ingestions,” adding that many incidents were linked to the ingestion of gummy formulations that were flavored. Those incidents occurred between the years 2019 and 2022.
Melatonin is a hormone produced by the human body to regulate its sleep cycle. Supplements, which are sold in a number of different formulas, are generally taken before falling asleep and are popular among people suffering from insomnia, jet lag, chronic pain, or other problems.
The supplement isn’t regulated by the U.S. Food and Drug Administration and does not require child-resistant packaging. However, a number of supplement companies include caps or lids that are difficult for children to open.
The CDC report said that a significant number of melatonin-ingestion cases among young children were due to the children opening bottles that had not been properly closed or were within their reach. Thursday’s report, the agency said, “highlights the importance of educating parents and other caregivers about keeping all medications and supplements (including gummies) out of children’s reach and sight,” including melatonin.
The approximately 11,000 emergency department visits for unsupervised melatonin ingestions by infants and young children during 2019–2022 highlight the importance of educating parents and other caregivers about keeping all medications and supplements (including gummies) out of children’s reach and sight.
The CDC notes that melatonin use among Americans has increased five-fold over the past 25 years or so. That has coincided with a 530 percent increase in poison center calls for melatonin exposures to children between 2012 and 2021, it said, as well as a 420 percent increase in emergency visits for unsupervised melatonin ingestion by young children or infants between 2009 and 2020.
Some health officials advise that children under the age of 3 should avoid taking melatonin unless a doctor says otherwise. Side effects include drowsiness, headaches, agitation, dizziness, and bed wetting.
Other symptoms of too much melatonin include nausea, diarrhea, joint pain, anxiety, and irritability. The supplement can also impact blood pressure.
However, there is no established threshold for a melatonin overdose, officials have said. Most adult melatonin supplements contain a maximum of 10 milligrams of melatonin per serving, and some contain less.
Many people can tolerate even relatively large doses of melatonin without significant harm, officials say. But there is no antidote for an overdose. In cases of a child accidentally ingesting melatonin, doctors often ask a reliable adult to monitor them at home.
Dr. Cora Collette Breuner, with the Seattle Children’s Hospital at the University of Washington, told CNN that parents should speak with a doctor before giving their children the supplement.
“I also tell families, this is not something your child should take forever. Nobody knows what the long-term effects of taking this is on your child’s growth and development,” she told the outlet. “Taking away blue-light-emitting smartphones, tablets, laptops, and television at least two hours before bed will keep melatonin production humming along, as will reading or listening to bedtime stories in a softly lit room, taking a warm bath, or doing light stretches.”
In 2022, researchers found that in 2021, U.S. poison control centers received more than 52,000 calls about children consuming worrisome amounts of the dietary supplement. That’s a six-fold increase from about a decade earlier. Most such calls are about young children who accidentally got into bottles of melatonin, some of which come in the form of gummies for kids, the report said.
Dr. Karima Lelak, an emergency physician at Children’s Hospital of Michigan and the lead author of the study published in 2022 by the CDC, found that in about 83 percent of those calls, the children did not show any symptoms.
However, other children had vomiting, altered breathing, or other symptoms. Over the 10 years studied, more than 4,000 children were hospitalized, five were put on machines to help them breathe, and two children under the age of two died. Most of the hospitalized children were teenagers, and many of those ingestions were thought to be suicide attempts.
Those researchers also suggested that COVID-19 lockdowns and virtual learning forced more children to be at home all day, meaning there were more opportunities for kids to access melatonin. Also, those restrictions may have caused sleep-disrupting stress and anxiety, leading more families to consider melatonin, they suggested.
The Associated Press contributed to this report.
International
Red Candle In The Wind
Red Candle In The Wind
By Benjamin PIcton of Rabobank
February non-farm payrolls superficially exceeded market expectations on Friday by…
Share this:

By Benjamin PIcton of Rabobank
February non-farm payrolls superficially exceeded market expectations on Friday by printing at 275,000 against a consensus call of 200,000. We say superficially, because the downward revisions to prior months totalled 167,000 for December and January, taking the total change in employed persons well below the implied forecast, and helping the unemployment rate to pop two-ticks to 3.9%. The U6 underemployment rate also rose from 7.2% to 7.3%, while average hourly earnings growth fell to 0.2% m-o-m and average weekly hours worked languished at 34.3, equalling pre-pandemic lows.
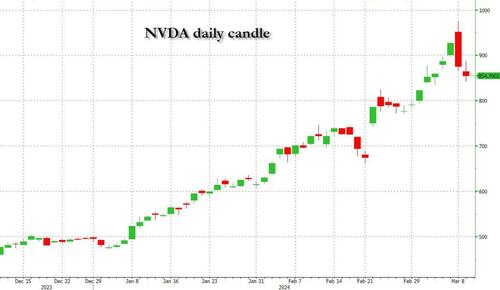
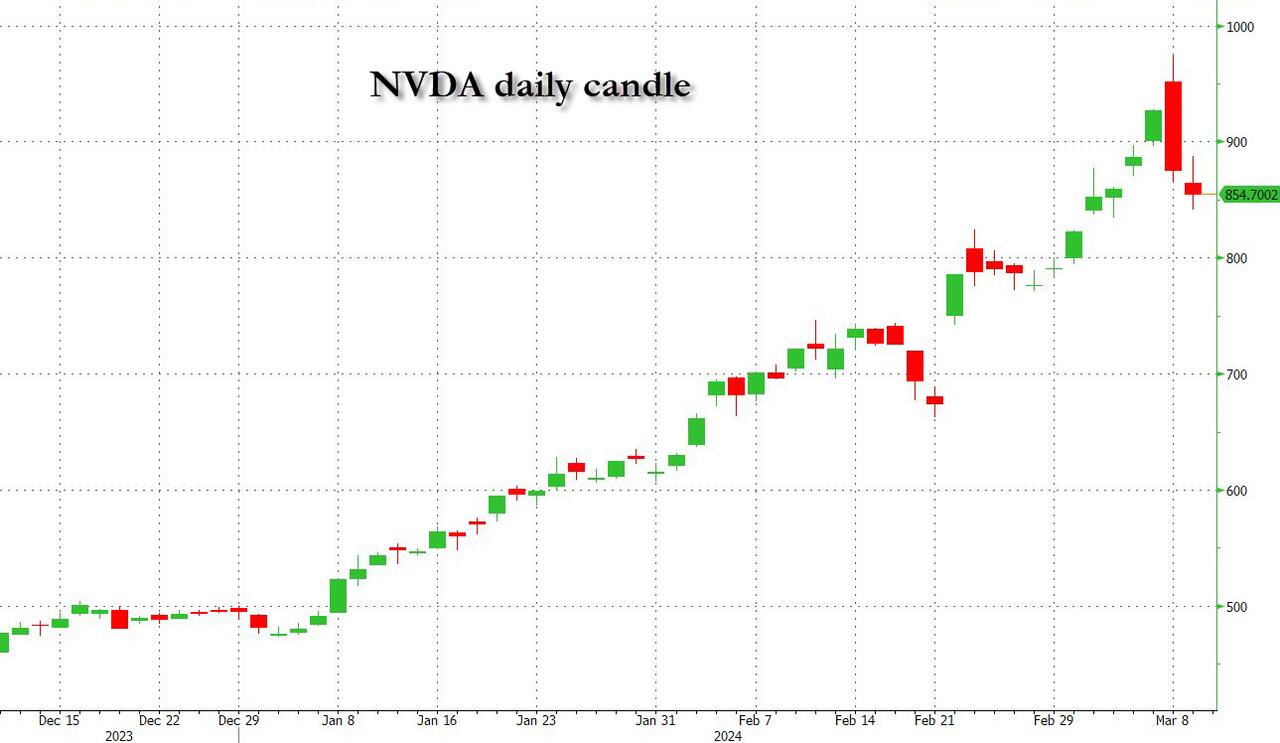
Undeterred by the devil in the detail, the algos sprang into action once exchanges opened. Market darling NVIDIA hit a new intraday high of $974 before (presumably) the humans took over and sold the stock down more than 10% to close at $875.28. If our suspicions are correct that it was the AIs buying before the humans started selling (no doubt triggering trailing stops on the way down), the irony is not lost on us.
The 1-day chart for NVIDIA now makes for interesting viewing, because the red candle posted on Friday presents quite a strong bearish engulfing signal. Volume traded on the day was almost double the 15-day simple moving average, and similar price action is observable on the 1-day charts for both Intel and AMD. Regular readers will be aware that we have expressed incredulity in the past about the durability the AI thematic melt-up, so it will be interesting to see whether Friday’s sell off is just a profit-taking blip, or a genuine trend reversal.
AI equities aside, this week ought to be important for markets because the BTFP program expires today. That means that the Fed will no longer be loaning cash to the banking system in exchange for collateral pledged at-par. The KBW Regional Banking index has so far taken this in its stride and is trading 30% above the lows established during the mini banking crisis of this time last year, but the Fed’s liquidity facility was effectively an exercise in can-kicking that makes regional banks a sector of the market worth paying attention to in the weeks ahead. Even here in Sydney, regulators are warning of external risks posed to the banking sector from scheduled refinancing of commercial real estate loans following sharp falls in valuations.
Markets are sending signals in other sectors, too. Gold closed at a new record-high of $2178/oz on Friday after trading above $2200/oz briefly. Gold has been going ballistic since the Friday before last, posting gains even on days where 2-year Treasury yields have risen. Gold bugs are buying as real yields fall from the October highs and inflation breakevens creep higher. This is particularly interesting as gold ETFs have been recording net outflows; suggesting that price gains aren’t being driven by a retail pile-in. Are gold buyers now betting on a stagflationary outcome where the Fed cuts without inflation being anchored at the 2% target? The price action around the US CPI release tomorrow ought to be illuminating.
Leaving the day-to-day movements to one side, we are also seeing further signs of structural change at the macro level. The UK budget last week included a provision for the creation of a British ISA. That is, an Individual Savings Account that provides tax breaks to savers who invest their money in the stock of British companies. This follows moves last year to encourage pension funds to head up the risk curve by allocating 5% of their capital to unlisted investments.
As a Hail Mary option for a government cruising toward an electoral drubbing it’s a curious choice, but it’s worth highlighting as cash-strapped governments increasingly see private savings pools as a funding solution for their spending priorities.
Of course, the UK is not alone in making creeping moves towards financial repression. In contrast to announcements today of increased trade liberalisation, Australian Treasurer Jim Chalmers has in the recent past flagged his interest in tapping private pension savings to fund state spending priorities, including defence, public housing and renewable energy projects. Both the UK and Australia appear intent on finding ways to open up the lungs of their economies, but government wants more say in directing private capital flows for state goals.
So, how far is the blurring of the lines between free markets and state planning likely to go? Given the immense and varied budgetary (and security) pressures that governments are facing, could we see a re-up of WWII-era Victory bonds, where private investors are encouraged to do their patriotic duty by directly financing government at negative real rates?
That would really light a fire under the gold market.
Spread & Containment
Fauci Deputy Warned Him Against Vaccine Mandates: Email
Fauci Deputy Warned Him Against Vaccine Mandates: Email
Authored by Zachary Stieber via The Epoch Times (emphasis ours),
Mandating COVID-19…
Share this:


Authored by Zachary Stieber via The Epoch Times (emphasis ours),
Mandating COVID-19 vaccination was a mistake due to ethical and other concerns, a top government doctor warned Dr. Anthony Fauci after Dr. Fauci promoted mass vaccination.
“Coercing or forcing people to take a vaccine can have negative consequences from a biological, sociological, psychological, economical, and ethical standpoint and is not worth the cost even if the vaccine is 100% safe,” Dr. Matthew Memoli, director of the Laboratory of Infectious Diseases clinical studies unit at the U.S. National Institute of Allergy and Infectious Diseases (NIAID), told Dr. Fauci in an email.
“A more prudent approach that considers these issues would be to focus our efforts on those at high risk of severe disease and death, such as the elderly and obese, and do not push vaccination on the young and healthy any further.”
Employing that strategy would help prevent loss of public trust and political capital, Dr. Memoli said.
The email was sent on July 30, 2021, after Dr. Fauci, director of the NIAID, claimed that communities would be safer if more people received one of the COVID-19 vaccines and that mass vaccination would lead to the end of the COVID-19 pandemic.
“We’re on a really good track now to really crush this outbreak, and the more people we get vaccinated, the more assuredness that we’re going to have that we’re going to be able to do that,” Dr. Fauci said on CNN the month prior.
Dr. Memoli, who has studied influenza vaccination for years, disagreed, telling Dr. Fauci that research in the field has indicated yearly shots sometimes drive the evolution of influenza.
Vaccinating people who have not been infected with COVID-19, he said, could potentially impact the evolution of the virus that causes COVID-19 in unexpected ways.
“At best what we are doing with mandated mass vaccination does nothing and the variants emerge evading immunity anyway as they would have without the vaccine,” Dr. Memoli wrote. “At worst it drives evolution of the virus in a way that is different from nature and possibly detrimental, prolonging the pandemic or causing more morbidity and mortality than it should.”
The vaccination strategy was flawed because it relied on a single antigen, introducing immunity that only lasted for a certain period of time, Dr. Memoli said. When the immunity weakened, the virus was given an opportunity to evolve.
Some other experts, including virologist Geert Vanden Bossche, have offered similar views. Others in the scientific community, such as U.S. Centers for Disease Control and Prevention scientists, say vaccination prevents virus evolution, though the agency has acknowledged it doesn’t have records supporting its position.
Other Messages
Dr. Memoli sent the email to Dr. Fauci and two other top NIAID officials, Drs. Hugh Auchincloss and Clifford Lane. The message was first reported by the Wall Street Journal, though the publication did not publish the message. The Epoch Times obtained the email and 199 other pages of Dr. Memoli’s emails through a Freedom of Information Act request. There were no indications that Dr. Fauci ever responded to Dr. Memoli.
Later in 2021, the NIAID’s parent agency, the U.S. National Institutes of Health (NIH), and all other federal government agencies began requiring COVID-19 vaccination, under direction from President Joe Biden.
In other messages, Dr. Memoli said the mandates were unethical and that he was hopeful legal cases brought against the mandates would ultimately let people “make their own healthcare decisions.”
“I am certainly doing everything in my power to influence that,” he wrote on Nov. 2, 2021, to an unknown recipient. Dr. Memoli also disclosed that both he and his wife had applied for exemptions from the mandates imposed by the NIH and his wife’s employer. While her request had been granted, his had not as of yet, Dr. Memoli said. It’s not clear if it ever was.
According to Dr. Memoli, officials had not gone over the bioethics of the mandates. He wrote to the NIH’s Department of Bioethics, pointing out that the protection from the vaccines waned over time, that the shots can cause serious health issues such as myocarditis, or heart inflammation, and that vaccinated people were just as likely to spread COVID-19 as unvaccinated people.
He cited multiple studies in his emails, including one that found a resurgence of COVID-19 cases in a California health care system despite a high rate of vaccination and another that showed transmission rates were similar among the vaccinated and unvaccinated.
Dr. Memoli said he was “particularly interested in the bioethics of a mandate when the vaccine doesn’t have the ability to stop spread of the disease, which is the purpose of the mandate.”
The message led to Dr. Memoli speaking during an NIH event in December 2021, several weeks after he went public with his concerns about mandating vaccines.
“Vaccine mandates should be rare and considered only with a strong justification,” Dr. Memoli said in the debate. He suggested that the justification was not there for COVID-19 vaccines, given their fleeting effectiveness.
Julie Ledgerwood, another NIAID official who also spoke at the event, said that the vaccines were highly effective and that the side effects that had been detected were not significant. She did acknowledge that vaccinated people needed boosters after a period of time.
The NIH, and many other government agencies, removed their mandates in 2023 with the end of the COVID-19 public health emergency.
A request for comment from Dr. Fauci was not returned. Dr. Memoli told The Epoch Times in an email he was “happy to answer any questions you have” but that he needed clearance from the NIAID’s media office. That office then refused to give clearance.
Dr. Jay Bhattacharya, a professor of health policy at Stanford University, said that Dr. Memoli showed bravery when he warned Dr. Fauci against mandates.
“Those mandates have done more to demolish public trust in public health than any single action by public health officials in my professional career, including diminishing public trust in all vaccines.” Dr. Bhattacharya, a frequent critic of the U.S. response to COVID-19, told The Epoch Times via email. “It was risky for Dr. Memoli to speak publicly since he works at the NIH, and the culture of the NIH punishes those who cross powerful scientific bureaucrats like Dr. Fauci or his former boss, Dr. Francis Collins.”


Red Candle In The Wind


‘I couldn’t stand the pain’: the Turkish holiday resort that’s become an emergency dental centre for Britons who can’t get treated at home


Beloved mall retailer files Chapter 7 bankruptcy, will liquidate


Is the National Guard a solution to school violence?


CDC Warns Thousands Of Children Sent To ER After Taking Common Sleep Aid


Rand Paul Teases Senate GOP Leader Run – Musk Says “I Would Support”


Trump “Clearly Hasn’t Learned From His COVID-Era Mistakes”, RFK Jr. Says


The next pandemic? It’s already here for Earth’s wildlife


Mathematicians use AI to identify emerging COVID-19 variants


Vaccine-skeptical mothers say bad health care experiences made them distrust the medical system
-

 Uncategorized3 weeks ago
All Of The Elements Are In Place For An Economic Crisis Of Staggering Proportions
-

 Uncategorized3 weeks ago
California Counties Could Be Forced To Pay $300 Million To Cover COVID-Era Program
-

 International4 days ago
EyePoint poaches medical chief from Apellis; Sandoz CFO, longtime BioNTech exec to retire
-

 Uncategorized2 weeks ago
Apparel Retailer Express Moving Toward Bankruptcy
-

 Uncategorized4 weeks ago
Industrial Production Decreased 0.1% in January
-

 International4 days ago
Walmart launches clever answer to Target’s new membership program
-

 Uncategorized3 weeks ago
RFK Jr: The Wuhan Cover-Up & The Rise Of The Biowarfare-Industrial Complex
-

 Uncategorized3 weeks ago
GOP Efforts To Shore Up Election Security In Swing States Face Challenges