Uncategorized
Bitcoin Bollinger Bands hit key zone as BTC price fights for $27K
BTC price is at a decision point within the context of the Bollinger Bands, but only time will tell whether Bitcoin can muster a breakout, their creator…
Share this:


BTC price is at a decision point within the context of the Bollinger Bands, but only time will tell whether Bitcoin can muster a breakout, their creator says.
Bitcoin (BTC) could see fresh upside volatility as BTC price strength revisits key levels, a classic metric suggests.
In an X (formerly Twitter) post on Sep. 18, John Bollinger, creator of the Bollinger Bands volatility indicator, said that Bitcoin was positioned for a breakout decision.
Bitcoin Bollinger Bands eye start of “walk up”
After hitting new September highs the day prior, Bitcoin has been challenging resistance levels out of reach since mid-August, data from Cointelegraph Markets Pro and TradingView shows.
For Bollinger, the signs from the largest cryptocurrency are encouraging. Bollinger Bands uses standard deviation around a simple moving average to determine both likely price ranges and volatility.
Currently, BTC/USD is putting in daily candles that touch the upper band. When this happens, it can signal an imminent reversal back to the center band or, conversely, an inbound fit of upside volatility.
Narrow Bollinger Bands seen on Bitcoin recently lend weight to hopes that the latter scenario will now play out.
“And there is the first tag of the upper Bollinger Band after a new set of controlling bars was established at the lower band,” Bollinger commented alongside a chart.
“The question is now can we do a walk up the upper band? Too early to answer.”

Cointelegraph reported on the narrowing of the bands in July — an event which ultimately preceded a return to lower levels.
BTC price reset "quite reasonable"
Bollinger characterizes the current mood among seasoned Bitcoin traders and analysts on short timeframes.
Related: FOMC versus BTC price ‘local bottom’ — 5 things to know in Bitcoin this week
Despite the strength seen this week, caution abounds as various trendlines, which previously acted as support remain above spot price.
Discussing the situation, on-chain monitoring resource Material Indicators told X subscribers to question bulls’ momentum.
“We have heavy technical resistance overhead at the Key Moving Averages and support at the LL,” part of commentary stated.
“It's quite possible that we round trip the range, and with any luck, we will see legit tests of the R/S levels that will give us some clarity on where BTC goes from here before the end of the week.”
Material Indicators referenced the upcoming United States Federal Reserve decision on interest rates, which could produce snap volatility and untrustworthy short-term trading signals.
UPDATE 2: As noted earlier, it appears #BTC bulls are gaining some momentum, but things are not always as they seem. Let me explain...
— Material Indicators (@MI_Algos) September 18, 2023
Sometime after last nights candle close/open we've seen a new Trend Precognition ⬆️signal develop on the Daily chart and NOW we have a new… pic.twitter.com/V0UI7JznKf
This article does not contain investment advice or recommendations. Every investment and trading move involves risk, and readers should conduct their own research when making a decision.
cryptocurrency bitcoin btcUncategorized
Guest Contribution: “The Federal Funds Rate: FOMC Projections, Policy Rule Prescriptions, and Futures Market Probabilities from the March 2024 Meeting”
Today, we present a guest post written by David Papell and Ruxandra Prodan-Boul, Professor of Economics at the University of Houston and Economics Lecturer…
Share this:


Today, we present a guest post written by David Papell and Ruxandra Prodan-Boul, Professor of Economics at the University of Houston and Economics Lecturer at Stanford University.
The Federal Open Market Committee (FOMC) maintained the target range for the federal funds rate (FFR) at 5.25 – 5.5 percent in its March 2024 meeting and, in the Summary of Economic Projections (SEP), continued to project a range for the FFR between 4.5 and 4.75 percent by the end of 2024. In contrast with experience through December 2023, futures markets summarized by the CME FedWatch Tool on the day following the meeting were in accord with the FOMC projections and also predicted a range for the FFR between 4.5 – 4.75 percent by the end of 2024.
There is widespread agreement that the Fed fell “behind the curve” by not raising rates when inflation rose in 2021, forcing it to play “catch-up” in 2022. “Behind the curve,” however, is meaningless without a measure of “on the curve.” In our paper, “Policy Rules and Forward Guidance Following the Covid-19 Recession,” we use data from the SEP’s from September 2020 to December 2023 to compare policy rule prescriptions with actual and FOMC projections of the FFR. This provides a precise definition of “behind the curve” as the difference between the FFR prescribed by the policy rule and the actual or projected FFR. In this post, we analyze four policy rules that are relevant for the future path of the FFR, update the policy rule prescriptions through the March 2024 SEP, and include futures market predictions.
The Taylor (1993) rule with an unemployment gap is as follows,
where is the level of the short-term federal funds interest rate prescribed by the rule, is the inflation rate, is the 2 percent target level of inflation, is the 4 percent rate of unemployment in the longer run, is the current unemployment rate, and is the ½ percent neutral real interest rate from the current SEP.
Yellen (2012) analyzed the balanced approach rule where the coefficient on the inflation gap is 0.5 but the coefficient on the unemployment gap is raised to 2.0.

The balanced approach rule received considerable attention following the Great Recession and became the standard policy rule used by the Fed.
These rules are non-inertial because the FFR fully adjusts whenever the target FFR changes. This is not in accord with FOMC practice to smooth rate increases when inflation rises. We specify inertial versions of the rules based on Clarida, Gali, and Gertler (1999),

where is the degree of inertia and is the target level of the federal funds rate prescribed by Equations (1) and (2). We set as in Bernanke, Kiley, and Roberts (2019). equals the rate prescribed by the rule if it is positive and zero if the prescribed rate is negative.
Figure 1 depicts the midpoint for the target range of the FFR for September 2020 to March 2024 and the projected FFR for June 2024 to December 2026 from the March 2024 SEP. Figure 1 also depicts policy rule prescriptions. Between September 2020 and March 2024, we use real-time inflation and unemployment data that was available at the time of the FOMC meetings. Between June 2024 and December 2026, we use inflation and unemployment projections from the March 2024 SEP. The differences in the prescribed FFR’s between the inertial and non-inertial rules are much larger than those between the Taylor and balanced approach rules.


Figure 1: The Federal Funds Rate and Policy Rule Prescriptions. Top panel: Non-Inertial Rules; Bottom panel: Inertial Rules.
Policy rule prescriptions are reported in Panel A for the non-inertial Taylor and balanced approach rules. They are much higher than the FFR in 2022 and 2023 and are not in accord with the FOMC’s practice of smoothing rate increases when inflation rises. In contrast, the policy rule prescriptions for 2024 through 2026 from the March 2024 SEP are consistently lower than the FFR projections. The inertial rules in Panel B prescribe a much smoother path of rate increases from September 2021 through September 2023 than that adopted by the FOMC. If the Fed had followed the inertial Taylor or balanced approach rule instead of the FOMC’s forward guidance, it could have avoided the pattern of falling behind the curve, pivot, and getting back on track that characterized Fed policy during 2021 and 2022. Looking forward, the FFR projections from the March 2024 SEP are very close to the policy rule prescriptions through December 2026. The current and projected FFR is in accord with prescriptions from inertial policy rules.
It has been widely reported that market participants have been predicting a steeper downward path for the FFR than the FOMC. This is illustrated in Figure 2, which depicts the median predictions from futures markets described in the CME FedWatch Tool on February 1, 2024, the day following the January 2024 FOMC Meeting, through the end of the CME prediction horizon in December 2024. The futures market predictions fall below the projected FFR from June 2024 through December 2024. This is described in more detail in our February 9, 2024, Econbrowser post.


Figure 2: The FFR, CME FedWatch Tool, and Policy Rule Prescriptions in December 2023. Top panel: Taylor Rules; Bottom panel: Balanced Approach.
Futures markets are no longer predicting a steeper downward path for the FFR than the FFR projections. Figure 3 depicts the median predictions from futures markets described in the CME FedWatch Tool on March 21, 2024, the day following the March 2024 FOMC Meeting, through the end of the CME prediction horizon in September 2025. The markets are completely in accord with the FOMC, as the futures market predictions are identical to the FFR projections. The change from December 2023 to March 2024 is entirely due to the change in the CME predictions, as the FFR projections through December 2024 are unchanged. The markets have caught up to the Fed and not vice versa.
We add to this discussion by including prescriptions from policy rules. Figure 3 shows that, for both the Taylor and balanced approach rules, the prescriptions from the inertial policy rules for March 2024 through December 2025 are close to the (identical) FOMC projections and CME predictions. In contrast, the prescriptions from both non-inertial policy rules are considerably below the FOMC projections and CME predictions for the same period. Comparison between futures market predictions and policy rule prescriptions depends on the choice between inertial and non-inertial rules but not on the choice between Taylor and balanced approach rules.


Figure 3: The FFR, CME FedWatch Tool and Policy Rule Prescriptions in March 2024
Top panel: Taylor Rules; Bottom panel: Balanced Approach.
This post written by David Papell and Ruxandra Prodan-Boul.
recession unemployment covid-19 fomc open market committee fed recession unemploymentUncategorized
Penny-pinching buyers are driving down sales of the Big Three’s most profitable segment
Buyers are flocking to more affordable cars amid high prices and interest rates.
Share this:


Despite the U.S. auto industry celebrating huge sales wins in the first quarter, a key segment containing some of the Detroit Big Three's most profitable nameplates is being left in the dust.
Related: Get ready for $5-a-gallon gasoline
As per a recent report by Automotive News, sales of full-size pickup trucks fell 4% year over year in the period between January and March 2024, with key models reporting reduced sales figures in the double digits.
Stellantis' (STLA) reported that its popular Ram 1500 took a sales hit of 15%, while Ford (F) reported that sales of its bestselling F-series line of pickups took a hit of 10%. On the other hand, General Motors (GM) reported overall sales gains of 2.4% with its Chevrolet Silverado and 2.1% with its GMC Sierra pickups thanks to heavy duty models, but sales of its light duty full-size models are down 1.2%.
Besides GM, Nissan (NSANF) was the only other automaker to sell more pickups this period than the same time in 2023. In total, pickup sales are down 6.4%, including a 31% drop for midsize models like the Ford Ranger and GM's Chevrolet Colorado.

Insiders, analysts and those in the know say that the high prices of cars, as well as high interest rates are causing consumers to cut back on their discretionary spending and explore smaller and cheaper options. As sales of full-size pickups dropped, compact pickups like Ford's hybrid Maverick pickup rose by 82%, while compact and subcompact crossovers rose roughly 25%.
In recent years, automakers like Detroit's Big Three have transformed pickup trucks from utilitarian workhorses into premium machines with MSRPs that rivaled luxury marques like Mercedes-Benz. In a statement to AutoNews, Cox Automotive senior economist Charlie Chesbrough noted that the high prices well equipped pickup's, as well as the slowdown of construction have affected the growth of the segment.
"Pickups have run into two hurdles — interest rates and high prices are having a negative impact directly on affordability and the slowdown in construction is likely impacting demand," Chesbrough told AutoNews. "We don't feel there is much pent-up demand remaining in fleet. Additional growth [in] the full-size pickup segment will be challenging over the near term. Buyers appear to want pickup functionality, but at lower prices."
More Automotive:
- BMW exec says it's the end of the line for a popular option among car enthusiasts
- Mercedes just took a subtle dig at its biggest luxury rival
- Ford is taking away a convenient feature because no one uses it
Additionally, Edmunds head of insights Jessica Caldwell noted that low interest rates during the COVID-19 pandemic allowed for buyers to opt for more expensive vehicles, such as premium trims of pickups like the Ford F-150 Platinum and the Chevrolet Silverado High Country.
She told AutoNews that consumers aren't "stretching their budgets in ways that they would have in the past," and that higher interest rates makes "financing these larger purchases really hard."
According to GlobalData, full-size pickups accounted for 12.4% of new car sales for the first quarter of 2024, compared to 13.7% during the same period in 2023.
Related: Veteran fund manager picks favorite stocks for 2024
stocks pandemic covid-19 interest ratesUncategorized
US Consumer Price Index CPI – USD/JPY Technical Analysis
US Consumer Price Index – CPI The US Consumer Price Index CPI Y/Y overall trend has been steadily declining after reaching its peak of 9.06% in June…
Share this:

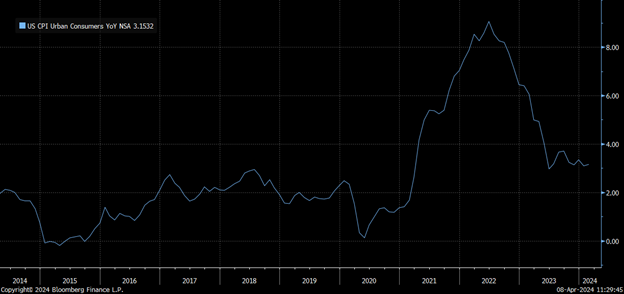
US Consumer Price Index – CPI
The US Consumer Price Index CPI Y/Y overall trend has been steadily declining after reaching its peak of 9.06% in June 2022. A drop in all CPI components, including Energy, Food, and Durable Goods Prices, mainly drove the decline. However, the decline stalled during the last quarter of 2023, and the index has been moving sideways since then as the changes in the Services sector remained almost unchanged throughout the entire time.
Core Services M/M peaked in January 2024 at a one-year high of 0.66%; however, it registered 0.457% for February 2024, a 30% decline. Core Services data M/M may be critical this week as investors will watch whether the declining trend will resume toward the pre-pandemic averages of 0.25%—0.35% or reverse and peak again. The index has been registering higher lows since June 2023. A change in the cost of services can be more meaningful if accompanied by a similar percentage change in other CPI components, such as Durable Goods prices. Oil prices have recently been rising, and it is logical to impact the overall production costs; although the increase in oil prices came slightly after the CPI reporting period, it may still have an impact. On the other hand, a stabilization for CPI data at its current levels can be seen as favorable by market participants as it should add another reason for the FED to consider interest rate cuts sooner rather than later.
Please review the Economic Calendar for all releases and local times.
CME FedWatch Tool

Source: CME Group – CME FedWatch Tool
According to the most recent review of the CME FedWatch tool, market participants anticipate two to three rate cuts between March 20th, 2024, and December 31st, 2024. The percentage of participants expecting rates to remain at their current 525-550 range for the meeting on May 1st, 2024, is 94.4%, down from 99.8%. The expectation for a 25-basis points rate cut for the May 1st meeting rose from 0.2% to 5.6%. As for the June 12th, 2024, Fed’s meeting, the percentage of a 25-basis points rate cut fell from 57.2% last week to 46.1%.
USDJPY Technical Analysis – 1 Hour Chart

- Price action continues to trade within a trading range, which began in mid-March 2024.
- Multiple attempts to break above the range upper borders have failed so far; the upper range border intersects with R1 Standard calculations.
- The MACD line crossed below its signal line, and its histogram turned bearish after an extended coiling period.
- Market reaction for Friday, April 5th, 2024: NFP has faded for other currency pairs, such as EURUSD and USDAD; however, for USDJPY, this has not happened, thus adding more weight to the yellow highlighted candle, the candle low intersects with the daily pivot point forming a level of support to follow
- A slight negative divergence can be seen on RSI14 as price action makes higher highs while RSI makes lower highs.


What’s So Great About The Great Reset, Great Taking, Great Replacement, Great Deflation, & Next Great Depression?


United Airlines passenger incident triggers blunt reaction
United Airlines passenger incident sparks abrupt, strong reaction


US Consumer Price Index CPI – USD/JPY Technical Analysis


Guest Contribution: “The Federal Funds Rate: FOMC Projections, Policy Rule Prescriptions, and Futures Market Probabilities from the March 2024 Meeting”


Penny-pinching buyers are driving down sales of the Big Three’s most profitable segment
United Airlines passenger incident triggers quick response
-

 International3 weeks ago
Parexel CEO to retire; CAR-T maker AffyImmune promotes business leader to chief executive
-

 Spread & Containment4 weeks ago
IFM’s Hat Trick and Reflections On Option-To-Buy M&A
-

 International1 month ago
EyePoint poaches medical chief from Apellis; Sandoz CFO, longtime BioNTech exec to retire
-

 International1 month ago
Walmart launches clever answer to Target’s new membership program
-

 Uncategorized7 days ago
Vaccinated People Show Long COVID-Like Symptoms With Detectable Spike Proteins: Preprint Study
-

 Government2 days ago
Climate-Con & The Media-Censorship Complex – Part 1
-

 Uncategorized3 days ago
Can language models read the genome? This one decoded mRNA to make better vaccines.
-
Uncategorized21 hours ago
What’s So Great About The Great Reset, Great Taking, Great Replacement, Great Deflation, & Next Great Depression?