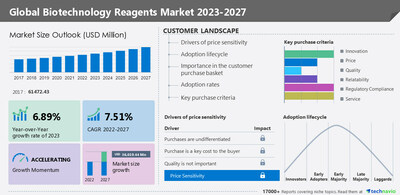
NEW YORK, Jan. 24, 2023 /PRNewswire/ -- The Biotechnology Reagents Market by Technology, Application, and Geography - Forecast and Analysis 2023-2027 report has been published by Technavio. Market size is forecast to grow by USD 36,019.44 million between 2022 and 2027 at a CAGR of 7.51%. The report provides a comprehensive analysis of growth opportunities at regional levels, new product launches, the latest trends, and the post-pandemic recovery of the global market. Download A PDF Sample Report
Regional Analysis
By region, the global biotechnology reagents market is segmented into North America, Europe, Asia, and Rest of World (ROW). North America will account for 48% of market growth during the forecast period. Factors such as ongoing research in biological sciences, investments by various biotechnology companies, and high demand for biotechnology reagents are driving the growth of the biotechnology reagents market in North America. Buy the report
Company Profiles
The biotechnology reagents market report includes information on the key products and recent developments of leading vendors, including:
- Danaher Corp. - The company offers biotechnology reagents that are engineered to deliver reduced spillover to optimize resolution when used with other fluorochromes.
- F. Hoffmann La Roche Ltd. - The company offers biotechnology reagents that include active ingredients for diagnostic assay which include nucleic acid isolation and purification, to enzymes for amplification and nucleotides.
- Lonza Group Ltd. - The company offers biotechnology reagents that are required for the growth of Endothelial Cells.
- Merck KGaA - The company offers biotechnology reagents that are subjected to stringent controls during development and production to ensure reliable and reproducible results.
Market Dynamics
The market is driven by factors such as the high usage of biotechnology reagents in diagnostic and therapeutic applications, increasing research and development investments by federal agencies and biotechnology firms, and the presence of high throughput and novel technologies. However, stringent regulations are hindering market growth.
Competitive Analysis
The competitive scenario categorizes companies based on various performance indicators. Some of the factors considered include the financial performance of companies over the past few years, growth strategies, product innovations, new product launches, investments, and growth in market share among others. Request a Sample
Market Segmentation
- By technology, the market is segmented into chromatography, in-vitro diagnostics, polymerase chain reaction, cell culture, and others. The chromatography segment accounted for the largest share of the market in 2022.
- By geography, the market is segmented into North America, Europe, Asia, and Rest of World (ROW). North America held the largest share of the market in 2022.
Related Reports:
- The genomics market is estimated to grow at a CAGR of 10.53% between 2022 and 2027. The size of the market is forecast to increase by USD 18,244.34 million. The increasing demand for creating and upgrading genome databases is notably driving the market growth, although factors such as the shortage of skilled genetics professionals may impede the market growth.
- The microbiomes market is estimated to grow at a CAGR of 21.95% between 2022 and 2027. The size of the market is forecast to increase by USD 891.94 million. The increasing prevalence of diseases is notably driving the market growth, although factors such as challenges related to manufacturing and formulation may impede the market growth.
Technavio's library includes over 17,000+ reports, covering more than 2,000 emerging technologies. Subscribe to our "Basic Plan" at just USD 5,000 and get lifetime access to Technavio Insights
What are the key data covered in this biotechnology reagents market report?
- CAGR of the market during the forecast period.
- Detailed information on factors that will drive the growth of the market between 2023 and 2027
- Precise estimation of the size of the biotechnology reagents market and its contribution to the parent market.
- Accurate predictions about upcoming trends and changes in consumer behavior.
- Growth of the market across North America, Europe, Asia, and Rest of World (ROW).
- A thorough analysis of the market's competitive landscape and detailed information about vendors.
- Comprehensive analysis of factors that will challenge the growth of biotechnology reagents market vendors.
Biotechnology Reagents Market Scope
Report Coverage
| Details
|
Page number
| 180
|
Base year
| 2022
|
Historic period
| 2017-2021
|
Forecast period
| 2023-2027
|
Growth momentum & CAGR
| Accelerate at a CAGR of 7.51%
|
Market growth 2023-2027
| USD 36,019.44 million
|
Market structure
| Fragmented
|
YoY growth 2022-2023 (%)
| 6.89
|
Regional analysis
| North America, Europe, Asia, and Rest of World (ROW)
|
Performing market contribution
| North America at 48%
|
Key countries
| US, Germany, France, China, and Japan
|
Competitive landscape
| Leading Vendors, Market Positioning of Vendors, Competitive Strategies, and Industry Risks
|
Key companies profiled
| Abbott Laboratories, Agilent Technologies Inc., Becton Dickinson and Co., Bio Rad Laboratories Inc., bioMerieux SA, Danaher Corp., F. Hoffmann La Roche Ltd., Illumina Inc., Lonza Group Ltd., Merck KGaA, Meridian Bioscience Inc., New England Biolabs Inc., PerkinElmer Inc., Promega Corp., QIAGEN NV, Siemens AG, Sysmex Corp., Thermo Fisher Scientific Inc., Waters Corp., and Tosoh Corp.
|
Market dynamics
| Parent market analysis, market growth inducers and obstacles, fast-growing and slow-growing segment analysis, COVID-19 impact and recovery analysis and future consumer dynamics, and market condition analysis for the forecast period.
|
Customization purview
| If our report has not included the data that you are looking for, you can reach out to our analysts and get segments customized.
|
Table of contents:
1 Executive Summary
- 1.1 Market overview
- Exhibit 01: Executive Summary – Chart on Market Overview
- Exhibit 02: Executive Summary – Data Table on Market Overview
- Exhibit 03: Executive Summary – Chart on Global Market Characteristics
- Exhibit 04: Executive Summary – Chart on Market by Geography
- Exhibit 05: Executive Summary – Chart on Market Segmentation by Technology
- Exhibit 06: Executive Summary – Chart on Market Segmentation by Application
- Exhibit 07: Executive Summary – Chart on Incremental Growth
- Exhibit 08: Executive Summary – Data Table on Incremental Growth
- Exhibit 09: Executive Summary – Chart on Vendor Market Positioning
2 Market Landscape
- 2.1 Market ecosystem
- Exhibit 10: Parent market
- Exhibit 11: Market Characteristics
3 Market Sizing
- 3.1 Market definition
- Exhibit 12: Offerings of vendors included in the market definition
- 3.2 Market segment analysis
- Exhibit 13: Market segments
- 3.4 Market outlook: Forecast for 2022-2027
- Exhibit 14: Chart on Global - Market size and forecast 2022-2027 ($ million)
- Exhibit 15: Data Table on Global - Market size and forecast 2022-2027 ($ million)
- Exhibit 16: Chart on Global Market: Year-over-year growth 2022-2027 (%)
- Exhibit 17: Data Table on Global Market: Year-over-year growth 2022-2027 (%)
4 Historic Market Size
- 4.1 Global biotechnology reagents market 2017 - 2021
- Exhibit 18: Historic Market Size – Data Table on Global biotechnology reagents market 2017 - 2021 ($ million)
- 4.2 Technology Segment Analysis 2017 - 2021
- Exhibit 19: Historic Market Size – Technology Segment 2017 - 2021 ($ million)
- 4.3 Application Segment Analysis 2017 - 2021
- Exhibit 20: Historic Market Size – Application Segment 2017 - 2021 ($ million)
- 4.4 Geography Segment Analysis 2017 - 2021
- Exhibit 21: Historic Market Size – Geography Segment 2017 - 2021 ($ million)
- 4.5 Country Segment Analysis 2017 - 2021
- Exhibit 22: Historic Market Size – Country Segment 2017 - 2021 ($ million)
5 Five Forces Analysis
- 5.1 Five forces summary
- Exhibit 23: Five forces analysis - Comparison between 2022 and 2027
- 5.2 Bargaining power of buyers
- Exhibit 24: Chart on Bargaining power of buyers – Impact of key factors 2022 and 2027
- 5.3 Bargaining power of suppliers
- Exhibit 25: Bargaining power of suppliers – Impact of key factors in 2022 and 2027
- 5.4 Threat of new entrants
- Exhibit 26: Threat of new entrants – Impact of key factors in 2022 and 2027
- 5.5 Threat of substitutes
- Exhibit 27: Threat of substitutes – Impact of key factors in 2022 and 2027
- 5.6 Threat of rivalry
- Exhibit 28: Threat of rivalry – Impact of key factors in 2022 and 2027
- 5.7 Market condition
- Exhibit 29: Chart on Market condition - Five forces 2022 and 2027
6 Market Segmentation by Technology
- 6.1 Market segments
- Exhibit 30: Chart on Technology - Market share 2022-2027 (%)
- Exhibit 31: Data Table on Technology - Market share 2022-2027 (%)
- 6.2 Comparison by Technology
- Exhibit 32: Chart on Comparison by Technology
- Exhibit 33: Data Table on Comparison by Technology
- 6.3 Chromatography - Market size and forecast 2022-2027
- Exhibit 34: Chart on Chromatography - Market size and forecast 2022-2027 ($ million)
- Exhibit 35: Data Table on Chromatography - Market size and forecast 2022-2027 ($ million)
- Exhibit 36: Chart on Chromatography - Year-over-year growth 2022-2027 (%)
- Exhibit 37: Data Table on Chromatography - Year-over-year growth 2022-2027 (%)
- 6.4 In-vitro diagnostics - Market size and forecast 2022-2027
- Exhibit 38: Chart on In-vitro diagnostics - Market size and forecast 2022-2027 ($ million)
- Exhibit 39: Data Table on In-vitro diagnostics - Market size and forecast 2022-2027 ($ million)
- Exhibit 40: Chart on In-vitro diagnostics - Year-over-year growth 2022-2027 (%)
- Exhibit 41: Data Table on In-vitro diagnostics - Year-over-year growth 2022-2027 (%)
- 6.5 Polymerase chain reaction - Market size and forecast 2022-2027
- Exhibit 42: Chart on Polymerase chain reaction - Market size and forecast 2022-2027 ($ million)
- Exhibit 43: Data Table on Polymerase chain reaction - Market size and forecast 2022-2027 ($ million)
- Exhibit 44: Chart on Polymerase chain reaction - Year-over-year growth 2022-2027 (%)
- Exhibit 45: Data Table on Polymerase chain reaction - Year-over-year growth 2022-2027 (%)
- 6.6 Cell culture - Market size and forecast 2022-2027
- Exhibit 46: Chart on Cell culture - Market size and forecast 2022-2027 ($ million)
- Exhibit 47: Data Table on Cell culture - Market size and forecast 2022-2027 ($ million)
- Exhibit 48: Chart on Cell culture - Year-over-year growth 2022-2027 (%)
- Exhibit 49: Data Table on Cell culture - Year-over-year growth 2022-2027 (%)
- 6.7 Others - Market size and forecast 2022-2027
- Exhibit 50: Chart on Others - Market size and forecast 2022-2027 ($ million)
- Exhibit 51: Data Table on Others - Market size and forecast 2022-2027 ($ million)
- Exhibit 52: Chart on Others - Year-over-year growth 2022-2027 (%)
- Exhibit 53: Data Table on Others - Year-over-year growth 2022-2027 (%)
- 6.8 Market opportunity by Technology
- Exhibit 54: Market opportunity by Technology ($ million)
7 Market Segmentation by Application
- 7.1 Market segments
- Exhibit 55: Chart on Application - Market share 2022-2027 (%)
- Exhibit 56: Data Table on Application - Market share 2022-2027 (%)
- 7.2 Comparison by Application
- Exhibit 57: Chart on Comparison by Application
- Exhibit 58: Data Table on Comparison by Application
- 7.3 Protein synthesis and purification - Market size and forecast 2022-2027
- Exhibit 59: Chart on Protein synthesis and purification - Market size and forecast 2022-2027 ($ million)
- Exhibit 60: Data Table on Protein synthesis and purification - Market size and forecast 2022-2027 ($ million)
- Exhibit 61: Chart on Protein synthesis and purification - Year-over-year growth 2022-2027 (%)
- Exhibit 62: Data Table on Protein synthesis and purification - Year-over-year growth 2022-2027 (%)
- 7.4 Gene expression - Market size and forecast 2022-2027
- Exhibit 63: Chart on Gene expression - Market size and forecast 2022-2027 ($ million)
- Exhibit 64: Data Table on Gene expression - Market size and forecast 2022-2027 ($ million)
- Exhibit 65: Chart on Gene expression - Year-over-year growth 2022-2027 (%)
- Exhibit 66: Data Table on Gene expression - Year-over-year growth 2022-2027 (%)
- 7.5 DNA and RNA analysis - Market size and forecast 2022-2027
- Exhibit 67: Chart on DNA and RNA analysis - Market size and forecast 2022-2027 ($ million)
- Exhibit 68: Data Table on DNA and RNA analysis - Market size and forecast 2022-2027 ($ million)
- Exhibit 69: Chart on DNA and RNA analysis - Year-over-year growth 2022-2027 (%)
- Exhibit 70: Data Table on DNA and RNA analysis - Year-over-year growth 2022-2027 (%)
- 7.6 Drug testing - Market size and forecast 2022-2027
- Exhibit 71: Chart on Drug testing - Market size and forecast 2022-2027 ($ million)
- Exhibit 72: Data Table on Drug testing - Market size and forecast 2022-2027 ($ million)
- Exhibit 73: Chart on Drug testing - Year-over-year growth 2022-2027 (%)
- Exhibit 74: Data Table on Drug testing - Year-over-year growth 2022-2027 (%)
- 7.7 Market opportunity by Application
- Exhibit 75: Market opportunity by Application ($ million)
8 Customer Landscape
- 8.1 Customer landscape overview
- Exhibit 76: Analysis of price sensitivity, lifecycle, customer purchase basket, adoption rates, and purchase criteria
9 Geographic Landscape
- 9.1 Geographic segmentation
- Exhibit 77: Chart on Market share by geography 2022-2027 (%)
- Exhibit 78: Data Table on Market share by geography 2022-2027 (%)
- 9.2 Geographic comparison
- Exhibit 79: Chart on Geographic comparison
- Exhibit 80: Data Table on Geographic comparison
- 9.3 North America - Market size and forecast 2022-2027
- Exhibit 81: Chart on North America - Market size and forecast 2022-2027 ($ million)
- Exhibit 82: Data Table on North America - Market size and forecast 2022-2027 ($ million)
- Exhibit 83: Chart on North America - Year-over-year growth 2022-2027 (%)
- Exhibit 84: Data Table on North America - Year-over-year growth 2022-2027 (%)
- 9.4 Europe - Market size and forecast 2022-2027
- Exhibit 85: Chart on Europe - Market size and forecast 2022-2027 ($ million)
- Exhibit 86: Data Table on Europe - Market size and forecast 2022-2027 ($ million)
- Exhibit 87: Chart on Europe - Year-over-year growth 2022-2027 (%)
- Exhibit 88: Data Table on Europe - Year-over-year growth 2022-2027 (%)
- 9.5 Asia - Market size and forecast 2022-2027
- Exhibit 89: Chart on Asia - Market size and forecast 2022-2027 ($ million)
- Exhibit 90: Data Table on Asia - Market size and forecast 2022-2027 ($ million)
- Exhibit 91: Chart on Asia - Year-over-year growth 2022-2027 (%)
- Exhibit 92: Data Table on Asia - Year-over-year growth 2022-2027 (%)
- 9.6 Rest of World (ROW) - Market size and forecast 2022-2027
- Exhibit 93: Chart on Rest of World (ROW) - Market size and forecast 2022-2027 ($ million)
- Exhibit 94: Data Table on Rest of World (ROW) - Market size and forecast 2022-2027 ($ million)
- Exhibit 95: Chart on Rest of World (ROW) - Year-over-year growth 2022-2027 (%)
- Exhibit 96: Data Table on Rest of World (ROW) - Year-over-year growth 2022-2027 (%)
- 9.7 US - Market size and forecast 2022-2027
- Exhibit 97: Chart on US - Market size and forecast 2022-2027 ($ million)
- Exhibit 98: Data Table on US - Market size and forecast 2022-2027 ($ million)
- Exhibit 99: Chart on US - Year-over-year growth 2022-2027 (%)
- Exhibit 100: Data Table on US - Year-over-year growth 2022-2027 (%)
- 9.8 China - Market size and forecast 2022-2027
- Exhibit 101: Chart on China - Market size and forecast 2022-2027 ($ million)
- Exhibit 102: Data Table on China - Market size and forecast 2022-2027 ($ million)
- Exhibit 103: Chart on China - Year-over-year growth 2022-2027 (%)
- Exhibit 104: Data Table on China - Year-over-year growth 2022-2027 (%)
- 9.9 Germany - Market size and forecast 2022-2027
- Exhibit 105: Chart on Germany - Market size and forecast 2022-2027 ($ million)
- Exhibit 106: Data Table on Germany - Market size and forecast 2022-2027 ($ million)
- Exhibit 107: Chart on Germany - Year-over-year growth 2022-2027 (%)
- Exhibit 108: Data Table on Germany - Year-over-year growth 2022-2027 (%)
- 9.10 France - Market size and forecast 2022-2027
- Exhibit 109: Chart on France - Market size and forecast 2022-2027 ($ million)
- Exhibit 110: Data Table on France - Market size and forecast 2022-2027 ($ million)
- Exhibit 111: Chart on France - Year-over-year growth 2022-2027 (%)
- Exhibit 112: Data Table on France - Year-over-year growth 2022-2027 (%)
- 9.11 Japan - Market size and forecast 2022-2027
- Exhibit 113: Chart on Japan - Market size and forecast 2022-2027 ($ million)
- Exhibit 114: Data Table on Japan - Market size and forecast 2022-2027 ($ million)
- Exhibit 115: Chart on Japan - Year-over-year growth 2022-2027 (%)
- Exhibit 116: Data Table on Japan - Year-over-year growth 2022-2027 (%)
- 9.12 Market opportunity by geography
- Exhibit 117: Market opportunity by geography ($ million)
10 Drivers, Challenges, and Trends
- 10.3 Impact of drivers and challenges
- Exhibit 118: Impact of drivers and challenges in 2022 and 2027
11 Vendor Landscape
- 11.2 Vendor landscape
- Exhibit 119: Overview on Criticality of inputs and Factors of differentiation
- 11.3 Landscape disruption
- Exhibit 120: Overview on factors of disruption
- 11.4 Industry risks
- Exhibit 121: Impact of key risks on business
12 Vendor Analysis
- 12.1 Vendors covered
- Exhibit 122: Vendors covered
- 12.2 Market positioning of vendors
- Exhibit 123: Matrix on vendor position and classification
- 12.3 Abbott Laboratories
- Exhibit 124: Abbott Laboratories - Overview
- Exhibit 125: Abbott Laboratories - Business segments
- Exhibit 126: Abbott Laboratories - Key news
- Exhibit 127: Abbott Laboratories - Key offerings
- Exhibit 128: Abbott Laboratories - Segment focus
- 12.4 Agilent Technologies Inc.
- Exhibit 129: Agilent Technologies Inc. - Overview
- Exhibit 130: Agilent Technologies Inc. - Business segments
- Exhibit 131: Agilent Technologies Inc. - Key news
- Exhibit 132: Agilent Technologies Inc. - Key offerings
- Exhibit 133: Agilent Technologies Inc. - Segment focus
- 12.5 Becton Dickinson and Co.
- Exhibit 134: Becton Dickinson and Co. - Overview
- Exhibit 135: Becton Dickinson and Co. - Business segments
- Exhibit 136: Becton Dickinson and Co. - Key news
- Exhibit 137: Becton Dickinson and Co. - Key offerings
- Exhibit 138: Becton Dickinson and Co. - Segment focus
- 12.6 Bio Rad Laboratories Inc.
- Exhibit 139: Bio Rad Laboratories Inc. - Overview
- Exhibit 140: Bio Rad Laboratories Inc. - Business segments
- Exhibit 141: Bio Rad Laboratories Inc. - Key news
- Exhibit 142: Bio Rad Laboratories Inc. - Key offerings
- Exhibit 143: Bio Rad Laboratories Inc. - Segment focus
- 12.7 bioMerieux SA
- Exhibit 144: bioMerieux SA - Overview
- Exhibit 145: bioMerieux SA - Product / Service
- Exhibit 146: bioMerieux SA - Key offerings
- 12.8 Danaher Corp.
- Exhibit 147: Danaher Corp. - Overview
- Exhibit 148: Danaher Corp. - Business segments
- Exhibit 149: Danaher Corp. - Key news
- Exhibit 150: Danaher Corp. - Key offerings
- Exhibit 151: Danaher Corp. - Segment focus
- 12.9 F. Hoffmann La Roche Ltd.
- Exhibit 152: F. Hoffmann La Roche Ltd. - Overview
- Exhibit 153: F. Hoffmann La Roche Ltd. - Business segments
- Exhibit 154: F. Hoffmann La Roche Ltd. - Key news
- Exhibit 155: F. Hoffmann La Roche Ltd. - Key offerings
- Exhibit 156: F. Hoffmann La Roche Ltd. - Segment focus
- 12.10 Lonza Group Ltd.
- Exhibit 157: Lonza Group Ltd. - Overview
- Exhibit 158: Lonza Group Ltd. - Business segments
- Exhibit 159: Lonza Group Ltd. - Key news
- Exhibit 160: Lonza Group Ltd. - Key offerings
- Exhibit 161: Lonza Group Ltd. - Segment focus
- 12.11 Merck KGaA
- Exhibit 162: Merck KGaA - Overview
- Exhibit 163: Merck KGaA - Business segments
- Exhibit 164: Merck KGaA - Key news
- Exhibit 165: Merck KGaA - Key offerings
- Exhibit 166: Merck KGaA - Segment focus
- 12.12 Meridian Bioscience Inc.
- Exhibit 167: Meridian Bioscience Inc. - Overview
- Exhibit 168: Meridian Bioscience Inc. - Business segments
- Exhibit 169: Meridian Bioscience Inc. - Key offerings
- Exhibit 170: Meridian Bioscience Inc. - Segment focus
- 12.13 PerkinElmer Inc.
- Exhibit 171: PerkinElmer Inc. - Overview
- Exhibit 172: PerkinElmer Inc. - Business segments
- Exhibit 173: PerkinElmer Inc. - Key news
- Exhibit 174: PerkinElmer Inc. - Key offerings
- Exhibit 175: PerkinElmer Inc. - Segment focus
- 12.14 Promega Corp.
- Exhibit 176: Promega Corp. - Overview
- Exhibit 177: Promega Corp. - Product / Service
- Exhibit 178: Promega Corp. - Key offerings
- 12.15 Siemens AG
- Exhibit 179: Siemens AG - Overview
- Exhibit 180: Siemens AG - Business segments
- Exhibit 181: Siemens AG - Key news
- Exhibit 182: Siemens AG - Key offerings
- Exhibit 183: Siemens AG - Segment focus
- 12.16 Sysmex Corp.
- Exhibit 184: Sysmex Corp. - Overview
- Exhibit 185: Sysmex Corp. - Business segments
- Exhibit 186: Sysmex Corp. - Key offerings
- Exhibit 187: Sysmex Corp. - Segment focus
- 12.17 Thermo Fisher Scientific Inc.
- Exhibit 188: Thermo Fisher Scientific Inc. - Overview
- Exhibit 189: Thermo Fisher Scientific Inc. - Business segments
- Exhibit 190: Thermo Fisher Scientific Inc. - Key news
- Exhibit 191: Thermo Fisher Scientific Inc. - Key offerings
- Exhibit 192: Thermo Fisher Scientific Inc. - Segment focus
13 Appendix
- 13.2 Inclusions and exclusions checklist
- Exhibit 193: Inclusions checklist
- Exhibit 194: Exclusions checklist
- 13.3 Currency conversion rates for US$
- Exhibit 195: Currency conversion rates for US$
- 13.4 Research methodology
- Exhibit 196: Research methodology
- Exhibit 197: Validation techniques employed for market sizing
- Exhibit 198: Information sources
- 13.5 List of abbreviations
- Exhibit 199: List of abbreviations
About Us
Technavio is a leading global technology research and advisory company. Their research and analysis focus on emerging market trends and provides actionable insights to help businesses identify market opportunities and develop effective strategies to optimize their market positions. With over 500 specialized analysts, Technavio's report library consists of more than 17,000 reports and counting, covering 800 technologies, spanning across 50 countries. Their client base consists of enterprises of all sizes, including more than 100 Fortune 500 companies. This growing client base relies on Technavio's comprehensive coverage, extensive research, and actionable market insights to identify opportunities in existing and potential markets and assess their competitive positions within changing market scenarios.
Contact
Technavio Research
Jesse Maida
Media & Marketing Executive
US: +1 844 364 1100
UK: +44 203 893 3200
Email: media@technavio.com
Website: www.technavio.com/
View original content to download multimedia:https://www.prnewswire.com/news-releases/biotechnology-reagents-market-size-to-increase-by-usd-36-019-44-million-north-america-to-account-for-48-of-market-growth---technavio-301727948.html
SOURCE Technavio


