Uncategorized
Biomaterial Testing Equipment Market to grow by USD 60.63 Mn; High growth expected in the orthopedic segment – Technavio
Biomaterial Testing Equipment Market to grow by USD 60.63 Mn; High growth expected in the orthopedic segment – Technavio
PR Newswire
NEW YORK, Nov. 15, 2022
NEW YORK, Nov. 15, 2022 /PRNewswire/ — The “Biomaterial Testing Equipment Market by Applic…
Share this:

Biomaterial Testing Equipment Market to grow by USD 60.63 Mn; High growth expected in the orthopedic segment - Technavio
PR Newswire
NEW YORK, Nov. 15, 2022
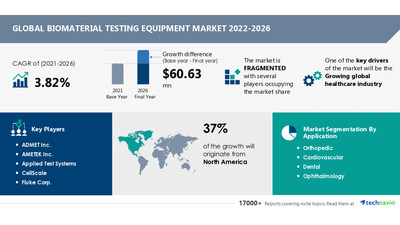
NEW YORK, Nov. 15, 2022 /PRNewswire/ -- The "Biomaterial Testing Equipment Market by Application and Geography - Forecast and Analysis 2022-2026" report has been added to Technavio's offering. The report expects the market size to grow by USD 60.63 million, accelerating at a CAGR of 3.82% during the forecast period. The report provides a detailed analysis of the growth of the market across various segments, regional growth opportunities, product launches, and successful growth strategies adopted by major vendors. Understand the scope of the report by Downloading a Free PDF Report Sample.
Biomaterial Testing Equipment Market 2022-2026: Scope
Technavio presents a detailed picture of the market by the way of study, synthesis, and summation of data from multiple sources. Our biomaterial testing equipment market report covers the following areas:
- Biomaterial Testing Equipment Market Size
- Biomaterial Testing Equipment Market Trends
- Biomaterial Testing Equipment Market Industry Analysis
Technavio's library includes over 17,000+ reports covering more than 2,000 emerging technologies. Subscribe to our "Basic Plan" at just USD 5,000 and get lifetime access to our Technavio Insights
Biomaterial Testing Equipment Market 2022-2026: Segmentation
The global biomaterial testing equipment market is segmented as below:
- Application
- Orthopedic
- Cardiovascular
- Dental
- Ophthalmology
- Others
The market growth in the orthopedic segment will be significant over the forecast period. The growing number of patients suffering from bone disorders, hip, knee, or spine-related issues is expected to spur the demand for orthopedic implants, thereby driving the demand for biomaterials. This, in turn, is expected to propel the growth of the global biomaterial testing equipment market during the forecast period. Also, the rise in the demand for medical devices and procedures for orthopedic applications is expected to propel the growth of the segment.
- Geography
- North America
- Europe
- APAC
- South America
- Middle East and Africa
About 37% of the market growth will come from North America during the forecast period. The biomaterial testing equipment market in North America is expected to grow significantly during the forecast period, primarily due to the growth in the healthcare sector. Population aging is one of the key contributors to the growth of the healthcare sector. A large proportion of the population suffers from cardiovascular diseases or orthopedic problems, thereby spurring the demand for implantable devices. This is expected to drive the demand for biomaterial testing equipment in North America during the forecast period. Understand how the purchase of the report can have a direct impact on your revenue. Download a Free PDF Sample Report
Biomaterial Testing Equipment Market 2022-2026: Vendor Analysis
We provide a detailed analysis of around 25 vendors operating in the biomaterial testing equipment market. Backed with competitive intelligence and benchmarking, our research report on the biomaterial testing equipment market is designed to provide entry support, customer profile, and M&As as well as go-to-market strategy support.
ADMET Inc., AMETEK Inc., Applied Test Systems, CellScale, Fluke Corp., Illinois Tool Works Inc., Intertek Group Plc, Nordson Corp., Presto Group, Rheolution Inc., Rtec Instruments, Shimadzu Corp., TA Instruments, TestResources Inc., World Precision Instruments, and ZwickRoell GmbH and Co. KG are some of the major market participants.
Although the growing global healthcare industry will offer immense growth opportunities, high investments in the R&D of new biomaterial products will challenge the growth of the market participants. To make the most of the opportunities, market vendors should focus more on the growth prospects in the fast-growing segments, while maintaining their positions in the slow-growing segments.
Get detailed insights into the impact of drivers, trends, and challenges on the growth of the global roti maker market. Buy Report Now!
Biomaterial Testing Equipment Market 2022-2026: Key Highlights
- CAGR of the market during the forecast period 2022-2026
- Detailed information on factors that will assist biomaterial testing equipment market growth during the next five years
- Estimation of the biomaterial testing equipment market size and its contribution to the parent market
- Predictions on upcoming trends and changes in consumer behavior
- The growth of the biomaterial testing equipment market
- Analysis of the market's competitive landscape and detailed information on vendors
- Comprehensive details of factors that will challenge the growth of biomaterial testing equipment market vendors
Related Reports:
- The test and measurement equipment market share in APAC is expected to increase to USD 1.79 billion from 2021 to 2026, at a CAGR of 5.3%. The tax incentives by the government of Korea and lower interest rates on loans to boost the country's indigenous technological capabilities will facilitate the test and measurement equipment market growth in South Korea over the forecast period.
- The industrial weighing machine market share is expected to increase to USD 711.9 million from 2021 to 2026, and the market's growth momentum will accelerate at a CAGR of 4.88%. The increasing demand for automated and digital weighing scales is notably driving the industrial weighing machine market growth, although factors such as high market competition leading to price decline may impede the market growth.
Biomaterial Testing Equipment Market Scope | |
Report Coverage | Details |
Page number | 120 |
Base year | 2021 |
Forecast period | 2022-2026 |
Growth momentum & CAGR | Accelerate at a CAGR of 3.82% |
Market growth 2022-2026 | USD 60.63 million |
Market structure | Fragmented |
YoY growth (%) | 3.38 |
Regional analysis | North America, Europe, APAC, South America, and Middle East and Africa |
Performing market contribution | North America at 37% |
Key consumer countries | US, China, Japan, Germany, and UK |
Competitive landscape | Leading companies, competitive strategies, consumer engagement scope |
Companies profiled | ADMET Inc., AMETEK Inc., Applied Test Systems, CellScale, Fluke Corp., Illinois Tool Works Inc., Intertek Group Plc, Nordson Corp., Presto Group, Rheolution Inc., Rtec Instruments, Shimadzu Corp., TA Instruments, TestResources Inc., World Precision Instruments, and ZwickRoell GmbH and Co. KG |
Market Dynamics | Parent market analysis, Market growth inducers and obstacles, Fast-growing and slow-growing segment analysis, COVID-19 impact and future consumer dynamics, and market condition analysis for the forecast period. |
Customization purview | If our report has not included the data that you are looking for, you can reach out to our analysts and get segments customized. |
Table Of Contents:
1 Executive Summary
- 1.1 Market overview
- Exhibit 01: Executive Summary – Chart on Market Overview
- Exhibit 02: Executive Summary – Data Table on Market Overview
- Exhibit 03: Executive Summary – Chart on Global Market Characteristics
- Exhibit 04: Executive Summary – Chart on Market by Geography
- Exhibit 05: Executive Summary – Chart on Market Segmentation by Application
- Exhibit 06: Executive Summary – Chart on Incremental Growth
- Exhibit 07: Executive Summary – Data Table on Incremental Growth
- Exhibit 08: Executive Summary – Chart on Vendor Market Positioning
2 Market Landscape
- 2.1 Market ecosystem
- Exhibit 09: Parent market
- Exhibit 10: Market Characteristics
3 Market Sizing
- 3.1 Market definition
- Exhibit 11: Offerings of vendors included in the market definition
- 3.2 Market segment analysis
- Exhibit 12: Market segments
- 3.3 Market size 2021
- 3.4 Market outlook: Forecast for 2021-2026
- Exhibit 13: Chart on Global - Market size and forecast 2021-2026 ($ million)
- Exhibit 14: Data Table on Global - Market size and forecast 2021-2026 ($ million)
- Exhibit 15: Chart on Global Market: Year-over-year growth 2021-2026 (%)
- Exhibit 16: Data Table on Global Market: Year-over-year growth 2021-2026 (%)
4 Five Forces Analysis
- 4.1 Five forces summary
- Exhibit 17: Five forces analysis - Comparison between 2021 and 2026
- 4.2 Bargaining power of buyers
- Exhibit 18: Chart on Bargaining power of buyers – Impact of key factors 2021 and 2026
- 4.3 Bargaining power of suppliers
- Exhibit 19: Bargaining power of suppliers – Impact of key factors in 2021 and 2026
- 4.4 Threat of new entrants
- Exhibit 20: Threat of new entrants – Impact of key factors in 2021 and 2026
- 4.5 Threat of substitutes
- Exhibit 21: Threat of substitutes – Impact of key factors in 2021 and 2026
- 4.6 Threat of rivalry
- Exhibit 22: Threat of rivalry – Impact of key factors in 2021 and 2026
- 4.7 Market condition
- Exhibit 23: Chart on Market condition - Five forces 2021 and 2026
5 Market Segmentation by Application
- 5.1 Market segments
- Exhibit 24: Chart on Application - Market share 2021-2026 (%)
- Exhibit 25: Data Table on Application - Market share 2021-2026 (%)
- 5.2 Comparison by Application
- Exhibit 26: Chart on Comparison by Application
- Exhibit 27: Data Table on Comparison by Application
- 5.3 Orthopedic - Market size and forecast 2021-2026
- Exhibit 28: Chart on Orthopedic - Market size and forecast 2021-2026 ($ million)
- Exhibit 29: Data Table on Orthopedic - Market size and forecast 2021-2026 ($ million)
- Exhibit 30: Chart on Orthopedic - Year-over-year growth 2021-2026 (%)
- Exhibit 31: Data Table on Orthopedic - Year-over-year growth 2021-2026 (%)
- 5.4 Cardiovascular - Market size and forecast 2021-2026
- Exhibit 32: Chart on Cardiovascular - Market size and forecast 2021-2026 ($ million)
- Exhibit 33: Data Table on Cardiovascular - Market size and forecast 2021-2026 ($ million)
- Exhibit 34: Chart on Cardiovascular - Year-over-year growth 2021-2026 (%)
- Exhibit 35: Data Table on Cardiovascular - Year-over-year growth 2021-2026 (%)
- 5.5 Dental - Market size and forecast 2021-2026
- Exhibit 36: Chart on Dental - Market size and forecast 2021-2026 ($ million)
- Exhibit 37: Data Table on Dental - Market size and forecast 2021-2026 ($ million)
- Exhibit 38: Chart on Dental - Year-over-year growth 2021-2026 (%)
- Exhibit 39: Data Table on Dental - Year-over-year growth 2021-2026 (%)
- 5.6 Ophthalmology - Market size and forecast 2021-2026
- Exhibit 40: Chart on Ophthalmology - Market size and forecast 2021-2026 ($ million)
- Exhibit 41: Data Table on Ophthalmology - Market size and forecast 2021-2026 ($ million)
- Exhibit 42: Chart on Ophthalmology - Year-over-year growth 2021-2026 (%)
- Exhibit 43: Data Table on Ophthalmology - Year-over-year growth 2021-2026 (%)
- 5.7 Others - Market size and forecast 2021-2026
- Exhibit 44: Chart on Others - Market size and forecast 2021-2026 ($ million)
- Exhibit 45: Data Table on Others - Market size and forecast 2021-2026 ($ million)
- Exhibit 46: Chart on Others - Year-over-year growth 2021-2026 (%)
- Exhibit 47: Data Table on Others - Year-over-year growth 2021-2026 (%)
- 5.8 Market opportunity by Application
- Exhibit 48: Market opportunity by Application ($ million)
6 Customer Landscape
- 6.1 Customer landscape overview
- Exhibit 49: Analysis of price sensitivity, lifecycle, customer purchase basket, adoption rates, and purchase criteria
7 Geographic Landscape
- 7.1 Geographic segmentation
- Exhibit 50: Chart on Market share by geography 2021-2026 (%)
- Exhibit 51: Data Table on Market share by geography 2021-2026 (%)
- 7.2 Geographic comparison
- Exhibit 52: Chart on Geographic comparison
- Exhibit 53: Data Table on Geographic comparison
- 7.3 North America - Market size and forecast 2021-2026
- Exhibit 54: Chart on North America - Market size and forecast 2021-2026 ($ million)
- Exhibit 55: Data Table on North America - Market size and forecast 2021-2026 ($ million)
- Exhibit 56: Chart on North America - Year-over-year growth 2021-2026 (%)
- Exhibit 57: Data Table on North America - Year-over-year growth 2021-2026 (%)
- 7.4 Europe - Market size and forecast 2021-2026
- Exhibit 58: Chart on Europe - Market size and forecast 2021-2026 ($ million)
- Exhibit 59: Data Table on Europe - Market size and forecast 2021-2026 ($ million)
- Exhibit 60: Chart on Europe - Year-over-year growth 2021-2026 (%)
- Exhibit 61: Data Table on Europe - Year-over-year growth 2021-2026 (%)
- 7.5 APAC - Market size and forecast 2021-2026
- Exhibit 62: Chart on APAC - Market size and forecast 2021-2026 ($ million)
- Exhibit 63: Data Table on APAC - Market size and forecast 2021-2026 ($ million)
- Exhibit 64: Chart on APAC - Year-over-year growth 2021-2026 (%)
- Exhibit 65: Data Table on APAC - Year-over-year growth 2021-2026 (%)
- 7.6 South America - Market size and forecast 2021-2026
- Exhibit 66: Chart on South America - Market size and forecast 2021-2026 ($ million)
- Exhibit 67: Data Table on South America - Market size and forecast 2021-2026 ($ million)
- Exhibit 68: Chart on South America - Year-over-year growth 2021-2026 (%)
- Exhibit 69: Data Table on South America - Year-over-year growth 2021-2026 (%)
- 7.7 Middle East and Africa - Market size and forecast 2021-2026
- Exhibit 70: Chart on Middle East and Africa - Market size and forecast 2021-2026 ($ million)
- Exhibit 71: Data Table on Middle East and Africa - Market size and forecast 2021-2026 ($ million)
- Exhibit 72: Chart on Middle East and Africa - Year-over-year growth 2021-2026 (%)
- Exhibit 73: Data Table on Middle East and Africa - Year-over-year growth 2021-2026 (%)
- 7.8 US - Market size and forecast 2021-2026
- Exhibit 74: Chart on US - Market size and forecast 2021-2026 ($ million)
- Exhibit 75: Data Table on US - Market size and forecast 2021-2026 ($ million)
- Exhibit 76: Chart on US - Year-over-year growth 2021-2026 (%)
- Exhibit 77: Data Table on US - Year-over-year growth 2021-2026 (%)
- 7.9 Germany - Market size and forecast 2021-2026
- Exhibit 78: Chart on Germany - Market size and forecast 2021-2026 ($ million)
- Exhibit 79: Data Table on Germany - Market size and forecast 2021-2026 ($ million)
- Exhibit 80: Chart on Germany - Year-over-year growth 2021-2026 (%)
- Exhibit 81: Data Table on Germany - Year-over-year growth 2021-2026 (%)
- 7.10 UK - Market size and forecast 2021-2026
- Exhibit 82: Chart on UK - Market size and forecast 2021-2026 ($ million)
- Exhibit 83: Data Table on UK - Market size and forecast 2021-2026 ($ million)
- Exhibit 84: Chart on UK - Year-over-year growth 2021-2026 (%)
- Exhibit 85: Data Table on UK - Year-over-year growth 2021-2026 (%)
- 7.11 China - Market size and forecast 2021-2026
- Exhibit 86: Chart on China - Market size and forecast 2021-2026 ($ million)
- Exhibit 87: Data Table on China - Market size and forecast 2021-2026 ($ million)
- Exhibit 88: Chart on China - Year-over-year growth 2021-2026 (%)
- Exhibit 89: Data Table on China - Year-over-year growth 2021-2026 (%)
- 7.12 Japan - Market size and forecast 2021-2026
- Exhibit 90: Chart on Japan - Market size and forecast 2021-2026 ($ million)
- Exhibit 91: Data Table on Japan - Market size and forecast 2021-2026 ($ million)
- Exhibit 92: Chart on Japan - Year-over-year growth 2021-2026 (%)
- Exhibit 93: Data Table on Japan - Year-over-year growth 2021-2026 (%)
- 7.13 Market opportunity by geography
- Exhibit 94: Market opportunity by geography ($ million)
8 Drivers, Challenges, and Trends
- 8.1 Market drivers
- 8.2 Market challenges
- 8.3 Impact of drivers and challenges
- Exhibit 95: Impact of drivers and challenges in 2021 and 2026
- 8.4 Market trends
9 Vendor Landscape
- 9.1 Overview
- 9.2 Vendor landscape
- Exhibit 96: Overview on Criticality of inputs and Factors of differentiation
- 9.3 Landscape disruption
- Exhibit 97: Overview on factors of disruption
- 9.4 Industry risks
- Exhibit 98: Impact of key risks on business
10 Vendor Analysis
- 10.1 Vendors covered
- Exhibit 99: Vendors covered
- 10.2 Market positioning of vendors
- Exhibit 100: Matrix on vendor position and classification
- 10.3 ADMET Inc.
- Exhibit 101: ADMET Inc. - Overview
- Exhibit 102: ADMET Inc. - Product / Service
- Exhibit 103: ADMET Inc. - Key offerings
- 10.4 AMETEK Inc.
- Exhibit 104: AMETEK Inc. - Overview
- Exhibit 105: AMETEK Inc. - Business segments
- Exhibit 106: AMETEK Inc. - Key offerings
- Exhibit 107: AMETEK Inc. - Segment focus
- 10.5 CellScale
- Exhibit 108: CellScale - Overview
- Exhibit 109: CellScale - Product / Service
- Exhibit 110: CellScale - Key offerings
- 10.6 Fluke Corp.
- Exhibit 111: Fluke Corp. - Overview
- Exhibit 112: Fluke Corp. - Product / Service
- Exhibit 113: Fluke Corp. - Key offerings
- 10.7 Illinois Tool Works Inc.
- Exhibit 114: Illinois Tool Works Inc. - Overview
- Exhibit 115: Illinois Tool Works Inc. - Business segments
- Exhibit 116: Illinois Tool Works Inc. - Key offerings
- Exhibit 117: Illinois Tool Works Inc. - Segment focus
- 10.8 Intertek Group Plc
- Exhibit 118: Intertek Group Plc - Overview
- Exhibit 119: Intertek Group Plc - Business segments
- Exhibit 120: Intertek Group Plc - Key news
- Exhibit 121: Intertek Group Plc - Key offerings
- Exhibit 122: Intertek Group Plc - Segment focus
- 10.9 Nordson Corp.
- Exhibit 123: Nordson Corp. - Overview
- Exhibit 124: Nordson Corp. - Business segments
- Exhibit 125: Nordson Corp. - Key news
- Exhibit 126: Nordson Corp. - Key offerings
- Exhibit 127: Nordson Corp. - Segment focus
- 10.10 Presto Group
- Exhibit 128: Presto Group - Overview
- Exhibit 129: Presto Group - Product / Service
- Exhibit 130: Presto Group - Key offerings
- 10.11 Shimadzu Corp.
- Exhibit 131: Shimadzu Corp. - Overview
- Exhibit 132: Shimadzu Corp. - Business segments
- Exhibit 133: Shimadzu Corp. - Key news
- Exhibit 134: Shimadzu Corp. - Key offerings
- Exhibit 135: Shimadzu Corp. - Segment focus
- 10.12 ZwickRoell GmbH and Co. KG
- Exhibit 136: ZwickRoell GmbH and Co. KG - Overview
- Exhibit 137: ZwickRoell GmbH and Co. KG - Product / Service
- Exhibit 138: ZwickRoell GmbH and Co. KG - Key offerings
11 Appendix
- 11.1 Scope of the report
- 11.2 Inclusions and exclusions checklist
- Exhibit 139: Inclusions checklist
- Exhibit 140: Exclusions checklist
- 11.3 Currency conversion rates for US$
- Exhibit 141: Currency conversion rates for US$
- 11.4 Research methodology
- Exhibit 142: Research methodology
- Exhibit 143: Validation techniques employed for market sizing
- Exhibit 144: Information sources
- 11.5 List of abbreviations
- Exhibit 145: List of abbreviations
- in manufacturing industry: Market dynamics in some major process and discrete industries are changing drastically, and manufacturers are gradually feeling the brunt of excessive demand fluctuations. The fluctuating prices of oil and gas and metals in the global market and the shortage of a skilled workforce worldwide have directly affected the profitability of manufacturing companies. A sudden and unexpected shift in market dynamics can drastically impact manufacturing processes and investments in capital goods.
Technavio is a leading global technology research and advisory company. Their research and analysis focus on emerging market trends and provides actionable insights to help businesses identify market opportunities and develop effective strategies to optimize their market positions. With over 500 specialized analysts, Technavio's report library consists of more than 17,000 reports and counting, covering 800 technologies, spanning across 50 countries. Their client base consists of enterprises of all sizes, including more than 100 Fortune 500 companies. This growing client base relies on Technavio's comprehensive coverage, extensive research, and actionable market insights to identify opportunities in existing and potential markets and assess their competitive positions within changing market scenarios.
Technavio Research
Jesse Maida
Media & Marketing Executive
US: +1 844 364 1100
UK: +44 203 893 3200
Email: media@technavio.com
Website: www.technavio.com/
")
View original content to download multimedia:https://www.prnewswire.com/news-releases/biomaterial-testing-equipment-market-to-grow-by-usd-60-63-mn-high-growth-expected-in-the-orthopedic-segment---technavio-301676883.html
SOURCE Technavio
Uncategorized
Shipping company files surprise Chapter 7 bankruptcy, liquidation
While demand for trucking has increased, so have costs and competition, which have forced a number of players to close.
Share this:


The U.S. economy is built on trucks.
As a nation we have relatively limited train assets, and while in recent years planes have played an expanded role in moving goods, trucks still represent the backbone of how everything — food, gasoline, commodities, and pretty much anything else — moves around the country.
Related: Fast-food chain closes more stores after Chapter 11 bankruptcy
"Trucks moved 61.1% of the tonnage and 64.9% of the value of these shipments. The average shipment by truck was 63 miles compared to an average of 640 miles by rail," according to the U.S. Bureau of Transportation Statistics 2023 numbers.
But running a trucking company has been tricky because the largest players have economies of scale that smaller operators don't. That puts any trucking company that's not a massive player very sensitive to increases in gas prices or drops in freight rates.
And that in turn has led a number of trucking companies, including Yellow Freight, the third-largest less-than-truckload operator; J.J. & Sons Logistics, Meadow Lark, and Boateng Logistics, to close while freight brokerage Convoy shut down in October.
Aside from Convoy, none of these brands are household names. but with the demand for trucking increasing, every company that goes out of business puts more pressure on those that remain, which contributes to increased prices.
Image source: Shutterstock
Another freight company closes and plans to liquidate
Not every bankruptcy filing explains why a company has gone out of business. In the trucking industry, multiple recent Chapter 7 bankruptcies have been tied to lawsuits that pushed otherwise successful companies into insolvency.
In the case of TBL Logistics, a Virginia-based national freight company, its Feb. 29 bankruptcy filing in U.S. Bankruptcy Court for the Western District of Virginia appears to be death by too much debt.
"In its filing, TBL Logistics listed its assets and liabilities as between $1 million and $10 million. The company stated that it has up to 49 creditors and maintains that no funds will be available for unsecured creditors once it pays administrative fees," Freightwaves reported.
The company's owners, Christopher and Melinda Bradner, did not respond to the website's request for comment.
Before it closed, TBL Logistics specialized in refrigerated and oversized loads. The company described its business on its website.
"TBL Logistics is a non-asset-based third-party logistics freight broker company providing reliable and efficient transportation solutions, management, and storage for businesses of all sizes. With our extensive network of carriers and industry expertise, we streamline the shipping process, ensuring your goods reach their destination safely and on time."
The world has a truck-driver shortage
The covid pandemic forced companies to consider their supply chain in ways they never had to before. Increased demand showed the weakness in the trucking industry and drew attention to how difficult life for truck drivers can be.
That was an issue HBO's John Oliver highlighted on his "Last Week Tonight" show in October 2022. In the episode, the host suggested that the U.S. would basically start to starve if the trucking industry shut down for three days.
"Sorry, three days, every produce department in America would go from a fully stocked market to an all-you-can-eat raccoon buffet," he said. "So it’s no wonder trucking’s a huge industry, with more than 3.5 million people in America working as drivers, from port truckers who bring goods off ships to railyards and warehouses, to long-haul truckers who move them across the country, to 'last-mile' drivers, who take care of local delivery."
The show highlighted how many truck drivers face low pay, difficult working conditions and, in many cases, crushing debt.
"Hundreds of thousands of people become truck drivers every year. But hundreds of thousands also quit. Job turnover for truckers averages over 100%, and at some companies it’s as high as 300%, meaning they’re hiring three people for a single job over the course of a year. And when a field this important has a level of job satisfaction that low, it sure seems like there’s a huge problem," Oliver shared.
The truck-driver shortage is not just a U.S. problem; it's a global issue, according to IRU.org.
"IRU’s 2023 driver shortage report has found that over three million truck driver jobs are unfilled, or 7% of total positions, in 36 countries studied," the global transportation trade association reported.
"With the huge gap between young and old drivers growing, it will get much worse over the next five years without significant action."
Related: Veteran fund manager picks favorite stocks for 2024
bankruptcy bankruptcies pandemic stocks commoditiesUncategorized
Wendy’s has a new deal for daylight savings time haters
The Daylight Savings Time promotion slashes prices on breakfast.
Share this:


Daylight Savings Time, or the practice of advancing clocks an hour in the spring to maximize natural daylight, is a controversial practice because of the way it leaves many feeling off-sync and tired on the second Sunday in March when the change is made and one has one less hour to sleep in.
Despite annual "Abolish Daylight Savings Time" think pieces and online arguments that crop up with unwavering regularity, Daylight Savings in North America begins on March 10 this year.
Related: Coca-Cola has a new soda for Diet Coke fans
Tapping into some people's very vocal dislike of Daylight Savings Time, fast-food chain Wendy's (WEN) is launching a daylight savings promotion that is jokingly designed to make losing an hour of sleep less painful and encourage fans to order breakfast anyway.
Image source: Wendy's.
Promotion wants you to compensate for lost sleep with cheaper breakfast
As it is also meant to drive traffic to the Wendy's app, the promotion allows anyone who makes a purchase of $3 or more through the platform to get a free hot coffee, cold coffee or Frosty Cream Cold Brew.
More Food + Dining:
- Taco Bell menu tries new take on an American classic
- McDonald's menu goes big, brings back fan favorites (with a catch)
- The 10 best food stocks to buy now
Available during the Wendy's breakfast hours of 6 a.m. and 10:30 a.m. (which, naturally, will feel even earlier due to Daylight Savings), the deal also allows customers to buy any of its breakfast sandwiches for $3. Items like the Sausage, Egg and Cheese Biscuit, Breakfast Baconator and Maple Bacon Chicken Croissant normally range in price between $4.50 and $7.
The choice of the latter is quite wide since, in the years following the pandemic, Wendy's has made a concerted effort to expand its breakfast menu with a range of new sandwiches with egg in them and sweet items such as the French Toast Sticks. The goal was both to stand out from competitors with a wider breakfast menu and increase traffic to its stores during early-morning hours.
Wendy's deal comes after controversy over 'dynamic pricing'
But last month, the chain known for the square shape of its burger patties ignited controversy after saying that it wanted to introduce "dynamic pricing" in which the cost of many of the items on its menu will vary depending on the time of day. In an earnings call, chief executive Kirk Tanner said that electronic billboards would allow restaurants to display various deals and promotions during slower times in the early morning and late at night.
Outcry was swift and Wendy's ended up walking back its plans with words that they were "misconstrued" as an intent to surge prices during its most popular periods.
While the company issued a statement saying that any changes were meant as "discounts and value offers" during quiet periods rather than raised prices during busy ones, the reputational damage was already done since many saw the clarification as another way to obfuscate its pricing model.
"We said these menuboards would give us more flexibility to change the display of featured items," Wendy's said in its statement. "This was misconstrued in some media reports as an intent to raise prices when demand is highest at our restaurants."
The Daylight Savings Time promotion, in turn, is also a way to demonstrate the kinds of deals Wendy's wants to promote in its stores without putting up full-sized advertising or posters for what is only relevant for a few days.
Related: Veteran fund manager picks favorite stocks for 2024
stocks pandemicUncategorized
Comments on February Employment Report
The headline jobs number in the February employment report was above expectations; however, December and January payrolls were revised down by 167,000 combined. The participation rate was unchanged, the employment population ratio decreased, and the …
Share this:


Prime (25 to 54 Years Old) Participation
Since the overall participation rate is impacted by both cyclical (recession) and demographic (aging population, younger people staying in school) reasons, here is the employment-population ratio for the key working age group: 25 to 54 years old.
The 25 to 54 years old participation rate increased in February to 83.5% from 83.3% in January, and the 25 to 54 employment population ratio increased to 80.7% from 80.6% the previous month.
Average Hourly Wages
 The graph shows the nominal year-over-year change in "Average Hourly Earnings" for all private employees from the Current Employment Statistics (CES).
 Wage growth has trended down after peaking at 5.9% YoY in March 2022 and was at 4.3% YoY in February.
Part Time for Economic Reasons
 From the BLS report:
"The number of people employed part time for economic reasons, at 4.4 million, changed little in February. These individuals, who would have preferred full-time employment, were working part time because their hours had been reduced or they were unable to find full-time jobs."The number of persons working part time for economic reasons decreased in February to 4.36 million from 4.42 million in February. This is slightly above pre-pandemic levels.
These workers are included in the alternate measure of labor underutilization (U-6) that increased to 7.3% from 7.2% in the previous month. This is down from the record high in April 2020 of 23.0% and up from the lowest level on record (seasonally adjusted) in December 2022 (6.5%). (This series started in 1994). This measure is above the 7.0% level in February 2020 (pre-pandemic).
Unemployed over 26 Weeks
 This graph shows the number of workers unemployed for 27 weeks or more.
 According to the BLS, there are 1.203 million workers who have been unemployed for more than 26 weeks and still want a job, down from 1.277 million the previous month.
This is close to pre-pandemic levels.
Job Streak
| Headline Jobs, Top 10 Streaks | ||
|---|---|---|
| Year Ended | Streak, Months | |
| 1 | 2019 | 100 |
| 2 | 1990 | 48 |
| 3 | 2007 | 46 |
| 4 | 1979 | 45 |
| 5 | 20241 | 38 |
| 6 tie | 1943 | 33 |
| 6 tie | 1986 | 33 |
| 6 tie | 2000 | 33 |
| 9 | 1967 | 29 |
| 10 | 1995 | 25 |
| 1Currrent Streak | ||
Summary:
The headline monthly jobs number was above consensus expectations; however, December and January payrolls were revised down by 167,000 combined. The participation rate was unchanged, the employment population ratio decreased, and the unemployment rate was increased to 3.9%. Another solid report.


Wendy’s has a new deal for daylight savings time haters


Watch Live: President Biden Reminds Americans Just How Good They’ve Got It Thanks To Him


Watch: President Biden Delivers The “Darkest, Most Un-American Speech Given By A President”


People Who Received Ivermectin Were Better Off, Study Finds


Interest rates, the best it gets. It’s time to deploy cash


Is the biotech market rally real? Data suggest comeback in private, public markets


COVID-19 May Lead To Persistent Cognitive Impairment, Brain Fog, And Lower IQ Scores


Europe Is Alarmed Enough To Begin Wargaming A Food Crisis


Wealth Inequality by Age in the Post‑Pandemic Era


Normalise the underlying conditions when “rating” a company’s share price
-

 Uncategorized2 weeks ago
All Of The Elements Are In Place For An Economic Crisis Of Staggering Proportions
-

 Uncategorized1 month ago
Cathie Wood sells a major tech stock (again)
-

 Uncategorized3 weeks ago
California Counties Could Be Forced To Pay $300 Million To Cover COVID-Era Program
-

 Uncategorized2 weeks ago
Apparel Retailer Express Moving Toward Bankruptcy
-

 Uncategorized3 weeks ago
Industrial Production Decreased 0.1% in January
-

 International3 hours ago
Walmart launches clever answer to Target’s new membership program
-

 International1 month ago
War Delirium
-

 Uncategorized3 weeks ago
RFK Jr: The Wuhan Cover-Up & The Rise Of The Biowarfare-Industrial Complex