Beyond GDP: changing how we measure progress is key to tackling a world in crisis – three leading experts
Amid the global threats posed by climate change, spiralling energy costs, insecure employment and widening inequality, the need to rethink our notion of…
Share this:

It’s an odd quirk of history that, on the first day of his ill-fated presidential campaign in March 1968, Robert F Kennedy chose to talk to his audience about the limitations of gross domestic product* (GDP) – the world’s headline indicator of economic progress.
It seems stranger still that, despite the power of that iconic speech, growth in GDP remains to this day the predominant measure of progress across the world. Economic success is measured by it. Government policy is assessed by it. Political survival hangs on it.
Kennedy’s speech inspired a host of critiques. It has been quoted by presidents, prime ministers and Nobel laureates. Yet GDP itself has survived until now, more-or-less unscathed. But amid ever-louder concerns about the failure of national economies to tackle the multiple threats posed by climate change, spiralling energy costs, insecure employment and widening levels of inequality, the need to define and measure progress in a different way now looks as unarguable as it is urgent.
The goods, the bads, and the missing
In simple terms, GDP is a measure of the size of a country’s economy: how much is produced, how much is earned, and how much is spent on goods and services across the nation. The monetary total, whether in dollars or euros, yuan or yen, is then adjusted for any general increase in prices to give a measure of “real” economic growth over time. When governments adopt policies to pursue economic growth, this is how those policies are evaluated.
Since 1953, GDP has been the headline measure in a complex system of national accounts overseen by the United Nations. Developed during the second world war, these accounts were motivated in part by the need to determine how much governments could afford to spend on the war effort.
This story is part of Conversation Insights
The Insights team generates long-form journalism and is working with academics from different backgrounds who have been engaged in projects to tackle societal and scientific challenges.
But in measuring the monetary value of economic activity, GDP can incorporate many of the “bads” that detract from our quality of life. War, pollution, crime, prostitution, traffic congestion, disasters like wildfires and the destruction of nature – all can have a positive impact on GDP. Yet they cannot really be construed as components of economic success.
At the same time, there are numerous aspects of our lives that simply go missing from this conventional account. The inequality in our societies. The contributions from unpaid work. The labour of those who care for the young and the elderly at home or in the community. The depletion of natural resources or biodiversity. And the value of data and many digital services.
What lies outside the market, including public services funded out of taxation, remains unmeasured in a metric of monetary exchange. Kennedy was blunt: “[GDP] measures everything, in short, except that which makes life worthwhile.”
It’s a sentiment that has resonance half a century later. In a striking encounter during the Brexit debate, a UK academic was trying to convey to a public meeting the dangers of leaving the EU. The impact on GDP would dwarf any savings from the UK’s contributions to the EU budget, he told the audience. “That’s your bloody GDP!” shouted a woman in the crowd. “It’s not ours.”
This sense of an indicator out of touch with reality may be one of the reasons there is momentum for reform. When GDP conceals crucial differences between the richest and the poorest in society, it inevitably says little about the prospects for ordinary people.
But there are other reasons too for an emerging change of heart. The pursuit of GDP growth as a policy goal, and the impact that has on government, business and personal decision-making, has accompanied increasing devastation of the natural world, a loss of forests and habitats, the destabilisation of the climate, and near-meltdowns of the world’s financial markets. At the same time, GDP has become a poor measure of the technological transformation of society.
Its tenacity as a measure of progress, despite these well-known limitations, arises from factors which are on the one hand technocratic, and on the other sociological. As the headline measure in a sophisticated system of national accounts, GDP has a technocratic convenience and analytical elegance that remains unsurpassed by many alternative measures. Its authority arises from its ability to be simultaneously a measure of production output, consumption expenditure and income in the economy.
Read more: GDP numbers are not what they seem: how they boost US and UK at expense of developing countries
Despite this complex framework, it also offers the deceptive simplicity of a single headline figure which appears to be directly comparable from year to year and across nations, based on the simple (if inadequate) idea that more economic activity necessarily leads to a better life.
However, the combined technical authority and political usefulness of this idea has led to “path dependence” and forms of social lock-in that are difficult to address without significant effort. Think of switching to an alternative as being like switching from driving on the left to the right-hand side of the road.
Yet what we measure matters. And while we’re busy looking in the wrong direction, as Kennedy pointed out, bad things can happen. Kennedy’s campaign – and his critique of GDP – was cut cruelly short on June 5 1968, when he was fatally wounded by an assassin’s bullet. More than half a century later, his call for reform of how we assess progress (or its absence) has never been stronger.
The trouble with GDP: historical flaws
The way societies have understood and measured progress has changed considerably over the centuries. Measurement of “the economy” as a whole is a relatively modern, 20th-century concept, beginning with efforts by statisticians and economists such as Colin Clark and Simon Kuznets in the 1920s and 1930s to understand the impact of financial crisis and depression.
Kuznets, now best known for his curve describing the relationship between GDP and income inequality, was particularly concerned to develop a measure of economic welfare rather than just activity. For example, he argued for omitting expenditures that were unwelcome necessities rather than services or goods consumers actively wanted – such as defence spending.
However, the second world war overtook and absorbed these earlier notions of a single measure of economic welfare, resulting in what first became modern gross national product (GNP), and then GDP. The imperative – set out on the Allied side by John Maynard Keynes in his 1940 pamphlet How to Pay for the War – was measuring productive capacity, and the reduction in consumption required to have enough resources to support the military effort. Economic welfare was a peacetime concern.
Post-war, unsurprisingly, American and British economists such as Milton Gilbert, James Meade and Richard Stone took the lead in codifying these statistical definitions through the UN – and its process for agreeing and formalising definitions in the system of national accounts (SNA) is still in place today. However, since at least the 1940s, some important inadequacies of both the SNA and GDP have been widely known and debated.
Indeed, as long ago as 1934, Margaret Reid published her book Economics of Household Production, which pointed out the need to include unpaid work in the home when thinking about economically useful activity.
The question of whether and how to measure the household and informal sectors was debated during the 1950s – particularly as this makes up a larger share of activity in low-income countries – but was omitted until some countries, including the UK, started to create household satellite accounts around 2000. Omitting unpaid work meant, for instance, that the UK’s increased productivity growth between the 1960s and 1980s was then overstated, because it in part reflected the inclusion of many more women in paid work whose contributions had previously been invisible to the national GDP metric.
Another longstanding and widely understood failure of GDP is not including environmental externalities and the depletion of natural capital. The metric takes incomplete account of many activities that do not have market prices, and ignores the additional social costs of pollution, greenhouse gas emissions and similar outputs associated with economic activities.
Read more: An obsession with economic growth will not make the best use of natural assets
What’s more, the depletion or loss of assets such as natural resources (or indeed buildings and infrastructure lost in disasters) boosts GDP in the short term because these resources are used in economic activities, or because there is a surge in construction after a disaster. Yet the long-term opportunity costs are never counted. This massive shortcoming was widely discussed at the time of landmark publications such as the 1972 Limits to Growth report from the Club of Rome, and the 1987 Brundtland Report from the World Commission on Environment and Development.
As with household and informal activity, there has been recent progress in accounting for nature, with the development of the System of Environmental Economic Accounting (SEEA) and publication of regular (but separate) statistics on natural capital in a number of countries. The UK has again been a pioneer in this area, while the US recently announced it would start following this approach too.
New challenges to the value of GDP
Other, perhaps less obvious failings of GDP have become more prominent recently. Digitisation of the economy has transformed the way many people spend their days in work and leisure, and the way many businesses operate, yet these transformations are not apparent in official statistics.
Measuring innovation has always been tricky, because new goods or improved quality need to be incorporated into observable prices and quantities – and what is the metric for a unit of software or management consultancy? But it is harder now because many digital services are “free” at point of use, or have the features of public goods in that many people can use them at the same time, or are intangible. For example, data is without doubt improving the productivity of companies that know how to use it to improve their services and produce goods more effectively – but how should a dataset’s value, or potential value, to society (as opposed to a big tech company) be estimated?
Recent work looking at the price of telecommunications services in the UK has estimated that output growth in this sector since 2010 has ranged anywhere from about 0% to 90%, depending on how the price index used to convert market prices to real (inflation-adjusted) prices takes account of the economic value of our rapidly growing use of data. Similarly, it is not obvious how to incorporate advertising-funded “free” search, crypto currencies and NFTs in the measurement framework.

A key limitation of GDP, particularly in terms of its use as an indicator of social progress, is that it offers no systematic account of the distribution of incomes. It is entirely possible for average or aggregate GDP to be rising, even as a significant proportion of the population find themselves worse off.
Ordinary incomes have stagnated or fallen in recent decades even as the richest in society have become wealthier. In the US, for example, Thomas Piketty and his colleagues have shown that in the period between 1980 and 2016, the top 0.001% of society saw their incomes grow by an average of 6% per year. Income for the poorest 5% of society fell in real terms.
Given these many issues, it might seem surprising that the debate about “Beyond GDP” is only now – possibly – turning into actions to change the official statistical framework. But paradoxically, one hurdle has been the proliferation of alternative progress metrics.
Read more: How poorer citizens pay the price of economic change in the UK
Whether these are single indices that combine a number of different indicators or dashboards showcasing a wide range of metrics, they have been ad hoc and too varied to build consensus around a new global way of measuring progress. Few of them provide an economic framework for consideration of trade-offs between the separate indicators, or guidance as to how to interpret indicators moving in different directions. There is a breadth of information but as a call to action, this cannot compete against the clarity of a single GDP statistic.
Statistical measurement is like a technical standard such as voltage in electricity networks or the Highway Code’s rules of the road: a shared standard or definition is essential. While an overwhelming majority might agree on the need to go beyond GDP, there also needs to be enough agreement about what “beyond” actually involves before meaningful progress on how we measure progress can be made.
Change behaviour, not just what we measure
There are many visions to supplant GDP growth as the dominant definition of progress and better lives. In the wake of the COVID pandemic, it has been reported that most people want a fairer, more sustainable future.
Politicians can make it sound straightforward. Writing in 2009, the then-French president Nicolas Sarkozy explained he had convened a commission – led by internationally acclaimed economists Amartya Sen, Joseph Stiglitz and Jean-Paul Fitoussi – on the measurement of economic performance and social progress on the basis of a firm belief: that we will not change our behaviour “unless we change the ways we measure our economic performance”.
Sarkozy also committed to encouraging other countries and international organisations to follow the example of France in implementing his commission’s recommendations for a suite of measures beyond GDP. The ambition was no less than the construction of a new global economic, social and environmental order.
In 2010, the recently-elected UK prime minister, David Cameron, launched a programme to implement the Sarkozy commission’s recommendations in the UK. He described this as starting to measure progress as a country “not just by how our economy is growing, but by how our lives are improving – not just by our standard of living, but by our quality of life”.
Once again, the emphasis was on measurement (how far have we got?) rather than behaviour change (what should people do differently?). The implication is that changing what we measure necessarily leads to different behaviours – but the relationship is not that simple. Measures and measurers exist in political and social spheres, not as absolute facts and neutral agents to be accepted by all.
This should not dissuade statisticians from developing new measures, but it should prompt them to engage with all who might be affected – not just those in public policy, commerce or industry. The point after all is to change behaviour, not just to change the measures.
Economists are increasingly adopting complex systems thinking, including both social and psychological understandings of human behaviour. For example, Jonathan Michie has pointed to ethical and cultural values, as well as public policy and the market economy, as the big influences on behaviour. Katharina Lima di Miranda and Dennis Snower have highlighted social solidarity, individual agency and concern for the environment alongside the “traditional” economic incentives captured by GDP.
GDP alternatives in practice
Since Kennedy’s 1968 critique, there have been numerous initiatives to replace, augment or complement GDP over the years. Many dozens of indicators have been devised and implemented at local, national and international scales.
Some aim to account more directly for subjective wellbeing, for example by measuring self-reported life satisfaction or “happiness”. Some hope to reflect more accurately the state of our natural or social assets by developing adjusted monetary and non-monetary measures of “inclusive wealth” (including a team at the University of Cambridge led by this article’s co-author Diane Coyle). The UK government has accepted this as a meaningful approach to measurement in several recent policy documents, including its Levelling Up white paper.
There are two fundamental arguments for a wealth-based approach:
It embeds consideration for sustainability in the valuing of all assets: their value today depends on the entire future flow of services they make available. This is exactly why stockmarket prices can fall or rise suddenly, when expectations about the future change. Similarly, the prices at which assets such as natural resources or the climate are valued are not just market prices; the true “accounting prices” include social costs and externalities.
It also introduces several dimensions of progress, and flags up the correlations between them. Inclusive wealth includes produced, natural and human capital, and also intangible and social or organisational capital. Using a comprehensive wealth balance sheet to inform decisions could contribute to making better use of resources – for example, by considering the close links between sustaining natural assets and the social and human capital context of people living in areas where those assets are under threat.
Other initiatives aim to capture the multi-dimensional nature of social progress by compiling a dashboard of indicators – often measured in non-monetary terms – each of which attempts to track some aspect of what matters to society.
New Zealand’s Living Standards Framework is the best-known example of this dashboard approach. Dating back to a 1988 Royal Commission on Social Policy and developed over more than a decade within the New Zealand Treasury, this framework was precipitated by the need to do something about the discrepancy between what GDP can reflect and the ultimate aim of the Treasury: to make life better for people in New Zealand.
The NZ Treasury now uses it to allocate fiscal budgets in a manner consistent with the identified needs of the country in relation to social and environmental progress. The relevance to combating climate change is particularly clear: if government spending and investment are focused on narrow measures of economic output, there is every possibility that the deep decarbonisation needed to achieve a just transition to a net zero carbon economy will be impossible. Equally, by identifying areas of society with declining wellbeing, such as children’s mental health, it becomes possible to allocate Treasury resources directly to alleviate the problem.
The UK’s Measuring National Wellbeing (MNW) programme, directed by Paul Allin (a co-author of this article), was launched in November 2010 as part of a government-led drive to place greater emphasis on wellbeing in national life and business. Much of the emphasis was on the subjective personal wellbeing measures that the UK’s Office for National Statistics (ONS) continues to collect and publish, and which appear to be increasingly taken up as policy goals (driven in part by the What Works Centre for Wellbeing).
The MNW team was also charged with addressing the full “beyond GDP” agenda, and undertook a large consultation and engagement exercise to find out what matters to people in the UK. This provided the basis for a set of indicators covering ten broad areas which are updated by the ONS from time to time. While these indicators continue to be published, there is no evidence that they are being used to supplement GDP as the UK’s measure of progress.
Accounting for inequality within a single aggregate index is obviously tricky. But several solutions to this problem exist. One of them, advocated by the Sen-Stiglitz-Fitoussi commission, is to report median rather than mean (or average) values when calculating GDP per head.
Another fascinating possibility is to adjust the aggregate measure using a welfare-based index of inequality, such as the one devised by the late Tony Atkinson. An exercise using the Atkinson index carried out by Tim Jackson, also a co-author of this article, calculated that the welfare loss associated with inequality in the UK in 2016 amounted to almost £240 billion – around twice the annual budget of the NHS at that time.
Read more: The search for an alternative to GDP to measure a nation's progress – the New Zealand experience
Among the most ambitious attempts to create a single alternative to GDP is a measure which has become known as the Genuine Progress Indicator (GPI). Proposed initially by economist Herman Daly and theologian John Cobb, GPI attempts to adjust GDP for a range of factors – environmental, social and financial – which are not sufficiently well reflected in GDP itself.
GPI has been used as a progress indicator in the US state of Maryland since 2015. Indeed, a bill introduced to US Congress in July 2021 would, if enacted, require the Department of Commerce to publish a US GPI, and to “use both the indicator and GDP for budgetary reporting and economic forecasting”. GPI is also used in Atlantic Canada, where the process of building and publishing the index forms part of this community’s approach to its development.
A potential gamechanger?
In 2021, the UN secretary-general António Guterres concluded his Our Common Agenda report with a call for action. “We must urgently find measures of progress that complement GDP, as we were tasked to do by 2030 in target 17.19 of the Sustainable Development Goals.” He repeated this demand in his priorities for 2022 speech to the UN General Assembly.
Guterres called for a process “to bring together member states, international financial institutions and statistical, science and policy experts to identify a complement or complements to GDP that will measure inclusive and sustainable growth and prosperity, building on the work of the Statistical Commission”.
The first manual explaining the UN’s system of national accounts was published in 1953. It has since been through five revisions (the last in 2008) designed to catch up with developments in the economy and financial markets, as well as to meet user needs across the world for a wider spread of information.
The next SNA revision is currently in development, led by the UN Statistics Division and mainly involving national statistical offices, other statistical experts and institutional stakeholders such as the IMF, World Bank and Eurostat.
But unlike the UN’s COP processes relating to climate change and, to a lesser extent, biodiversity, there has, to date, been little wider engagement with interested parties – from business leaders and political parties to civil society, non-governmental organisations and the general public.
As the British science writer Ehsan Masood has observed, this revision process is happening below the radar of most people who are not currently users of national accounts. And this means many very useful ideas that could be being fed in are going unheard by those who will ultimately make decisions about how nations measure their progress in the future.
Read more: Why UK's 'treasured free-market economy' will not achieve net zero
The essence of sustainable development was captured in the 1987 Brundtland Report: “To contribute to the welfare and wellbeing of the current generation, without compromising the potential of future generations for a better quality of life.” Yet it remains unclear how the next SNA revision will provide such an intergenerational lens, despite a new focus on “missing” capitals including natural capital.
Similarly, while the revision programme is addressing globalisation issues, these are only about global production and trade – not, for example, the impacts of national economies on the environment and wellbeing of other countries and populations.
Ambitious deadlines have been set further into the future: achieving the UN’s Sustainable Development Goals by 2030, and reducing global net emissions of greenhouse gases to zero before 2050. The SNA revision process – which will see a new system of national accounts agreed in 2023 and enacted from 2025 – is a key step in achieving these longer-term goals. That is why opening up this revision process to wider debate and scrutiny is so important.
It’s time to abandon this ‘GDP fetish’
One lesson to learn from the history of indicators, such as those about poverty and social exclusion, is that their impact and effectiveness depends not only on their technical robustness and their fitness for purpose, but also on the political and social context – what are the needs of the time, and the prevailing climate of ideas?
The current SNA revision should be a process as much about the use and usefulness of new measures as about their methodological rigour. Indeed, we might go as far as Gus O’Donnell, the former UK cabinet secretary, who said in 2020: “Of course measurement is hard. But roughly measuring the right concepts is a better way to make policy choices than using more precise measures of the wrong concepts.”
In short, there is an inherent tension involved in constructing an alternative to GDP – namely achieving a balance between technical robustness and social resonance. The complexity of a dashboard of indicators such as New Zealand’s Living Standards Framework is both an advantage in terms of meaningfulness, and a disadvantage in terms of communicability. In contrast, the simplicity of a single measure of progress such as the Genuine Progress Indicator – or, indeed, GDP – is both an advantage in terms of communication, and a disadvantage in terms of its inability to provide a more nuanced picture of progress.
Ultimately, a plurality of indicators is probably essential in navigating a pathway towards a sustainable prosperity that takes full account of individual and societal wellbeing. Having a wider range of measures should allow for more diverse narratives of progress.
Some momentum in the current SNA revisions process and ongoing statistical research is directed toward measurement of inclusive wealth – building on the economics of sustainability brought together in Partha Dasgupta’s recent review of the economics of biodiversity. This framework can probably gain a broad consensus among economists and statisticians, and is already being implemented by the UN, starting with natural capital and environmental accounting.
Read more: Nature: how do you put a price on something that has infinite worth?
Including wellbeing measures in the mix would signal that wellbeing matters, at least to some of us, while also recognising that many different things can affect wellbeing. The evidence to date is that planting wellbeing measures in a different part of the data ecosystem means they will be overlooked or ignored. Wellbeing measures are not a panacea, but without them we will continue to do things that restrict rather than enhance wellbeing and fail to recognise the potential economic, social and environmental benefits that a wellbeing focus should bring.
The task of updating the statistical framework to measure economic progress better is non-trivial. The development of the SNA and its spread to many countries took years or even decades. New data collection methodologies should be able to speed things up now – but the first step in getting political buy-in to a better framework for the measurement of progress is an agreement about what to move to.
National accounting needs what the name suggests: an internally-consistent, exhaustive and mutually exclusive set of definitions and classifications. A new framework will require collecting different source data, and therefore changing the processes embedded in national statistical offices. It will need to incorporate recent changes in the economy due to digitalisation, as well as the long-standing issues such as inadequate measurement of environmental change.

Ultimately, this “beyond GDP” process needs to grapple not only with measurement problems but also with the various uses and abuses to which GDP has been put. Kennedy’s neat summary that it measures “everything except that which makes life worthwhile” points as much to the misuse of GDP as to its statistical limitations. Its elegance in being simultaneously a measure of income, spending and output means that in some form, it is likely to remain a valid tool for macroeconomic analysis. But its use as an unequivocal arbiter of social progress was never appropriate, and probably never will be.
Clearly, the desire to know if society is moving in the right direction remains a legitimate and important goal – perhaps more so now than ever. But in their search for a reliable guide towards social wellbeing, governments, businesses, statisticians, climate scientists and all other interested parties must abandon once and for all what the Nobel Laureate Stiglitz called a “GDP fetish”, and work with civil society, the media and the public to establish a more effective framework for measuring progress.
*Strictly speaking, Robert Kennedy referred to gross national product (GNP) in his 1968 speech. You can read more about the UN’s Towards the 2025 SNA process here.

For you: more from our Insights series:
To hear about new Insights articles, join the hundreds of thousands of people who value The Conversation’s evidence-based news. Subscribe to our newsletter.
Paul Allin is a member of the UK National Statistician's Expert User Advisory Committee and he is the Royal Statistical Society's Honorary Officer for National Statistics. Views expressed in this article are personal do not necessarily represent those of the NSEUAC or the RSS..
Diane Coyle receives funding from the Economic Statistics Centre of Excellence and ESRC via the Productivity Institute. She is a member of the UK National Statistician's Expert User Advisory Committee and of the Royal Statistical Society. These are personal views.
Tim Jackson is Director of the Centre for the Understanding of Sustainable Prosperity which receives funding from the Economic and Social Research Council and Laudes Foundation. CUSP provides the secretariat for the All-Party Parliamentary Group on Limits to Growth. The views expressed here are personal.
crypto pandemic currencies yuan cryptoGovernment
Mistakes Were Made
Mistakes Were Made
Authored by C.J.Hopkins via The Consent Factory,
Make fun of the Germans all you want, and I’ve certainly done that…
Share this:


Authored by C.J.Hopkins via The Consent Factory,
Make fun of the Germans all you want, and I’ve certainly done that a bit during these past few years, but, if there’s one thing they’re exceptionally good at, it’s taking responsibility for their mistakes. Seriously, when it comes to acknowledging one’s mistakes, and not rationalizing, or minimizing, or attempting to deny them, and any discomfort they may have allegedly caused, no one does it quite like the Germans.
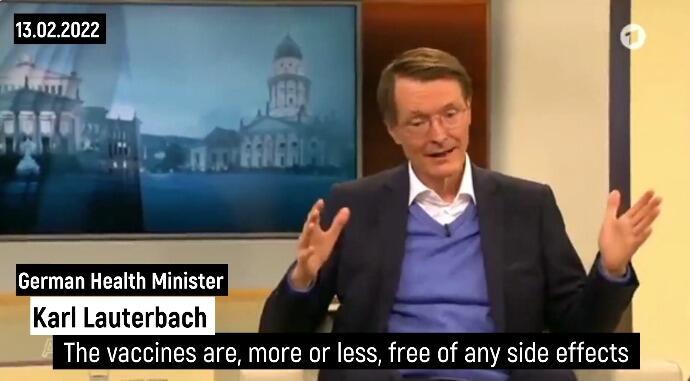
Take this Covid mess, for example. Just last week, the German authorities confessed that they made a few minor mistakes during their management of the “Covid pandemic.” According to Karl Lauterbach, the Minister of Health, “we were sometimes too strict with the children and probably started easing the restrictions a little too late.” Horst Seehofer, the former Interior Minister, admitted that he would no longer agree to some of the Covid restrictions today, for example, nationwide nighttime curfews. “One must be very careful with calls for compulsory vaccination,” he added. Helge Braun, Head of the Chancellery and Minister for Special Affairs under Merkel, agreed that there had been “misjudgments,” for example, “overestimating the effectiveness of the vaccines.”
This display of the German authorities’ unwavering commitment to transparency and honesty, and the principle of personal honor that guides the German authorities in all their affairs, and that is deeply ingrained in the German character, was published in a piece called “The Divisive Virus” in Der Spiegel, and immediately widely disseminated by the rest of the German state and corporate media in a totally organic manner which did not in any way resemble one enormous Goebbelsian keyboard instrument pumping out official propaganda in perfect synchronization, or anything creepy and fascistic like that.
Germany, after all, is “an extremely democratic state,” with freedom of speech and the press and all that, not some kind of totalitarian country where the masses are inundated with official propaganda and critics of the government are dragged into criminal court and prosecuted on trumped-up “hate crime” charges.
OK, sure, in a non-democratic totalitarian system, such public “admissions of mistakes” — and the synchronized dissemination thereof by the media — would just be a part of the process of whitewashing the authorities’ fascistic behavior during some particularly totalitarian phase of transforming society into whatever totalitarian dystopia they were trying to transform it into (for example, a three-year-long “state of emergency,” which they declared to keep the masses terrorized and cooperative while they stripped them of their democratic rights, i.e., the ones they hadn’t already stripped them of, and conditioned them to mindlessly follow orders, and robotically repeat nonsensical official slogans, and vent their impotent hatred and fear at the new “Untermenschen” or “counter-revolutionaries”), but that is obviously not the case here.
No, this is definitely not the German authorities staging a public “accountability” spectacle in order to memory-hole what happened during 2020-2023 and enshrine the official narrative in history. There’s going to be a formal “Inquiry Commission” — conducted by the same German authorities that managed the “crisis” — which will get to the bottom of all the regrettable but completely understandable “mistakes” that were made in the heat of the heroic battle against The Divisive Virus!
OK, calm down, all you “conspiracy theorists,” “Covid deniers,” and “anti-vaxxers.” This isn’t going to be like the Nuremberg Trials. No one is going to get taken out and hanged. It’s about identifying and acknowledging mistakes, and learning from them, so that the authorities can manage everything better during the next “pandemic,” or “climate emergency,” or “terrorist attack,” or “insurrection,” or whatever.
For example, the Inquiry Commission will want to look into how the government accidentally declared a Nationwide State of Pandemic Emergency and revised the Infection Protection Act, suspending the German constitution and granting the government the power to rule by decree, on account of a respiratory virus that clearly posed no threat to society at large, and then unleashed police goon squads on the thousands of people who gathered outside the Reichstag to protest the revocation of their constitutional rights.
Thousands gathered outside the Reichstag building in Berlin to protest the "New Normal" totalitarianism this morning, so the police declared the demonstration illegal and turned the water cannons on them ... are you satisfied yet, totalitarians? pic.twitter.com/j70CHsEWWM
— Consent Factory (@consent_factory) November 18, 2020
Once they do, I’m sure they’ll find that that “mistake” bears absolutely no resemblance to the Enabling Act of 1933, which suspended the German constitution and granted the government the power to rule by decree, after the Nazis declared a nationwide “state of emergency.”
Another thing the Commission will probably want to look into is how the German authorities accidentally banned any further demonstrations against their arbitrary decrees, and ordered the police to brutalize anyone participating in such “illegal demonstrations.”
Memories fade, and history is rewritten, so here's a 2.5 minute montage of goon squads in Germany (which, of course, bear no resemblance whatsoever to the SA, or the SS, or any other Nazi goons) enforcing compliance with official "New Normal" ideology during 2020-2022. https://t.co/GIrb4NCJcC pic.twitter.com/6BIOgLVLKx
— CJ Hopkins (@CJHopkins_Z23) March 10, 2024
And, while the Commission is inquiring into the possibly slightly inappropriate behavior of their law enforcement officials, they might want to also take a look at the behavior of their unofficial goon squads, like Antifa, which they accidentally encouraged to attack the “anti-vaxxers,” the “Covid deniers,” and anyone brandishing a copy of the German constitution.
Don't worry, Covidian Cultists ... German Antifa is mobilizing to unleash total war on "extremist neo-Nazi Corona Deniers" like the lady holding the copy of the German constitution in the lower right! pic.twitter.com/HkdXBxyaEJ
— Consent Factory (@consent_factory) December 12, 2020
Come to think of it, the Inquiry Commission might also want to look into how the German authorities, and the overwhelming majority of the state and corporate media, accidentally systematically fomented mass hatred of anyone who dared to question the government’s arbitrary and nonsensical decrees or who refused to submit to “vaccination,” and publicly demonized us as “Corona deniers,” “conspiracy theorists,” “anti-vaxxers,” “far-right anti-Semites,” etc., to the point where mainstream German celebrities like Sarah Bosetti were literally describing us as the inessential “appendix” in the body of the nation, quoting an infamous Nazi almost verbatim.

And then there’s the whole “vaccination” business. The Commission will certainly want to inquire into that. They will probably want to start their inquiry with Karl Lauterbach, and determine exactly how he accidentally lied to the public, over and over, and over again …
And whipped people up into a mass hysteria over “KILLER VARIANTS” …

And “LONG COVID BRAIN ATTACKS” …

And how “THE UNVACCINATED ARE HOLDING THE WHOLE COUNTRY HOSTAGE, SO WE NEED TO FORCIBLY VACCINATE EVERYONE!”

And so on. I could go on with this all day, but it will be much easier to just refer you, and the Commission, to this documentary film by Aya Velázquez. Non-German readers may want to skip to the second half, unless they’re interested in the German “Corona Expert Council” …
Look, the point is, everybody makes “mistakes,” especially during a “state of emergency,” or a war, or some other type of global “crisis.” At least we can always count on the Germans to step up and take responsibility for theirs, and not claim that they didn’t know what was happening, or that they were “just following orders,” or that “the science changed.”
Plus, all this Covid stuff is ancient history, and, as Olaf, an editor at Der Spiegel, reminds us, it’s time to put the “The Divisive Pandemic” behind us …
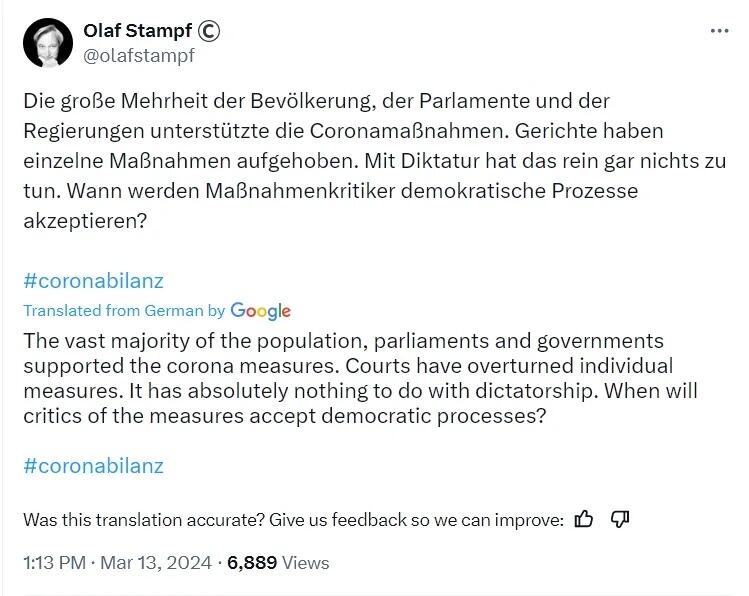
… and click heels, and heil the New Normal Democracy!
Government
Harvard Medical School Professor Was Fired Over Not Getting COVID Vaccine
Harvard Medical School Professor Was Fired Over Not Getting COVID Vaccine
Authored by Zachary Stieber via The Epoch Times (emphasis ours),
A…
Share this:

Authored by Zachary Stieber via The Epoch Times (emphasis ours),
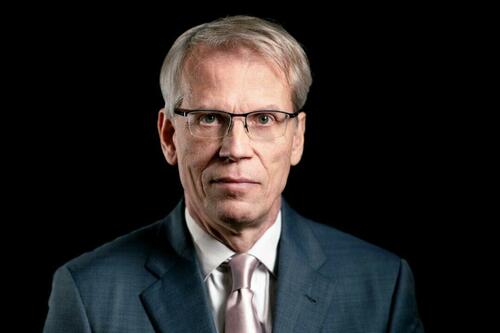
A Harvard Medical School professor who refused to get a COVID-19 vaccine has been terminated, according to documents reviewed by The Epoch Times.
Martin Kulldorff, an epidemiologist, was fired by Mass General Brigham in November 2021 over noncompliance with the hospital’s COVID-19 vaccine mandate after his requests for exemptions from the mandate were denied, according to one document. Mr. Kulldorff was also placed on leave by Harvard Medical School (HMS) because his appointment as professor of medicine there “depends upon” holding a position at the hospital, another document stated.
Mr. Kulldorff asked HMS in late 2023 how he could return to his position and was told he was being fired.
“You would need to hold an eligible appointment with a Harvard-affiliated institution for your HMS academic appointment to continue,” Dr. Grace Huang, dean for faculty affairs, told the epidemiologist and biostatistician.
She said the lack of an appointment, combined with college rules that cap leaves of absence at two years, meant he was being terminated.
Mr. Kulldorff disclosed the firing for the first time this month.
“While I can’t comment on the specifics due to employment confidentiality protections that preclude us from doing so, I can confirm that his employment agreement was terminated November 10, 2021,” a spokesperson for Brigham and Women’s Hospital told The Epoch Times via email.
Mass General Brigham granted just 234 exemption requests out of 2,402 received, according to court filings in an ongoing case that alleges discrimination.
The hospital said previously, “We received a number of exemption requests, and each request was carefully considered by a knowledgeable team of reviewers.”
“A lot of other people received exemptions, but I did not,” Mr. Kulldorff told The Epoch Times.
Mr. Kulldorff was originally hired by HMS but switched departments in 2015 to work at the Department of Medicine at Brigham and Women’s Hospital, which is part of Mass General Brigham and affiliated with HMS.
“Harvard Medical School has affiliation agreements with several Boston hospitals which it neither owns nor operationally controls,” an HMS spokesperson told The Epoch Times in an email. “Hospital-based faculty, such as Mr. Kulldorff, are employed by one of the affiliates, not by HMS, and require an active hospital appointment to maintain an academic appointment at Harvard Medical School.”
HMS confirmed that some faculty, who are tenured or on the tenure track, do not require hospital appointments.
Natural Immunity
Before the COVID-19 vaccines became available, Mr. Kulldorff contracted COVID-19. He was hospitalized but eventually recovered.
That gave him a form of protection known as natural immunity. According to a number of studies, including papers from the U.S. Centers for Disease Control and Prevention, natural immunity is better than the protection bestowed by vaccines.
Other studies have found that people with natural immunity face a higher risk of problems after vaccination.
Mr. Kulldorff expressed his concerns about receiving a vaccine in his request for a medical exemption, pointing out a lack of data for vaccinating people who suffer from the same issue he does.
“I already had superior infection-acquired immunity; and it was risky to vaccinate me without proper efficacy and safety studies on patients with my type of immune deficiency,” Mr. Kulldorff wrote in an essay.
In his request for a religious exemption, he highlighted an Israel study that was among the first to compare protection after infection to protection after vaccination. Researchers found that the vaccinated had less protection than the naturally immune.
“Having had COVID disease, I have stronger longer lasting immunity than those vaccinated (Gazit et al). Lacking scientific rationale, vaccine mandates are religious dogma, and I request a religious exemption from COVID vaccination,” he wrote.
Both requests were denied.
Mr. Kulldorff is still unvaccinated.
“I had COVID. I had it badly. So I have infection-acquired immunity. So I don’t need the vaccine,” he told The Epoch Times.
Dissenting Voice
Mr. Kulldorff has been a prominent dissenting voice during the COVID-19 pandemic, countering messaging from the government and many doctors that the COVID-19 vaccines were needed, regardless of prior infection.
He spoke out in an op-ed in April 2021, for instance, against requiring people to provide proof of vaccination to attend shows, go to school, and visit restaurants.
“The idea that everybody needs to be vaccinated is as scientifically baseless as the idea that nobody does. Covid vaccines are essential for older, high-risk people and their caretakers and advisable for many others. But those who’ve been infected are already immune,” he wrote at the time.
Mr. Kulldorff later co-authored the Great Barrington Declaration, which called for focused protection of people at high risk while removing restrictions for younger, healthy people.
Harsh restrictions such as school closures “will cause irreparable damage” if not lifted, the declaration stated.
The declaration drew criticism from Dr. Anthony Fauci, head of the National Institute of Allergy and Infectious Diseases, and Dr. Rochelle Walensky, who became the head of the CDC, among others.
In a competing document, Dr. Walensky and others said that “relying upon immunity from natural infections for COVID-19 is flawed” and that “uncontrolled transmission in younger people risks significant morbidity(3) and mortality across the whole population.”
“Those who are pushing these vaccine mandates and vaccine passports—vaccine fanatics, I would call them—to me they have done much more damage during this one year than the anti-vaxxers have done in two decades,” Mr. Kulldorff later said in an EpochTV interview. “I would even say that these vaccine fanatics, they are the biggest anti-vaxxers that we have right now. They’re doing so much more damage to vaccine confidence than anybody else.”
Surveys indicate that people have less trust now in the CDC and other health institutions than before the pandemic, and data from the CDC and elsewhere show that fewer people are receiving the new COVID-19 vaccines and other shots.
Support
The disclosure that Mr. Kulldorff was fired drew criticism of Harvard and support for Mr. Kulldorff.
The termination “is a massive and incomprehensible injustice,” Dr. Aaron Kheriaty, an ethics expert who was fired from the University of California–Irvine School of Medicine for not getting a COVID-19 vaccine because he had natural immunity, said on X.
“The academy is full of people who declined vaccines—mostly with dubious exemptions—and yet Harvard fires the one professor who happens to speak out against government policies.” Dr. Vinay Prasad, an epidemiologist at the University of California–San Francisco, wrote in a blog post. “It looks like Harvard has weaponized its policies and selectively enforces them.”
A petition to reinstate Mr. Kulldorff has garnered more than 1,800 signatures.
Some other doctors said the decision to let Mr. Kulldorff go was correct.
“Actions have consequence,” Dr. Alastair McAlpine, a Canadian doctor, wrote on X. He said Mr. Kulldorff had “publicly undermine[d] public health.”
Uncategorized
Correcting the Washington Post’s 11 Charts That Are Supposed to Tell Us How the Economy Changed Since Covid
The Washington Post made some serious errors or omissions in its 11 charts that are supposed to tell us how Covid changed the economy. Wages Starting with…
Share this:

The Washington Post made some serious errors or omissions in its 11 charts that are supposed to tell us how Covid changed the economy.
Wages
Starting with its second chart, the article gives us an index of average weekly wages since 2019. The index shows a big jump in 2020, which then falls off in 2021 and 2022, before rising again in 2023.
It tells readers:
“Many Americans got large pay increases after the pandemic, when employers were having to one-up each other to find and keep workers. For a while, those wage gains were wiped out by decade-high inflation: Workers were getting larger paychecks, but it wasn’t enough to keep up with rising prices.”
That actually is not what its chart shows. The big rise in average weekly wages at the start of the pandemic was not the result of workers getting pay increases, it was the result of low-paid workers in sectors like hotels and restaurants losing their jobs.
The number of people employed in the low-paying leisure and hospitality sector fell by more than 8 million at the start of the pandemic. Even at the start of 2021 it was still down by over 4 million.
Laying off low-paid workers raises average wages in the same way that getting the short people to leave raises the average height of the people in the room. The Washington Post might try to tell us that the remaining people grew taller, but that is not what happened.
The other problem with this chart is that it is giving us weekly wages. The length of the average workweek jumped at the start of the pandemic as employers decided to work the workers they had longer hours rather than hire more workers. In January of 2021 the average workweek was 34.9 hours, compared to 34.4 hours in 2019 and 34.3 hours in February.
This increase in hours, by itself, would raise weekly pay by 2.0 percent. As hours returned to normal in 2022, this measure would misleadingly imply that wages were falling.
It is also worth noting that the fastest wage gains since the pandemic have been at the bottom end of the wage distribution and the Black/white wage gap has fallen to its lowest level on record.
Saving Rates
The third chart shows the saving rate since 2019. It shows a big spike at the start of the pandemic, as people stopped spending on things like restaurants and travel and they got pandemic checks from the government. It then falls sharply in 2022 and is lower in the most recent quarters than in 2019.
The piece tells readers:
“But as the world reopened — and people resumed spending on dining out, travel, concerts and other things that were previously off-limits — savings rates have leveled off. Americans are also increasingly dip into rainy-day funds to pay more for necessities, including groceries, housing, education and health care. In fact, Americans are now generally saving less of their incomes than they were before the pandemic.
This is an incomplete picture due to a somewhat technical issue. As I explained in a blogpost a few months ago, there is an unusually large gap between GDP as measured on the output side and GDP measured on the income side. In principle, these two numbers should be the same, but they never come out exactly equal.
In recent quarters, the gap has been 2.5 percent of GDP. This is extraordinarily large, but it also is unusual in that the output side is higher than the income side, the opposite of the standard pattern over the last quarter century.
It is standard for economists to assume that the true number for GDP is somewhere between the two measures. If we make that assumption about the data for 2023, it would imply that income is somewhat higher than the data now show and consumption somewhat lower.
In that story, as I showed in the blogpost, the saving rate for 2023 would be 6.8 percent of disposable income, roughly the same as the average for the three years before the pandemic. This would mean that people are not dipping into their rainy-day funds as the Post tells us. They are spending pretty much as they did before the pandemic.
Credit Card Debt
The next graph shows that credit card debt is rising again, after sinking in the pandemic. The piece tells readers:
“But now, debt loads are swinging higher again as families try to keep up with rising prices. Total household debt reached a record $17.5 trillion at the end of 2023, according to the Federal Reserve Bank of New York. And, in a worrisome sign for the economy, delinquency rates on mortgages, car loans and credit cards are all rising, too.”
There are several points worth noting here. Credit card debt is rising, but measured relative to income it is still below where it was before the pandemic. It was 6.7 percent of disposable income at the end of 2019, compared to 6.5 percent at the end of last year.
The second point is that a major reason for the recent surge in credit card debt is that people are no longer refinancing mortgages. There was a massive surge in mortgage refinancing with the low interest rates in 2020-2021.
Many of the people who refinanced took additional money out, taking advantage of the increased equity in their home. This channel of credit was cut off when mortgage rates jumped in 2022 and virtually ended mortgage refinancing. This means that to a large extent the surge in credit card borrowing is simply a shift from mortgage debt to credit card debt.
The point about total household debt hitting a record can be said in most months. Except in the period immediately following the collapse of the housing bubble, total debt is almost always rising.
And the rise in delinquencies simply reflects the fact that they had been at very low levels in 2021 and 2022. For the most part, delinquency rates are just getting back to their pre-pandemic levels, which were historically low.
Grocery Prices and Gas Prices
The next two charts show the patterns in grocery prices and gas prices since the pandemic. It would have been worth mentioning that every major economy in the world saw similar run-ups in prices in these two areas. In other words, there was nothing specific to U.S. policy that led to a surge in inflation here.
The Missing Charts
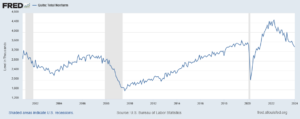
There are several areas where it would have been interesting to see charts which the Post did not include. It would have been useful to have a chart on job quitters, the number of people who voluntarily quit their jobs during the pandemic. In the tight labor markets of 2021 and 2022 the number of workers who left jobs they didn’t like soared to record levels, as shown below.
The vast majority of these workers took other jobs that they liked better. This likely explains another item that could appear as a graph, the record level of job satisfaction.
In a similar vein there has been an explosion in the number of people who work from home at least part-time. This has increased by more than 17 million during the pandemic. These workers are saving themselves thousands of dollars a year on commuting costs and related expenses, as well as hundreds of hours spent commuting.
Finally, there has been an explosion in the use of telemedicine since the pandemic. At the peak, nearly one in four visits with a health care professional was a remote consultation. This saved many people with serious health issues the time and inconvenience associated with a trip to a hospital or doctor’s office. The increased use of telemedicine is likely to be a lasting gain from the pandemic.
The World Has Changed
The pandemic will likely have a lasting impact on the economy and society. The Washington Post’s charts captured part of this story, but in some cases misrepr
The post Correcting the Washington Post’s 11 Charts That Are Supposed to Tell Us How the Economy Changed Since Covid appeared first on Center for Economic and Policy Research.
federal reserve pandemic mortgage rates gdp interest rates

The War Between Knowledge And Stupidity


Mistakes Were Made


Women’s basketball is gaining ground, but is March Madness ready to rival the men’s game?


Sylvester researchers, collaborators call for greater investment in bereavement care


Gen Z, The Most Pessimistic Generation In History, May Decide The Election


“I Can’t Even Save”: Americans Are Getting Absolutely Crushed Under Enormous Debt Load


“Extreme Events”: US Cancer Deaths Spiked In 2021 And 2022 In “Large Excess Over Trend”


Moderna turns the spotlight on long Covid with new initiatives


Copper Soars, Iron Ore Tumbles As Goldman Says “Copper’s Time Is Now”


Harvard Medical School Professor Was Fired Over Not Getting COVID Vaccine
-

 Uncategorized3 weeks ago
All Of The Elements Are In Place For An Economic Crisis Of Staggering Proportions
-

 International1 week ago
EyePoint poaches medical chief from Apellis; Sandoz CFO, longtime BioNTech exec to retire
-

 Spread & Containment4 days ago
IFM’s Hat Trick and Reflections On Option-To-Buy M&A
-

 Uncategorized4 weeks ago
California Counties Could Be Forced To Pay $300 Million To Cover COVID-Era Program
-

 Uncategorized3 weeks ago
Apparel Retailer Express Moving Toward Bankruptcy
-

 Uncategorized1 month ago
Industrial Production Decreased 0.1% in January
-

 International1 week ago
Walmart launches clever answer to Target’s new membership program
-

 Uncategorized4 weeks ago
RFK Jr: The Wuhan Cover-Up & The Rise Of The Biowarfare-Industrial Complex