International
Aurora Cannabis Announces Fiscal 2022 First Quarter Results
Transformation Plan On Track; Actions Taken-to-Date Have Driven Over $33 Million in Annualized Run-Rate Cost Savings
Total Cannabis Net Revenue, Net of Provisions, Grew ~10% to $60.1 million Compared to $54.8 Million in Q4 2021
Adjusted.
Share this:


- Transformation Plan On Track; Actions Taken-to-Date Have Driven Over $33 Million in Annualized Run-Rate Cost Savings
- Total Cannabis Net Revenue, Net of Provisions, Grew ~10% to $60.1 million Compared to $54.8 Million in Q4 2021
- Adjusted EBITDA Excluding Restructuring Costs Improved by $4.0 million to a loss of $11.5 million versus Q4 2021; Clear Pathway to Adjusted EBITDA Profitability by H1/FY23
- Improved Adjusted Gross Margin before FVA of 54% versus 53% in Q4 2021
Aurora Cannabis Inc. (the “Company” or “Aurora”) (NASDAQ: ACB) (TSX: ACB), the Canadian company defining the future of cannabinoids worldwide, today announced its financial and operational results for the first quarter fiscal 2022 ended September 30, 2021 .
")
“Our transformation plan is on track. We continue to strengthen and transform our business while benefitting from broad diversification across our international medical, domestic medical, and adult recreational segments. On a run-rate basis to date, we have executed over $33 million in annualized cost savings and are positioned to deliver approximately $60 to $80 million in aggregate across selling, general and administrative (“SG&A”), production, facility and logistic expenses upon the completion of our business transformation. Our strong Adjusted gross margins and narrowing Adjusted EBITDA loss are also providing us with a clear path to profitability by the first half of fiscal 2023 as we position ourselves for long-term success. Importantly, our robust balance sheet and working capital support our organic growth plans, and provide us with the financial flexibility to evaluate accretive M&A opportunities,” stated Miguel Martin , Chief Executive Officer of Aurora Cannabis.
“During the quarter, total cannabis net revenue increased by approximately 10% sequentially, driven by our industry leading and high margin global medical cannabis business. Our premiumization strategy also gained traction, as evidenced by 29% sequential revenue growth in our premium dry flower brands of San Rafael ’71 and Whistler, primarily driven by the launch of three new Coast cultivars,” he continued.
“Our regulatory and compliance expertise in medical is also enabling us to expand into global adult recreational as evidenced by our recent entry into the Dutch recreational market through an investment in Growery B.V., which based on today’s global regulatory framework we expect to become the largest regulated recreational market outside of Canada ,” he concluded.
First Quarter 2022 Highlights
(Unless otherwise stated, comparisons are made between fiscal Q1 2022, Q4 2021, and Q1 2021 results and are in Canadian dollars)
Medical Cannabis:
- Medical cannabis net revenue 1 was $41.0 million , a 23% increase from the prior year period. The increase was primarily attributable to continued growth in the international medical business, 84% growth sequentially and 146% over the prior year comparative period, as the Company continued to develop new, high margin medical markets such as Israel .
- Adjusted gross margin before fair value adjustments on medical cannabis net revenue 1 was 64% compared to 67% sequentially and 56% in the prior year period. The year over year improvement was a result of overall reduction in production costs due to the closure of non-core facilities as part of our business transformation plan and higher sales coming from our international sales, which yield higher margins.
Consumer Cannabis:
- Consumer cannabis net revenue 1 was $19.1 million , relatively steady compared to the prior quarter net revenue of $19.5 million and a 44% decrease from the prior year period. Brand mix improved sequentially as part of the Company’s premiumization strategy with San Rafael ’71 and Whistler comprising 37% of the flower sales, compared to 29% in the prior quarter. The decrease from the prior year was due primarily to reduced orders from the provinces in Canada , which reflects the impacts of COVID-19 and began impacting our revenues in Q3 2021.
- Adjusted gross margin before fair value adjustments on consumer cannabis net revenue 1 was 32% versus 30% sequentially and 41% in the prior year period. The sequential improvement was due to the improved mix of premium flower categories, and the change from the prior year was primarily driven by an increase in per-unit cost of sales due to under-utilized capacity at our core facilities as a result of scaling back production.
Consolidated:
- Adjusted gross margin before fair value adjustments on cannabis net revenue 1 was 54% in Q1 2022 versus 53% in the prior quarter and 48% in Q1 2021. The increase in Adjusted gross margin compared to the prior quarter is due primarily to a shift in sales mix towards the premium flower categories in the adult consumer market and increased sales in our medical markets which command significantly higher average net selling prices and margins.
- Adjusted EBITDA 1 loss improved to $12.1 million in Q1 2022 versus $19.7 million in Q4 2021 and $58.1 million in the prior year period. Excluding restructuring and contract termination charges, Adjusted EBITDA 1 loss was $11.5 million (Q4 2021 – $15.5 million , Q1 2021 – $10.7 million ) . The decrease in loss as compared to Q4 2021 was primarily driven by the 10% increase in revenues while Adjusted gross margins remained steady.
- Q1 2022 total cannabis net revenue 1 was $60.1 million , up 10% sequentially. Reflecting the shift in mix toward our medical businesses, the Q1 2022 average net selling price per gram of dried cannabis 1 increased to $4.67 per gram from $3.86 in Q1 2021 and down from $5.11 in Q4 2021 due to country mix in international sales. This excludes the impact of bulk wholesale of excess mid-potency cannabis flower at clear-out pricing.
Selling, General and Administrative (“SG&A”) :
- SG&A, including Research and Development (“R&D”), was $44.0 million , excluding $5.4 million in restructuring, severance and prior year bonus accruals, versus $42.6 million in the prior year quarter.
|
__________________________ |
|
1 These terms are non-GAAP measures, see “Non-GAAP Measures” below. |
Operational Efficiency Plan, Balance Sheet Strength, & Working Capital Improvement
Aurora has identified cash savings of $60 million to $80 million . We have already executed over $33 million in annualized run-rate cost savings to date, and expect to deliver the remainder before the end of Q2 fiscal 2023.
Approximately 60% of the savings are expected to be removed from our network through asset consolidation, and operational and supply chain efficiencies. The remaining 40% of savings are intended to be sourced through SG&A.
These cash savings will be reflected in our P&L either as they occur for SG&A savings, or as inventory is drawn down for production-related savings. These efficiencies are incremental to the approximately $300 million of total cost reductions achieved since the announcement of the Company’s business transformation plan in February 2020 .
The Company also views a strong balance sheet as critical to operating the business, executing its strategic plans, and pursuing growth opportunities in a prudent, disciplined manner, including within the U.S. At September 30, 2021 Aurora has a cash balance of approximately $424.3 million , comprised of $372.8 million of cash and cash equivalents and $51.5 million in restricted cash, no secured term debt, and access to US$1 billion of capital under its shelf prospectus.
The Company’s focus on realizing operational efficiencies and management of cash has greatly improved operating cash flow; reducing the need for incremental capital. In Q1 2022, Aurora managed cash flow tightly using $18.1 million in cash to fund operations, including working capital investments and restructuring and severance payments of $0.6 million . Cash inflow from capital expenditures, net of disposals, in Q1 2022 was $3.1 million versus cash outflow of $15.3 million in Q1 2021 and $6.2 million of cash inflow in Q4 2021.
Cash used in operations and for capital expenditures are crucial metrics in Aurora’s drive toward generating sustainable positive free cash flow, and both have improved significantly over the past year. The Company’s ongoing business transformation, with the additional cost efficiency savings described earlier, is expected to move the operating cash flow metric in a positive direction over the coming quarters.
Net working capital generated a cash outflow of $3.4 million in the quarter, excluding the impacts of inventory impairment primarily driven by a decrease in accounts receivable.
Fiscal Q1 2022 Cash Use
The main components of cash source and use in Q1 2022 were as follows:
|
($ thousands) |
Q1 2022 |
Q4 2021 |
Q1 2021 (3) |
|
Cash Flow |
|||
|
Cash, Opening (1) |
$440,851 |
$520,238 |
$162,179 |
|
Cash used in operations, including working capital |
($18,052) |
($7,840) |
($109,540) |
|
Capital expenditures, net of disposals and government grant income |
$3,053 |
$6,230 |
($15,278) |
|
Debt and interest payments |
($1,551) |
($90,141) (2) |
($17,966) |
|
Cash use |
($16,550) |
($91,751) |
($142,784) |
|
Proceeds raised from sale of marketable securities and investments in associates |
– |
$11,929 |
– |
|
Proceeds raised through debt |
– |
– |
– |
|
Proceeds raised through equity financing |
– |
$435 |
$114,283 |
|
Cash raised |
– |
$12,364 |
$114,283 |
|
Cash, Ending (1) |
$424,301 |
$440,851 |
$133,678 |
|
(1) |
Includes restricted cash of $51.5M at Q1 2022, $19.4M at Q4 2021, and nil at Q1 2021. |
|
(2) |
Includes $88.7 million full principal repayment on the BMO Credit Facility. As of June 30, 2021, the BMO Credit Facility has been fully settled and discharged. |
|
(3) |
Previously reported amounts have been retroactively recast for the biological assets and inventory non-material prior period error. Refer to the ” Significant Accounting Policies and Judgments ” section in Note 2(d) of the Financial Statements. |
Refer to the “Consolidated Statement of Cash Flows” in the “Consolidated Financial Statements” for our cash flow statements prepared in accordance with IAS 7 – Statement of Cash Flows.
|
($ thousands, except Operational Results) |
Q1 2022 |
Q1 2021 (1)(2) |
$ Change |
% Change |
Q4 2021 |
$ Change |
% Change |
|||||
|
Financial Results |
||||||||||||
|
Total net revenue (3) |
$60,108 |
$67,593 |
($7,485) |
(11) |
% |
$54,825 |
$5,283 |
10 |
% |
|||
|
Medical cannabis net revenue (3)(4a) |
$40,984 |
$33,255 |
$7,729 |
23 |
% |
$35,022 |
$5,962 |
17 |
% |
|||
|
Consumer cannabis net revenue (3)(4a) |
$19,124 |
$34,338 |
($15,214) |
(44) |
% |
$19,514 |
($390) |
(2) |
% |
|||
|
Adjusted gross margin before FV adjustments |
54 |
% |
48 |
% |
N/A |
6 |
% |
53 |
% |
N/A |
1 |
% |
|
Adjusted gross margin before FV adjustments |
64 |
% |
56 |
% |
N/A |
8 |
% |
67 |
% |
N/A |
(3) |
% |
|
Adjusted gross margin before FV adjustments |
32 |
% |
41 |
% |
N/A |
(9) |
% |
30 |
% |
N/A |
2 |
% |
|
SG&A expense |
$45,760 |
$44,088 |
$1,672 |
4 |
% |
$46,902 |
($1,142) |
(2) |
% |
|||
|
R&D expense |
$3,671 |
$2,583 |
$1,088 |
42 |
% |
$3,034 |
$637 |
21 |
% |
|||
|
Adjusted EBITDA (4c) |
($12,104) |
($58,124) |
$46,020 |
79 |
% |
($19,719) |
$7,615 |
39 |
% |
|||
|
Balance Sheet |
||||||||||||
|
Working capital |
$532,612 |
$206,335 |
$362,277 |
158 |
% |
$549,517 |
$16,905 |
(3) |
% |
|||
|
Cannabis inventory and biological assets (5) (2)(3)(7) |
$139,103 |
$171,086 |
($31,983) |
(19) |
% |
$120,297 |
$18,806 |
16 |
% |
|||
|
Total assets |
$2,560,316 |
$2,762,181 |
($201,865) |
(7) |
% |
$2,604,731 |
($44,415) |
(2) |
% |
|||
|
Operational Results – Cannabis |
||||||||||||
|
Average net selling price of dried cannabis excluding bulk sales (4) |
$4.67 |
$3.86 |
$0.81 |
21 |
% |
$5.11 |
($0.44) |
(9) |
% |
|||
|
Kilograms sold (6) |
12,484 |
16,139 |
(3,655) |
(23) |
% |
11,346 |
1,138 |
10 |
% |
|||
|
(1) |
Amounts have been retroactively recast for the biological assets and inventory non-material prior period error. Refer to the ” Significant Accounting Policies and Judgments” Note 2(d) in the Financial Statements for further detail. |
|
|
(2) |
As a result of the Company’s dissolution and divestment of its wholly-owned subsidiaries, Hempco and AHE, during the year ended June 30, 2021, the operations of Hempco and AHE have been presented as discontinued operations and the Company’s operational results have been retroactively restated, as required. Refer to Note 12(b) of the Financial Statements for additional information. |
|
|
(3) |
Includes the impact of actual and expected product returns and price adjustments (Q1 2022 – $0.7 million; Q4 2021 – $0.7 million; Q1 2020 – $0.8 million). |
|
|
(4) |
These terms are defined in the ” Cautionary Statement Regarding Certain Non-GAAP Performance Measures ” section of the MD&A. Refer to the following sections for reconciliation of non-GAAP measures to the IFRS equivalent measure: |
|
|
a. |
Refer to the ” Revenue ” section for a reconciliation of cannabis net revenue to the IFRS equivalent. |
|
|
b. |
Refer to the ” Cost of Sales and Gross Margin ” section for reconciliation to the IFRS equivalent. |
|
|
c. |
Refer to the ” Adjusted EBITDA” section for reconciliation to the IFRS equivalent. |
|
|
(5) |
Represents total biological assets and cannabis inventory, exclusive of merchandise, accessories, supplies and consumables. |
|
|
(6) |
The kilograms sold is offset by the grams returned during the period. |
|
Conference Call
Aurora will host a conference call today, Tuesday, November 9, 2021 , to discuss these results. Miguel Martin, Chief Executive Officer, and Glen Ibbott , Chief Financial Officer, will host the call starting at 5:00 p.m. Eastern Time | 3:00 p.m. Mountain Time. A question and answer session will follow management’s presentation.
Conference Call Details
|
DATE: |
Tuesday, November 9, 2021 |
|
|
TIME: |
5:00 p.m. Eastern Time | 3:00 p.m. Mountain Time |
|
|
WEBCAST: |
Investors may submit questions in advance or during the conference call itself through same weblink listed above. This weblink has also been posted to the Company’s “Investor Info” link at https://investor.auroramj.com/ under “News & Events”.
About Aurora
Aurora is a global leader in the cannabis industry, serving both the medical and consumer markets. Headquartered in Edmonton, Alberta , Aurora is a pioneer in global cannabis dedicated to helping people improve their lives. The Company’s brand portfolio includes Aurora, Aurora Drift , San Rafael ’71 , Daily Special , MedReleaf, CanniMed, Pedanios, Whistler , Reliva and KG7 CBD . Driven by science and innovation, and with a focus on high-quality cannabis products, Aurora’s brands continue to break through as industry leaders in the medical, performance, wellness and adult recreational markets wherever they are launched. Learn more at www.auroramj.com and follow us on Twitter and LinkedIn .
Aurora’s common shares trade on the TSX and NASDAQ under the symbol “ACB” and is a constituent of the S&P/TSX Composite Index.
Forward Looking Statements
This news release includes statements containing certain “forward-looking information” within the meaning of applicable securities law (“forward-looking statements”). Forward-looking statements are frequently characterized by words such as “plan”, “continue”, “expect”, “project”, “intend”, “believe”, “anticipate”, “estimate”, “may”, “will”, “potential”, “proposed” and other similar words, or statements that certain events or conditions “may” or “will” occur. Forward-looking statements made in this news release include, but are not limited to, statements with respect to:
- pro forma measures including revenue, cash flow, Adjusted gross margin before fair value adjustments, and expected SG&A run-rates;
- the Company’s ability to execute on its business transformation plan, and path and timing to achieve Adjusted EBITDA profitability;
- planned cost efficiencies, including the execution of the Company’s costs savings plan, including, but not limited to, asset consolidation, supply chain efficiency and other reductions in SG&A expenses;
- the anticipated relative size of the Dutch recreational market; and
- future strategic plans and pursuit of growth opportunities, including, but not limited to, M&A in the United States and the expansion into additional international markets.
These forward-looking statements are only predictions. Forward looking information or statements contained in this news release have been developed based on assumptions management considers to be reasonable. Material factors or assumptions involved in developing forward-looking statements include, without limitation, publicly available information from governmental sources as well as from market research and industry analysis and on assumptions based on data and knowledge of this industry which the Company believes to be reasonable. Forward-looking statements are subject to a variety of risks, uncertainties and other factors that management believes to be relevant and reasonable in the circumstances could cause actual events, results, level of activity, performance, prospects, opportunities or achievements to differ materially from those projected in the forward-looking statements. These risks include, but are not limited to, the ability to retain key personnel, the ability to continue investing in infrastructure to support growth, the ability to obtain financing on acceptable terms, the continued quality of our products, customer experience and retention, the development of third party government and non-government consumer sales channels, management’s estimates of consumer demand in Canada and in jurisdictions where the Company exports, expectations of future results and expenses, the risk of successful integration of acquired business and operations, management’s estimation that SG&A will grow only in proportion of revenue growth, the ability to expand and maintain distribution capabilities, the impact of competition, the general impact of financial market conditions, the yield from cannabis growing operations, product demand, changes in prices of required commodities, competition, and the possibility for changes in laws, rules, and regulations in the industry, epidemics, pandemics or other public health crises, including the current outbreak of COVID-19, and other risks, uncertainties and factors set out under the heading “Risk Factors” in the Company’s annual information form dated September 27, 2021 (the “AIF”) and filed with Canadian securities regulators available on the Company’s issuer profile on SEDAR at www.sedar.com and filed with and available on the SEC’s website at www.sec.gov . The Company cautions that the list of risks, uncertainties and other factors described in the AIF is not exhaustive and other factors could also adversely affect its results. Readers are urged to consider the risks, uncertainties and assumptions carefully in evaluating the forward-looking statements and are cautioned not to place undue reliance on such information. The Company is under no obligation, and expressly disclaims any intention or obligation, to update or revise any forward-looking statements, whether as a result of new information, future events or otherwise, except as expressly required by applicable securities law
Non-GAAP Measures
This news release contains certain financial performance measures that are not recognized or defined under IFRS (termed “Non-GAAP Measures”). As a result, this data may not be comparable to data presented by other licensed producers of cannabis and cannabis companies. For an explanation of these measures to related comparable financial information presented in the consolidated financial statements prepared in accordance with IFRS, refer to the discussion below. The Company believes that these Non-GAAP Measures are useful indicators of operating performance and are specifically used by management to assess the financial and operational performance of the Company. These Non-GAAP Measures include, but are not limited, to the following:
- Cannabis net revenue represents revenue from the sale of cannabis products, excluding excise taxes. Cannabis net revenue is further broken down as follows:
- Medical cannabis net revenue represents Canadian and international cannabis net revenue for medical cannabis sales only.
- Consumer cannabis net revenue represents cannabis net revenue for consumer cannabis sales only.
- Wholesale bulk cannabis net revenue represents cannabis net revenue for wholesale bulk cannabis only.
- Ancillary net revenue represents non-cannabis net revenue for ancillary support functions only.
- Management believes the cannabis net revenue measures provide more specific information about the net revenue purely generated from our core cannabis business and by market type.
- Average net selling price per gram and gram equivalent is calculated by taking cannabis net revenue and removing the impact of cost of sales net against revenue in agency relationships, which is then divided by total grams and grams equivalent of cannabis sold in the period. Average net selling price per gram and gram equivalent is further broken down as follows:
- Average net selling price per gram of dried cannabis represents the average net selling price per gram for dried cannabis sales only, excluding wholesale bulk cannabis sold in the period.
- Average net selling price per gram of international dried cannabis represents the average net selling price per gram for international dried cannabis sales only, excluding wholesale bulk cannabis sold in the period.
- Average net selling price per gram and gram equivalent of Canadian medical cannabis represents the average net selling price per gram and gram equivalent for dried cannabis and cannabis derivatives sold in the Canadian medical market.
- Average net selling price per gram and gram equivalent of medical cannabis represents the average net selling price per gram and gram equivalent for dried cannabis and cannabis derivatives sold in the medical market.
- Average net selling price per gram and gram equivalent of consumer cannabis represents the average net selling price per gram and gram equivalent for dried cannabis and cannabis derivatives sold in the consumer market.
- Management believes the average net selling price per gram or gram equivalent measures provide more specific information about the pricing trends over time by product and market type. Under an agency relationship, revenue is recognized net of cost of sales in accordance with IFRS. Management believes the removal of agency cost of sales in determining the average net selling price per gram and gram equivalent is more reflective of our average net selling price generated in the marketplace.
- Gross profit before FV adjustments on cannabis net revenue is calculated by subtracting (i) cost of sales, before the effects of changes in FV of biological assets and inventory, and (ii) cost of sales from non-cannabis ancillary support functions, from total cannabis net revenue. Gross margin before FV adjustments on cannabis net revenue is calculated by dividing gross profit before FV adjustments on cannabis net revenue divided by cannabis net revenue. Management believes that these measures provide useful information to assess the profitability of our cannabis operations as it excludes the effects of non-cash FV adjustments on inventory and biological assets, which are required by IFRS.
- Adjusted gross profit before FV adjustments on cannabis net revenue represents cash gross profit and gross margin on cannabis net revenue and is calculated by subtracting from total cannabis net revenue (i) cost of sales, before the effects of changes in FV of biological assets and inventory; (ii) cost of sales from non-cannabis ancillary support functions; and removing (iii) depreciation in cost of sales; (iv) cannabis inventory impairment; and (v) out-of-period adjustments. Adjusted gross margin before FV adjustments on cannabis net revenue is calculated by dividing Adjusted gross profit before FV adjustments on cannabis net revenue divided by cannabis net revenue. Adjusted gross profit and gross margin before FV adjustments on cannabis net revenue is further broken down as follows:
- Adjusted gross profit and gross margin before FV adjustments on medical cannabis net revenue represents gross profit and gross margin before FV adjustments on sales generated in the medical market only.
- Adjusted gross profit and gross margin before FV adjustments on consumer cannabis net revenue represents gross profit and gross margin before FV adjustments on sales generated in the consumer market only.
- Adjusted gross profit and gross margin before FV adjustments on wholesale bulk cannabis net revenue represents gross profit and gross margin before FV adjustments on sales generated from wholesale bulk cannabis only.
- Adjusted gross profit and gross margin before FV adjustments on ancillary net revenue represents gross profit and gross margin before FV adjustments on sales generated from ancillary support functions only.
- Management believes that these measures provide useful information to assess the profitability of our cannabis operations as it represents the cash gross profit and margin generated from cannabis operations and excludes (i) out-of-period adjustments to provide information that reflects current period results; and (ii) excludes the effects of non-cash FV adjustments on inventory and biological assets, which are required by IFRS.
- Adjusted EBITDA is calculated as net income (loss) excluding interest income (expense), accretion, income taxes, depreciation, amortization, changes in fair value of inventory sold, changes in fair value of biological assets, share-based compensation, acquisition costs, foreign exchange, share of income (losses) from investment in associates, government grant income, fair value gains and losses on financial instruments, gains and losses on deemed disposal, losses on disposal of assets, restructuring charges, onerous contract provisions, out-of-period adjustments, and non-cash impairments of deposits, property, plant and equipment, equity investments, intangibles, goodwill, and other assets. Adjusted EBITDA is intended to provide a proxy for the Company’s operating cash flow and is widely used by industry analysts to compare Aurora to its competitors, and derive expectations of future financial performance for Aurora, and excludes out-of-period adjustments that are not reflective of current operating results. Adjusted EBITDA increases comparability between comparative companies by eliminating variability resulting from differences in capital structures, management decisions related to resource allocation, and the impact of FV adjustments on biological assets and inventory and financial instruments, which may be volatile and fluctuate significantly from period to period.
Non-GAAP measures should be considered together with other data prepared accordance with IFRS to enable investors to evaluate the Company’s operating results, underlying performance and prospects in a manner similar to Aurora’s management. Accordingly, these non-GAAP measures are intended to provide additional information and should not be considered in isolation or as a substitute for measures of performance prepared in accordance with IFRS.
View original content to download multimedia: https://www.prnewswire.com/news-releases/aurora-cannabis-announces-fiscal-2022-first-quarter-results-301420228.html
SOURCE Aurora Cannabis Inc.
View original content to download multimedia: http://www.newswire.ca/en/releases/archive/November2021/09/c2297.html
News Provided by Canada Newswire via QuoteMedia

Cannabis Market Could Reach $5.5B By End Of Year
Experts Weigh In On Our Exclusive FREE Report. Can You Afford To Miss Out?
International
Red Candle In The Wind
Red Candle In The Wind
By Benjamin PIcton of Rabobank
February non-farm payrolls superficially exceeded market expectations on Friday by…
Share this:

By Benjamin PIcton of Rabobank
February non-farm payrolls superficially exceeded market expectations on Friday by printing at 275,000 against a consensus call of 200,000. We say superficially, because the downward revisions to prior months totalled 167,000 for December and January, taking the total change in employed persons well below the implied forecast, and helping the unemployment rate to pop two-ticks to 3.9%. The U6 underemployment rate also rose from 7.2% to 7.3%, while average hourly earnings growth fell to 0.2% m-o-m and average weekly hours worked languished at 34.3, equalling pre-pandemic lows.
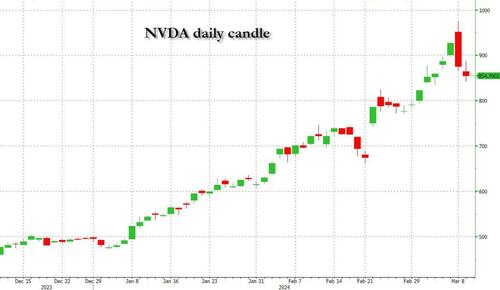
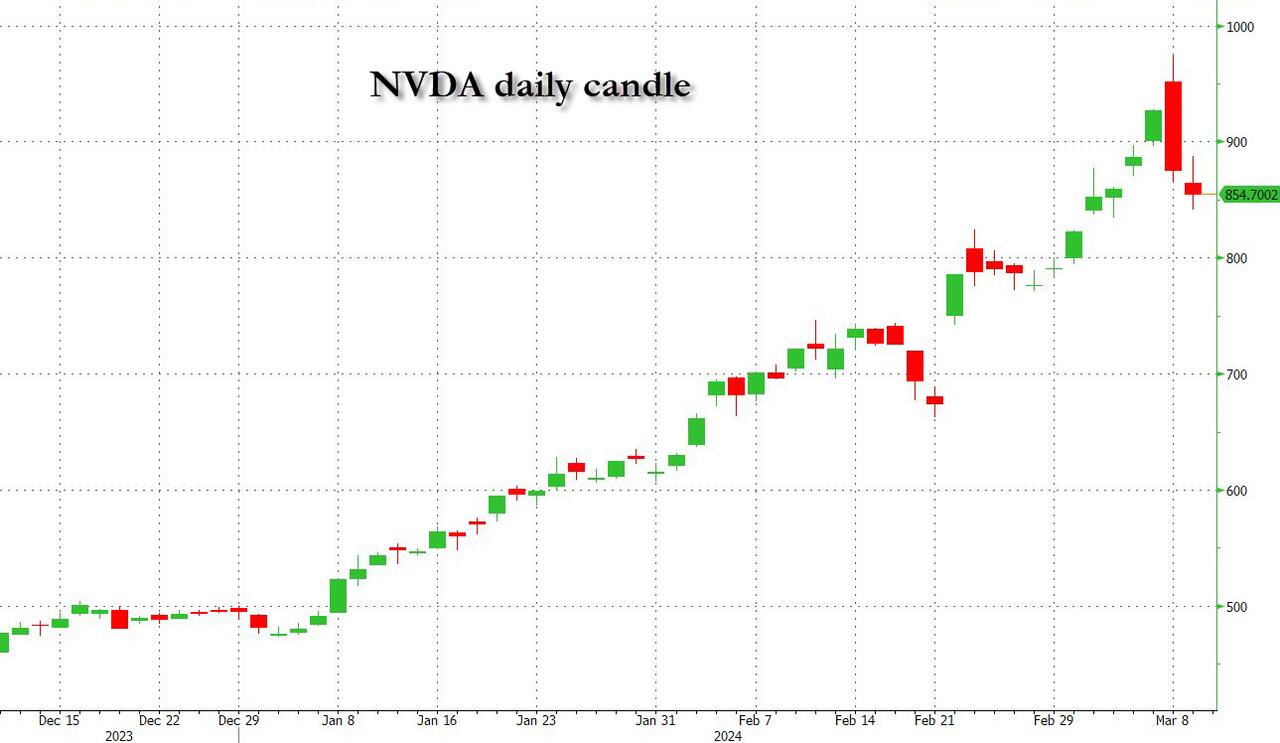
Undeterred by the devil in the detail, the algos sprang into action once exchanges opened. Market darling NVIDIA hit a new intraday high of $974 before (presumably) the humans took over and sold the stock down more than 10% to close at $875.28. If our suspicions are correct that it was the AIs buying before the humans started selling (no doubt triggering trailing stops on the way down), the irony is not lost on us.
The 1-day chart for NVIDIA now makes for interesting viewing, because the red candle posted on Friday presents quite a strong bearish engulfing signal. Volume traded on the day was almost double the 15-day simple moving average, and similar price action is observable on the 1-day charts for both Intel and AMD. Regular readers will be aware that we have expressed incredulity in the past about the durability the AI thematic melt-up, so it will be interesting to see whether Friday’s sell off is just a profit-taking blip, or a genuine trend reversal.
AI equities aside, this week ought to be important for markets because the BTFP program expires today. That means that the Fed will no longer be loaning cash to the banking system in exchange for collateral pledged at-par. The KBW Regional Banking index has so far taken this in its stride and is trading 30% above the lows established during the mini banking crisis of this time last year, but the Fed’s liquidity facility was effectively an exercise in can-kicking that makes regional banks a sector of the market worth paying attention to in the weeks ahead. Even here in Sydney, regulators are warning of external risks posed to the banking sector from scheduled refinancing of commercial real estate loans following sharp falls in valuations.
Markets are sending signals in other sectors, too. Gold closed at a new record-high of $2178/oz on Friday after trading above $2200/oz briefly. Gold has been going ballistic since the Friday before last, posting gains even on days where 2-year Treasury yields have risen. Gold bugs are buying as real yields fall from the October highs and inflation breakevens creep higher. This is particularly interesting as gold ETFs have been recording net outflows; suggesting that price gains aren’t being driven by a retail pile-in. Are gold buyers now betting on a stagflationary outcome where the Fed cuts without inflation being anchored at the 2% target? The price action around the US CPI release tomorrow ought to be illuminating.
Leaving the day-to-day movements to one side, we are also seeing further signs of structural change at the macro level. The UK budget last week included a provision for the creation of a British ISA. That is, an Individual Savings Account that provides tax breaks to savers who invest their money in the stock of British companies. This follows moves last year to encourage pension funds to head up the risk curve by allocating 5% of their capital to unlisted investments.
As a Hail Mary option for a government cruising toward an electoral drubbing it’s a curious choice, but it’s worth highlighting as cash-strapped governments increasingly see private savings pools as a funding solution for their spending priorities.
Of course, the UK is not alone in making creeping moves towards financial repression. In contrast to announcements today of increased trade liberalisation, Australian Treasurer Jim Chalmers has in the recent past flagged his interest in tapping private pension savings to fund state spending priorities, including defence, public housing and renewable energy projects. Both the UK and Australia appear intent on finding ways to open up the lungs of their economies, but government wants more say in directing private capital flows for state goals.
So, how far is the blurring of the lines between free markets and state planning likely to go? Given the immense and varied budgetary (and security) pressures that governments are facing, could we see a re-up of WWII-era Victory bonds, where private investors are encouraged to do their patriotic duty by directly financing government at negative real rates?
That would really light a fire under the gold market.
Spread & Containment
Trump “Clearly Hasn’t Learned From His COVID-Era Mistakes”, RFK Jr. Says
Trump "Clearly Hasn’t Learned From His COVID-Era Mistakes", RFK Jr. Says
Authored by Jeff Louderback via The Epoch Times (emphasis ours),
President…
Share this:

Authored by Jeff Louderback via The Epoch Times (emphasis ours),
President Joe Biden claimed that COVID vaccines are now helping cancer patients during his State of the Union address on March 7, but it was a response on Truth Social from former President Donald Trump that drew the ire of independent presidential candidate Robert F. Kennedy Jr.
During the address, President Biden said: “The pandemic no longer controls our lives. The vaccines that saved us from COVID are now being used to help beat cancer, turning setback into comeback. That’s what America does.”
President Trump wrote: “The Pandemic no longer controls our lives. The VACCINES that saved us from COVID are now being used to help beat cancer—turning setback into comeback. YOU’RE WELCOME JOE. NINE-MONTH APPROVAL TIME VS. 12 YEARS THAT IT WOULD HAVE TAKEN YOU.”
An outspoken critic of President Trump’s COVID response, and the Operation Warp Speed program that escalated the availability of COVID vaccines, Mr. Kennedy said on X, formerly known as Twitter, that “Donald Trump clearly hasn’t learned from his COVID-era mistakes.”
“He fails to recognize how ineffective his warp speed vaccine is as the ninth shot is being recommended to seniors. Even more troubling is the documented harm being caused by the shot to so many innocent children and adults who are suffering myocarditis, pericarditis, and brain inflammation,” Mr. Kennedy remarked.
“This has been confirmed by a CDC-funded study of 99 million people. Instead of bragging about its speedy approval, we should be honestly and transparently debating the abundant evidence that this vaccine may have caused more harm than good.
“I look forward to debating both Trump and Biden on Sept. 16 in San Marcos, Texas.”
Mr. Kennedy announced in April 2023 that he would challenge President Biden for the 2024 Democratic Party presidential nomination before declaring his run as an independent last October, claiming that the Democrat National Committee was “rigging the primary.”
Since the early stages of his campaign, Mr. Kennedy has generated more support than pundits expected from conservatives, moderates, and independents resulting in speculation that he could take votes away from President Trump.
Many Republicans continue to seek a reckoning over the government-imposed pandemic lockdowns and vaccine mandates.
President Trump’s defense of Operation Warp Speed, the program he rolled out in May 2020 to spur the development and distribution of COVID-19 vaccines amid the pandemic, remains a sticking point for some of his supporters.
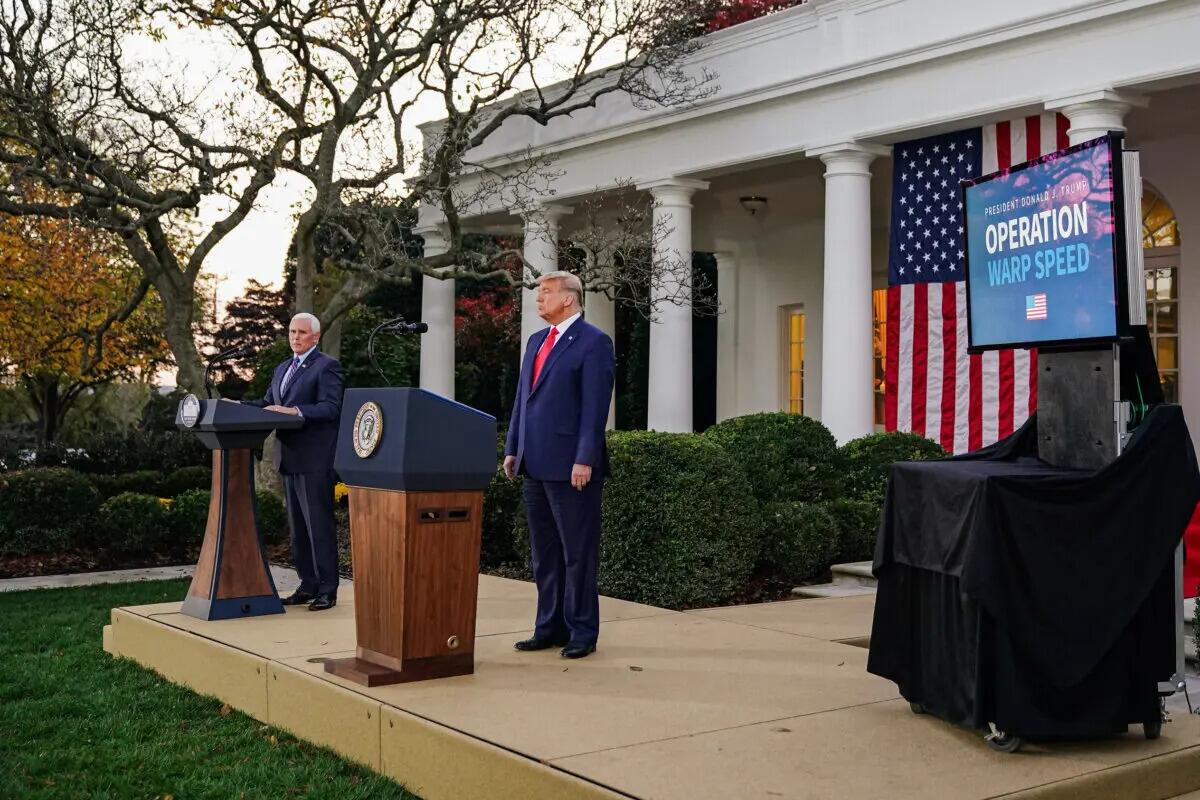
Operation Warp Speed featured a partnership between the government, the military, and the private sector, with the government paying for millions of vaccine doses to be produced.
President Trump released a statement in March 2021 saying: “I hope everyone remembers when they’re getting the COVID-19 Vaccine, that if I wasn’t President, you wouldn’t be getting that beautiful ‘shot’ for 5 years, at best, and probably wouldn’t be getting it at all. I hope everyone remembers!”
President Trump said about the COVID-19 vaccine in an interview on Fox News in March 2021: “It works incredibly well. Ninety-five percent, maybe even more than that. I would recommend it, and I would recommend it to a lot of people that don’t want to get it and a lot of those people voted for me, frankly.
“But again, we have our freedoms and we have to live by that and I agree with that also. But it’s a great vaccine, it’s a safe vaccine, and it’s something that works.”
On many occasions, President Trump has said that he is not in favor of vaccine mandates.
An environmental attorney, Mr. Kennedy founded Children’s Health Defense, a nonprofit that aims to end childhood health epidemics by promoting vaccine safeguards, among other initiatives.
Last year, Mr. Kennedy told podcaster Joe Rogan that ivermectin was suppressed by the FDA so that the COVID-19 vaccines could be granted emergency use authorization.
He has criticized Big Pharma, vaccine safety, and government mandates for years.
Since launching his presidential campaign, Mr. Kennedy has made his stances on the COVID-19 vaccines, and vaccines in general, a frequent talking point.
“I would argue that the science is very clear right now that they [vaccines] caused a lot more problems than they averted,” Mr. Kennedy said on Piers Morgan Uncensored last April.
“And if you look at the countries that did not vaccinate, they had the lowest death rates, they had the lowest COVID and infection rates.”
Additional data show a “direct correlation” between excess deaths and high vaccination rates in developed countries, he said.
President Trump and Mr. Kennedy have similar views on topics like protecting the U.S.-Mexico border and ending the Russia-Ukraine war.
COVID-19 is the topic where Mr. Kennedy and President Trump seem to differ the most.
Former President Donald Trump intended to “drain the swamp” when he took office in 2017, but he was “intimidated by bureaucrats” at federal agencies and did not accomplish that objective, Mr. Kennedy said on Feb. 5.
Speaking at a voter rally in Tucson, where he collected signatures to get on the Arizona ballot, the independent presidential candidate said President Trump was “earnest” when he vowed to “drain the swamp,” but it was “business as usual” during his term.
John Bolton, who President Trump appointed as a national security adviser, is “the template for a swamp creature,” Mr. Kennedy said.
Scott Gottlieb, who President Trump named to run the FDA, “was Pfizer’s business partner” and eventually returned to Pfizer, Mr. Kennedy said.
Mr. Kennedy said that President Trump had more lobbyists running federal agencies than any president in U.S. history.
“You can’t reform them when you’ve got the swamp creatures running them, and I’m not going to do that. I’m going to do something different,” Mr. Kennedy said.
During the COVID-19 pandemic, President Trump “did not ask the questions that he should have,” he believes.
President Trump “knew that lockdowns were wrong” and then “agreed to lockdowns,” Mr. Kennedy said.
He also “knew that hydroxychloroquine worked, he said it,” Mr. Kennedy explained, adding that he was eventually “rolled over” by Dr. Anthony Fauci and his advisers.

MaryJo Perry, a longtime advocate for vaccine choice and a Trump supporter, thinks votes will be at a premium come Election Day, particularly because the independent and third-party field is becoming more competitive.
Ms. Perry, president of Mississippi Parents for Vaccine Rights, believes advocates for medical freedom could determine who is ultimately president.
She believes that Mr. Kennedy is “pulling votes from Trump” because of the former president’s stance on the vaccines.
“People care about medical freedom. It’s an important issue here in Mississippi, and across the country,” Ms. Perry told The Epoch Times.
“Trump should admit he was wrong about Operation Warp Speed and that COVID vaccines have been dangerous. That would make a difference among people he has offended.”
President Trump won’t lose enough votes to Mr. Kennedy about Operation Warp Speed and COVID vaccines to have a significant impact on the election, Ohio Republican strategist Wes Farno told The Epoch Times.
President Trump won in Ohio by eight percentage points in both 2016 and 2020. The Ohio Republican Party endorsed President Trump for the nomination in 2024.
“The positives of a Trump presidency far outweigh the negatives,” Mr. Farno said. “People are more concerned about their wallet and the economy.
“They are asking themselves if they were better off during President Trump’s term compared to since President Biden took office. The answer to that question is obvious because many Americans are struggling to afford groceries, gas, mortgages, and rent payments.
“America needs President Trump.”
Multiple national polls back Mr. Farno’s view.
As of March 6, the RealClearPolitics average of polls indicates that President Trump has 41.8 percent support in a five-way race that includes President Biden (38.4 percent), Mr. Kennedy (12.7 percent), independent Cornel West (2.6 percent), and Green Party nominee Jill Stein (1.7 percent).
A Pew Research Center study conducted among 10,133 U.S. adults from Feb. 7 to Feb. 11 showed that Democrats and Democrat-leaning independents (42 percent) are more likely than Republicans and GOP-leaning independents (15 percent) to say they have received an updated COVID vaccine.
The poll also reported that just 28 percent of adults say they have received the updated COVID inoculation.
The peer-reviewed multinational study of more than 99 million vaccinated people that Mr. Kennedy referenced in his X post on March 7 was published in the Vaccine journal on Feb. 12.
It aimed to evaluate the risk of 13 adverse events of special interest (AESI) following COVID-19 vaccination. The AESIs spanned three categories—neurological, hematologic (blood), and cardiovascular.
The study reviewed data collected from more than 99 million vaccinated people from eight nations—Argentina, Australia, Canada, Denmark, Finland, France, New Zealand, and Scotland—looking at risks up to 42 days after getting the shots.
Three vaccines—Pfizer and Moderna’s mRNA vaccines as well as AstraZeneca’s viral vector jab—were examined in the study.
Researchers found higher-than-expected cases that they deemed met the threshold to be potential safety signals for multiple AESIs, including for Guillain-Barre syndrome (GBS), cerebral venous sinus thrombosis (CVST), myocarditis, and pericarditis.
A safety signal refers to information that could suggest a potential risk or harm that may be associated with a medical product.
The study identified higher incidences of neurological, cardiovascular, and blood disorder complications than what the researchers expected.
President Trump’s role in Operation Warp Speed, and his continued praise of the COVID vaccine, remains a concern for some voters, including those who still support him.
Krista Cobb is a 40-year-old mother in western Ohio. She voted for President Trump in 2020 and said she would cast her vote for him this November, but she was stunned when she saw his response to President Biden about the COVID-19 vaccine during the State of the Union address.
“I love President Trump and support his policies, but at this point, he has to know they [advisers and health officials] lied about the shot,” Ms. Cobb told The Epoch Times.
“If he continues to promote it, especially after all of the hearings they’ve had about it in Congress, the side effects, and cover-ups on Capitol Hill, at what point does he become the same as the people who have lied?” Ms. Cobb added.
“I think he should distance himself from talk about Operation Warp Speed and even admit that he was wrong—that the vaccines have not had the impact he was told they would have. If he did that, people would respect him even more.”
International
There will soon be one million seats on this popular Amtrak route
“More people are taking the train than ever before,” says Amtrak’s Executive Vice President.
Share this:


While the size of the United States makes it hard for it to compete with the inter-city train access available in places like Japan and many European countries, Amtrak trains are a very popular transportation option in certain pockets of the country — so much so that the country’s national railway company is expanding its Northeast Corridor by more than one million seats.
Related: This is what it's like to take a 19-hour train from New York to Chicago
Running from Boston all the way south to Washington, D.C., the route is one of the most popular as it passes through the most densely populated part of the country and serves as a commuter train for those who need to go between East Coast cities such as New York and Philadelphia for business.
Veronika Bondarenko
Amtrak launches new routes, promises travelers ‘additional travel options’
Earlier this month, Amtrak announced that it was adding four additional Northeastern routes to its schedule — two more routes between New York’s Penn Station and Union Station in Washington, D.C. on the weekend, a new early-morning weekday route between New York and Philadelphia’s William H. Gray III 30th Street Station and a weekend route between Philadelphia and Boston’s South Station.
More Travel:
- A new travel term is taking over the internet (and reaching airlines and hotels)
- The 10 best airline stocks to buy now
- Airlines see a new kind of traveler at the front of the plane
According to Amtrak, these additions will increase Northeast Corridor’s service by 20% on the weekdays and 10% on the weekends for a total of one million additional seats when counted by how many will ride the corridor over the year.
“More people are taking the train than ever before and we’re proud to offer our customers additional travel options when they ride with us on the Northeast Regional,” Amtrak Executive Vice President and Chief Commercial Officer Eliot Hamlisch said in a statement on the new routes. “The Northeast Regional gets you where you want to go comfortably, conveniently and sustainably as you breeze past traffic on I-95 for a more enjoyable travel experience.”
Here are some of the other Amtrak changes you can expect to see
Amtrak also said that, in the 2023 financial year, the Northeast Corridor had nearly 9.2 million riders — 8% more than it had pre-pandemic and a 29% increase from 2022. The higher demand, particularly during both off-peak hours and the time when many business travelers use to get to work, is pushing Amtrak to invest into this corridor in particular.
To reach more customers, Amtrak has also made several changes to both its routes and pricing system. In the fall of 2023, it introduced a type of new “Night Owl Fare” — if traveling during very late or very early hours, one can go between cities like New York and Philadelphia or Philadelphia and Washington. D.C. for $5 to $15.
As travel on the same routes during peak hours can reach as much as $300, this was a deliberate move to reach those who have the flexibility of time and might have otherwise preferred more affordable methods of transportation such as the bus. After seeing strong uptake, Amtrak added this type of fare to more Boston routes.
The largest distances, such as the ones between Boston and New York or New York and Washington, are available at the lowest rate for $20.
stocks pandemic japan european

Red Candle In The Wind


‘I couldn’t stand the pain’: the Turkish holiday resort that’s become an emergency dental centre for Britons who can’t get treated at home


Beloved mall retailer files Chapter 7 bankruptcy, will liquidate


Is the National Guard a solution to school violence?


Trump “Clearly Hasn’t Learned From His COVID-Era Mistakes”, RFK Jr. Says


Rand Paul Teases Senate GOP Leader Run – Musk Says “I Would Support”


The next pandemic? It’s already here for Earth’s wildlife


The Grinch Who Stole Freedom


As the pandemic turns four, here’s what we need to do for a healthier future


This is the biggest money mistake you’re making during travel
-

 Uncategorized3 weeks ago
All Of The Elements Are In Place For An Economic Crisis Of Staggering Proportions
-

 Uncategorized3 weeks ago
California Counties Could Be Forced To Pay $300 Million To Cover COVID-Era Program
-

 International4 days ago
EyePoint poaches medical chief from Apellis; Sandoz CFO, longtime BioNTech exec to retire
-

 Uncategorized2 weeks ago
Apparel Retailer Express Moving Toward Bankruptcy
-

 Uncategorized4 weeks ago
Industrial Production Decreased 0.1% in January
-

 International3 days ago
Walmart launches clever answer to Target’s new membership program
-

 Uncategorized3 weeks ago
RFK Jr: The Wuhan Cover-Up & The Rise Of The Biowarfare-Industrial Complex
-

 Uncategorized3 weeks ago
GOP Efforts To Shore Up Election Security In Swing States Face Challenges