Uncategorized
Are We Bullish Enough?
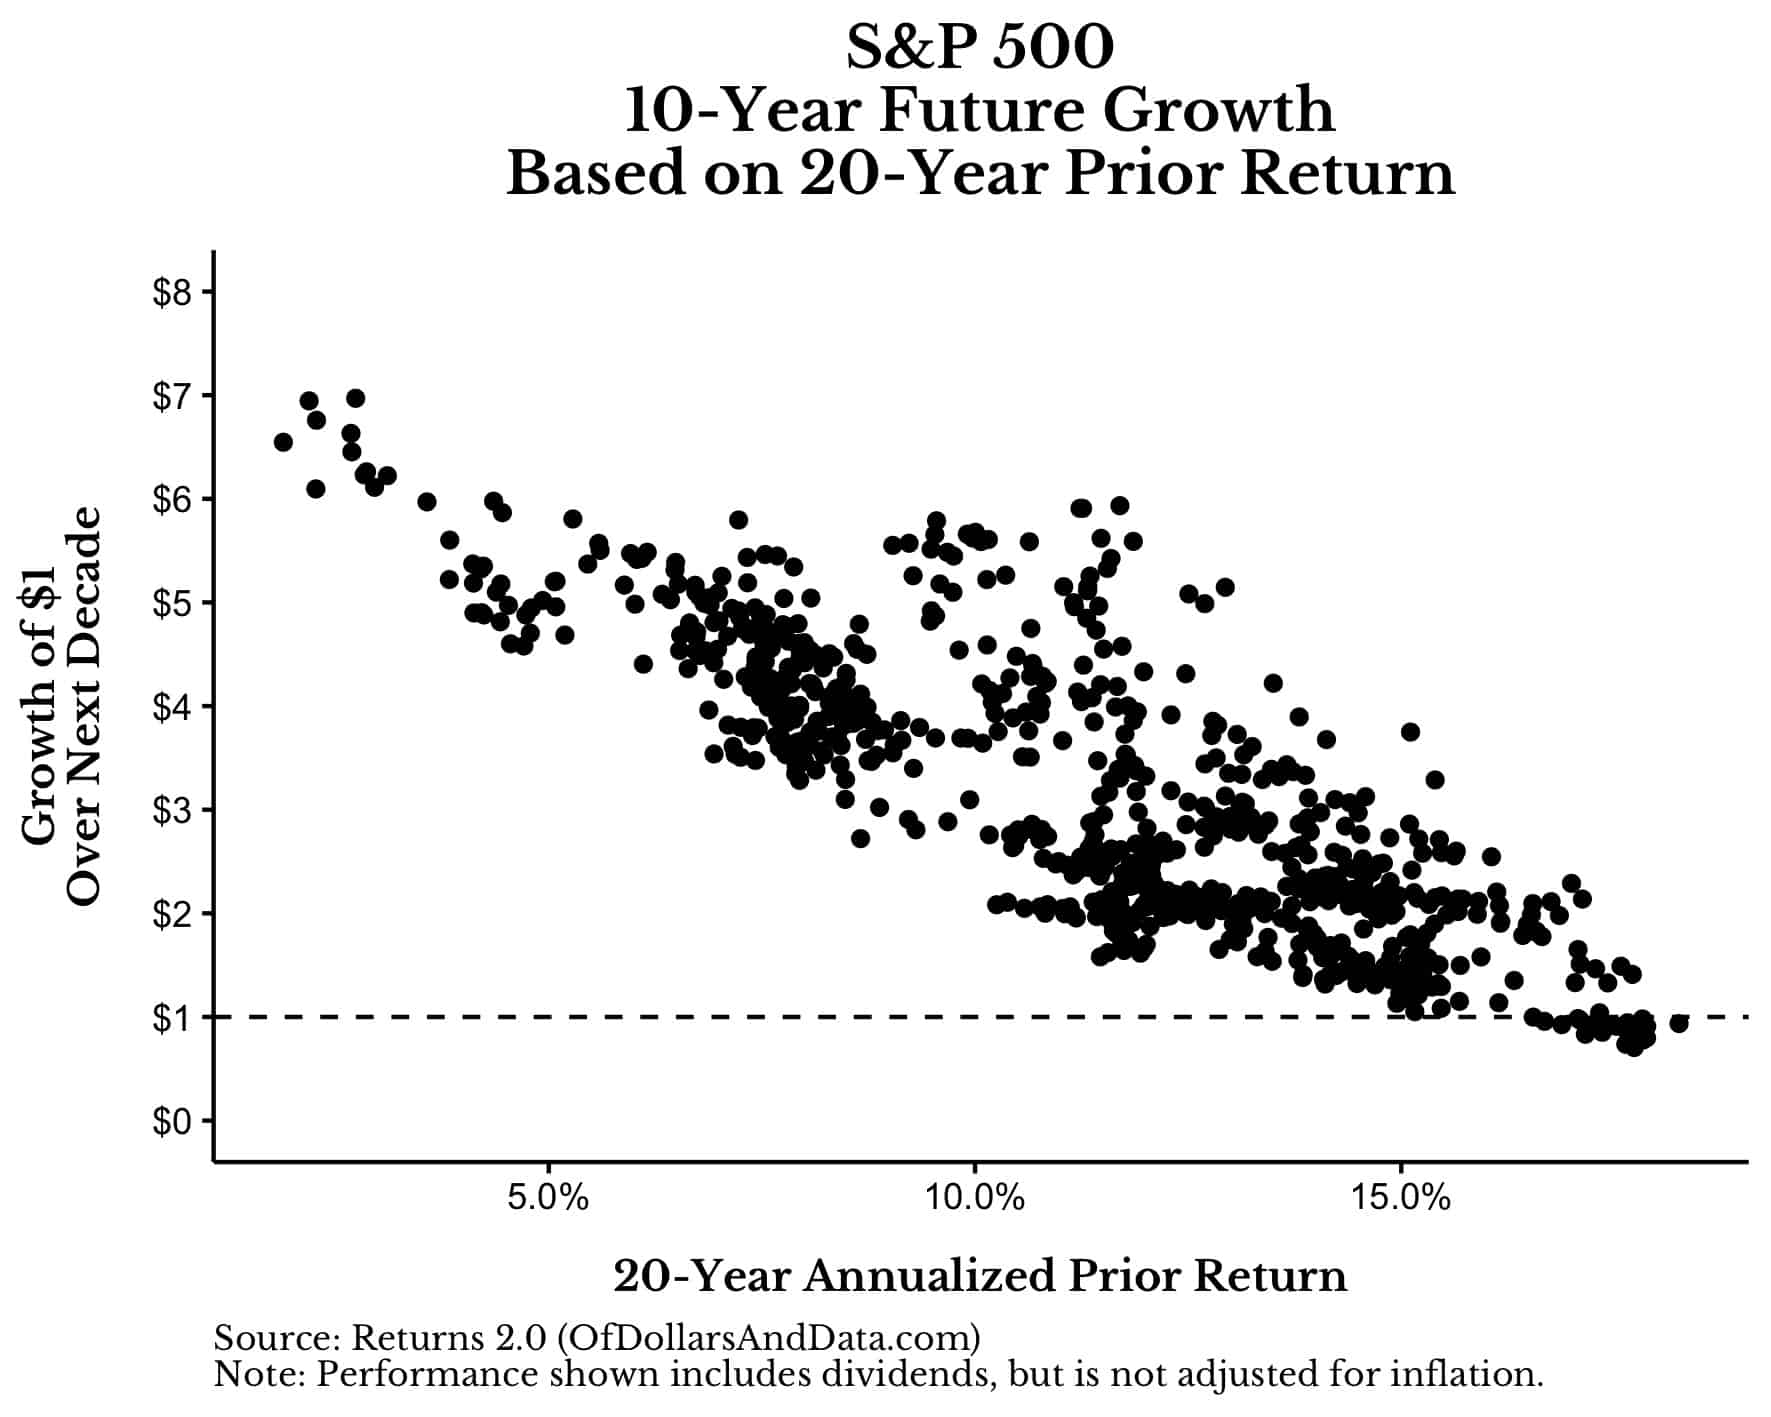
Two years ago I made a prediction that got me laughed out of the room. Before we were ever wearing masks, being socially distant, or discussing web3, I…
Share this:


 And have U.S. stocks been keeping up with my prediction? Yes and then some.
Since I published this data in early 2020, the S&P 500 has increased by 52% (including dividends). This is roughly a 23% annualized return, which is far above the 15% annualized return that was required to get the S&P 500 to 4x by 2030.
So how far does the S&P 500 need to go to reach the 4x prediction I made at the beginning of 2020? 167% over the next 8 years. And how often do U.S. stocks return 167% (or more) over an 8-year period? Going back to 1926 it's about 38% of the time. So there is a roughly 2 in 5 chance that my prediction will come true. I like my odds.
And with the S&P 500 currently at 4,670 and the Dow currently at 36,068, this means that we should see the S&P 500 hit 10,000 and the Dow hit 100,000 before 2030.
I know it might seem crazy to make this prediction after all the madness we have seen in markets over the past year, but, on the other hand, it also makes me wonder: Are we bullish enough?
I don't think we are. If anything the bulls are starting to get a little bearish, myself included. A few weeks ago I wrote a piece about how valuations in the U.S. stock market could not last. I stand by my research, but I now believe that my interpretation of the results (i.e. "don't buy more U.S. stocks") was misguided.
How did I get it wrong? I didn't care to consider the size of these overvalued stocks relative to the rest of the market. The total market capitalization of all the stocks in the Russell 3000 with a P/S ratio > 20 was only $4.5 trillion at the time. That represents just 8.5% of the total market capitalization of the Russell 3000.
So while I believe that the valuations on those U.S. stocks are definitely inflated, how can I then argue to avoid all U.S. stocks as a result? I can't. My bearish sentiment creeped in and I made a mistake.
As a result of this I am starting to believe the opposite—we aren't bullish enough. I know how extreme this sounds after the last decade or so of U.S. stock returns, but what if it's not a market crash we need to worry about but a melt-up? What if the world recovers from Covid in a way that takes markets to a whole new level?
I'm not saying that markets have reached "a permanently high plateau" or that they won't crash ever again. Of course the market will crash again, possibly right after I publish this article. But what if the opposite happens? What if we have exceptional growth over the next decade instead of a long bear market? What if our future is dominated more by abundance than scarcity?
We are already starting to see this today as basic goods and services have become more common throughout the world. The majority of people on Earth now have access to electricity, running water, the internet and much more. This is why I believe we have entered a new age of prosperity. An age of too much rather than not enough.
This transition hasn't just happened with physical goods, but with information as well. As David Perell recently highlighted:
And have U.S. stocks been keeping up with my prediction? Yes and then some.
Since I published this data in early 2020, the S&P 500 has increased by 52% (including dividends). This is roughly a 23% annualized return, which is far above the 15% annualized return that was required to get the S&P 500 to 4x by 2030.
So how far does the S&P 500 need to go to reach the 4x prediction I made at the beginning of 2020? 167% over the next 8 years. And how often do U.S. stocks return 167% (or more) over an 8-year period? Going back to 1926 it's about 38% of the time. So there is a roughly 2 in 5 chance that my prediction will come true. I like my odds.
And with the S&P 500 currently at 4,670 and the Dow currently at 36,068, this means that we should see the S&P 500 hit 10,000 and the Dow hit 100,000 before 2030.
I know it might seem crazy to make this prediction after all the madness we have seen in markets over the past year, but, on the other hand, it also makes me wonder: Are we bullish enough?
I don't think we are. If anything the bulls are starting to get a little bearish, myself included. A few weeks ago I wrote a piece about how valuations in the U.S. stock market could not last. I stand by my research, but I now believe that my interpretation of the results (i.e. "don't buy more U.S. stocks") was misguided.
How did I get it wrong? I didn't care to consider the size of these overvalued stocks relative to the rest of the market. The total market capitalization of all the stocks in the Russell 3000 with a P/S ratio > 20 was only $4.5 trillion at the time. That represents just 8.5% of the total market capitalization of the Russell 3000.
So while I believe that the valuations on those U.S. stocks are definitely inflated, how can I then argue to avoid all U.S. stocks as a result? I can't. My bearish sentiment creeped in and I made a mistake.
As a result of this I am starting to believe the opposite—we aren't bullish enough. I know how extreme this sounds after the last decade or so of U.S. stock returns, but what if it's not a market crash we need to worry about but a melt-up? What if the world recovers from Covid in a way that takes markets to a whole new level?
I'm not saying that markets have reached "a permanently high plateau" or that they won't crash ever again. Of course the market will crash again, possibly right after I publish this article. But what if the opposite happens? What if we have exceptional growth over the next decade instead of a long bear market? What if our future is dominated more by abundance than scarcity?
We are already starting to see this today as basic goods and services have become more common throughout the world. The majority of people on Earth now have access to electricity, running water, the internet and much more. This is why I believe we have entered a new age of prosperity. An age of too much rather than not enough.
This transition hasn't just happened with physical goods, but with information as well. As David Perell recently highlighted:
In a world of information scarcity, you censor people by blocking the flow of information. But in our world of information abundance, you censor people by flooding them with irrelevant ideas and meaningless data.Today our problem isn't having enough information, but having the right information. Something similar can be said about markets and economic growth too. This is why I'm less worried about our ability to create wealth and more worried about how we will divide that wealth once it has been created. It's about resource selection and division, not resource creation. If this is indeed our future, then we should be more concerned with political and social instability rather than a market crash. It's pitchforks we need to care about, not drawdowns. If you are skeptical, I get it. It's seems unfathomable that we could see another big year in the market after experiencing a 28.7% total return in the S&P 500 in 2021. But you could have made the same argument at the start of last year after seeing an 18.4% total return in 2020 (during a global pandemic!) and a 31.5% total return in 2019. But that's why markets are so intriguing. They can surprise us both on the downside and on the upside. So, I ask again, are we bullish enough? Happy investing and thank you for reading! If you liked this post, consider signing up for my newsletter. This is post 276. Any code I have related to this post can be found here with the same numbering: https://github.com/nmaggiulli/of-dollars-and-data
economic growth pandemic sp 500 stocks
Uncategorized
Shipping company files surprise Chapter 7 bankruptcy, liquidation
While demand for trucking has increased, so have costs and competition, which have forced a number of players to close.
Share this:


The U.S. economy is built on trucks.
As a nation we have relatively limited train assets, and while in recent years planes have played an expanded role in moving goods, trucks still represent the backbone of how everything — food, gasoline, commodities, and pretty much anything else — moves around the country.
Related: Fast-food chain closes more stores after Chapter 11 bankruptcy
"Trucks moved 61.1% of the tonnage and 64.9% of the value of these shipments. The average shipment by truck was 63 miles compared to an average of 640 miles by rail," according to the U.S. Bureau of Transportation Statistics 2023 numbers.
But running a trucking company has been tricky because the largest players have economies of scale that smaller operators don't. That puts any trucking company that's not a massive player very sensitive to increases in gas prices or drops in freight rates.
And that in turn has led a number of trucking companies, including Yellow Freight, the third-largest less-than-truckload operator; J.J. & Sons Logistics, Meadow Lark, and Boateng Logistics, to close while freight brokerage Convoy shut down in October.
Aside from Convoy, none of these brands are household names. but with the demand for trucking increasing, every company that goes out of business puts more pressure on those that remain, which contributes to increased prices.
Image source: Shutterstock
Another freight company closes and plans to liquidate
Not every bankruptcy filing explains why a company has gone out of business. In the trucking industry, multiple recent Chapter 7 bankruptcies have been tied to lawsuits that pushed otherwise successful companies into insolvency.
In the case of TBL Logistics, a Virginia-based national freight company, its Feb. 29 bankruptcy filing in U.S. Bankruptcy Court for the Western District of Virginia appears to be death by too much debt.
"In its filing, TBL Logistics listed its assets and liabilities as between $1 million and $10 million. The company stated that it has up to 49 creditors and maintains that no funds will be available for unsecured creditors once it pays administrative fees," Freightwaves reported.
The company's owners, Christopher and Melinda Bradner, did not respond to the website's request for comment.
Before it closed, TBL Logistics specialized in refrigerated and oversized loads. The company described its business on its website.
"TBL Logistics is a non-asset-based third-party logistics freight broker company providing reliable and efficient transportation solutions, management, and storage for businesses of all sizes. With our extensive network of carriers and industry expertise, we streamline the shipping process, ensuring your goods reach their destination safely and on time."
The world has a truck-driver shortage
The covid pandemic forced companies to consider their supply chain in ways they never had to before. Increased demand showed the weakness in the trucking industry and drew attention to how difficult life for truck drivers can be.
That was an issue HBO's John Oliver highlighted on his "Last Week Tonight" show in October 2022. In the episode, the host suggested that the U.S. would basically start to starve if the trucking industry shut down for three days.
"Sorry, three days, every produce department in America would go from a fully stocked market to an all-you-can-eat raccoon buffet," he said. "So it’s no wonder trucking’s a huge industry, with more than 3.5 million people in America working as drivers, from port truckers who bring goods off ships to railyards and warehouses, to long-haul truckers who move them across the country, to 'last-mile' drivers, who take care of local delivery."
The show highlighted how many truck drivers face low pay, difficult working conditions and, in many cases, crushing debt.
"Hundreds of thousands of people become truck drivers every year. But hundreds of thousands also quit. Job turnover for truckers averages over 100%, and at some companies it’s as high as 300%, meaning they’re hiring three people for a single job over the course of a year. And when a field this important has a level of job satisfaction that low, it sure seems like there’s a huge problem," Oliver shared.
The truck-driver shortage is not just a U.S. problem; it's a global issue, according to IRU.org.
"IRU’s 2023 driver shortage report has found that over three million truck driver jobs are unfilled, or 7% of total positions, in 36 countries studied," the global transportation trade association reported.
"With the huge gap between young and old drivers growing, it will get much worse over the next five years without significant action."
Related: Veteran fund manager picks favorite stocks for 2024
bankruptcy bankruptcies pandemic stocks commoditiesUncategorized
Wendy’s has a new deal for daylight savings time haters
The Daylight Savings Time promotion slashes prices on breakfast.
Share this:


Daylight Savings Time, or the practice of advancing clocks an hour in the spring to maximize natural daylight, is a controversial practice because of the way it leaves many feeling off-sync and tired on the second Sunday in March when the change is made and one has one less hour to sleep in.
Despite annual "Abolish Daylight Savings Time" think pieces and online arguments that crop up with unwavering regularity, Daylight Savings in North America begins on March 10 this year.
Related: Coca-Cola has a new soda for Diet Coke fans
Tapping into some people's very vocal dislike of Daylight Savings Time, fast-food chain Wendy's (WEN) is launching a daylight savings promotion that is jokingly designed to make losing an hour of sleep less painful and encourage fans to order breakfast anyway.
Image source: Wendy's.
Promotion wants you to compensate for lost sleep with cheaper breakfast
As it is also meant to drive traffic to the Wendy's app, the promotion allows anyone who makes a purchase of $3 or more through the platform to get a free hot coffee, cold coffee or Frosty Cream Cold Brew.
More Food + Dining:
- Taco Bell menu tries new take on an American classic
- McDonald's menu goes big, brings back fan favorites (with a catch)
- The 10 best food stocks to buy now
Available during the Wendy's breakfast hours of 6 a.m. and 10:30 a.m. (which, naturally, will feel even earlier due to Daylight Savings), the deal also allows customers to buy any of its breakfast sandwiches for $3. Items like the Sausage, Egg and Cheese Biscuit, Breakfast Baconator and Maple Bacon Chicken Croissant normally range in price between $4.50 and $7.
The choice of the latter is quite wide since, in the years following the pandemic, Wendy's has made a concerted effort to expand its breakfast menu with a range of new sandwiches with egg in them and sweet items such as the French Toast Sticks. The goal was both to stand out from competitors with a wider breakfast menu and increase traffic to its stores during early-morning hours.
Wendy's deal comes after controversy over 'dynamic pricing'
But last month, the chain known for the square shape of its burger patties ignited controversy after saying that it wanted to introduce "dynamic pricing" in which the cost of many of the items on its menu will vary depending on the time of day. In an earnings call, chief executive Kirk Tanner said that electronic billboards would allow restaurants to display various deals and promotions during slower times in the early morning and late at night.
Outcry was swift and Wendy's ended up walking back its plans with words that they were "misconstrued" as an intent to surge prices during its most popular periods.
While the company issued a statement saying that any changes were meant as "discounts and value offers" during quiet periods rather than raised prices during busy ones, the reputational damage was already done since many saw the clarification as another way to obfuscate its pricing model.
"We said these menuboards would give us more flexibility to change the display of featured items," Wendy's said in its statement. "This was misconstrued in some media reports as an intent to raise prices when demand is highest at our restaurants."
The Daylight Savings Time promotion, in turn, is also a way to demonstrate the kinds of deals Wendy's wants to promote in its stores without putting up full-sized advertising or posters for what is only relevant for a few days.
Related: Veteran fund manager picks favorite stocks for 2024
stocks pandemicUncategorized
Comments on February Employment Report
The headline jobs number in the February employment report was above expectations; however, December and January payrolls were revised down by 167,000 combined. The participation rate was unchanged, the employment population ratio decreased, and the …
Share this:


Prime (25 to 54 Years Old) Participation
Since the overall participation rate is impacted by both cyclical (recession) and demographic (aging population, younger people staying in school) reasons, here is the employment-population ratio for the key working age group: 25 to 54 years old.
The 25 to 54 years old participation rate increased in February to 83.5% from 83.3% in January, and the 25 to 54 employment population ratio increased to 80.7% from 80.6% the previous month.
Average Hourly Wages
 The graph shows the nominal year-over-year change in "Average Hourly Earnings" for all private employees from the Current Employment Statistics (CES).
 Wage growth has trended down after peaking at 5.9% YoY in March 2022 and was at 4.3% YoY in February.
Part Time for Economic Reasons
 From the BLS report:
"The number of people employed part time for economic reasons, at 4.4 million, changed little in February. These individuals, who would have preferred full-time employment, were working part time because their hours had been reduced or they were unable to find full-time jobs."The number of persons working part time for economic reasons decreased in February to 4.36 million from 4.42 million in February. This is slightly above pre-pandemic levels.
These workers are included in the alternate measure of labor underutilization (U-6) that increased to 7.3% from 7.2% in the previous month. This is down from the record high in April 2020 of 23.0% and up from the lowest level on record (seasonally adjusted) in December 2022 (6.5%). (This series started in 1994). This measure is above the 7.0% level in February 2020 (pre-pandemic).
Unemployed over 26 Weeks
 This graph shows the number of workers unemployed for 27 weeks or more.
 According to the BLS, there are 1.203 million workers who have been unemployed for more than 26 weeks and still want a job, down from 1.277 million the previous month.
This is close to pre-pandemic levels.
Job Streak
| Headline Jobs, Top 10 Streaks | ||
|---|---|---|
| Year Ended | Streak, Months | |
| 1 | 2019 | 100 |
| 2 | 1990 | 48 |
| 3 | 2007 | 46 |
| 4 | 1979 | 45 |
| 5 | 20241 | 38 |
| 6 tie | 1943 | 33 |
| 6 tie | 1986 | 33 |
| 6 tie | 2000 | 33 |
| 9 | 1967 | 29 |
| 10 | 1995 | 25 |
| 1Currrent Streak | ||
Summary:
The headline monthly jobs number was above consensus expectations; however, December and January payrolls were revised down by 167,000 combined. The participation rate was unchanged, the employment population ratio decreased, and the unemployment rate was increased to 3.9%. Another solid report.


Wendy’s has a new deal for daylight savings time haters


Watch Live: President Biden Reminds Americans Just How Good They’ve Got It Thanks To Him


Watch: President Biden Delivers The “Darkest, Most Un-American Speech Given By A President”


People Who Received Ivermectin Were Better Off, Study Finds


Interest rates, the best it gets. It’s time to deploy cash


Is the biotech market rally real? Data suggest comeback in private, public markets


COVID-19 May Lead To Persistent Cognitive Impairment, Brain Fog, And Lower IQ Scores


Europe Is Alarmed Enough To Begin Wargaming A Food Crisis


Wealth Inequality by Age in the Post‑Pandemic Era


Normalise the underlying conditions when “rating” a company’s share price
-

 Uncategorized2 weeks ago
All Of The Elements Are In Place For An Economic Crisis Of Staggering Proportions
-

 Uncategorized1 month ago
Cathie Wood sells a major tech stock (again)
-

 Uncategorized3 weeks ago
California Counties Could Be Forced To Pay $300 Million To Cover COVID-Era Program
-

 Uncategorized2 weeks ago
Apparel Retailer Express Moving Toward Bankruptcy
-

 Uncategorized3 weeks ago
Industrial Production Decreased 0.1% in January
-

 International2 hours ago
Walmart launches clever answer to Target’s new membership program
-

 Government1 month ago
War Delirium
-

 Uncategorized3 weeks ago
RFK Jr: The Wuhan Cover-Up & The Rise Of The Biowarfare-Industrial Complex