Uncategorized
Absorption chillers market: Driven by the growing use of absorption chillers across various industries – Technavio
Absorption chillers market: Driven by the growing use of absorption chillers across various industries – Technavio
PR Newswire
NEW YORK, Feb. 1, 2023
NEW YORK, Feb. 1, 2023 /PRNewswire/ — The absorption chillers market size is forecast to increase…
Share this:

Absorption chillers market: Driven by the growing use of absorption chillers across various industries - Technavio
PR Newswire
NEW YORK, Feb. 1, 2023
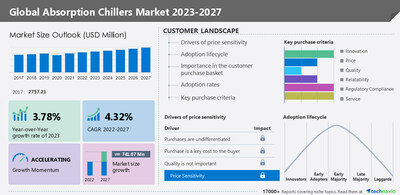
NEW YORK, Feb. 1, 2023 /PRNewswire/ -- The absorption chillers market size is forecast to increase by USD 741.07 million from 2022 to 2027, at a CAGR of 4.32%, according to the recent market study by Technavio. The growth of the market will be driven by the growing use of absorption chillers across various industries, the growing adoption of district heating and cooling infrastructure, and stringent regulations on refrigerant use. Charts & data tables about market and segment sizes for a historic period of five (2017-2021) years have been covered in this report. Download The Sample Report
Technavio has extensively analyzed 15 major vendors, including BROAD Group, Carrier Global Corp., Century Corp., CNIM SA, Daikin Industries Ltd., EAW Energieanlagenbau GmbH, Ebara Corp., Helioclim, Johnson Controls International Plc., Kirloskar Pneumatic Co. Ltd., LG Electronics Inc., Mitsubishi Heavy Industries Ltd., Robur Spa, Shuangliang Eco-Energy Systems Co. Ltd., THE PAR GROUP, Thermax Ltd., Trane Technologies plc, World Energy Co. Ltd., Yazaki Corp., and Berg Chilling Systems Inc.
To get detailed details about the vendor's landscape, buy the report
Key benefits for industry players and stakeholders –
- The report offers information on the criticality of vendor inputs, including R&D, CAPEX, and technology.
- It also provides detailed analyses of the market's competitive landscape and vendors' product offerings.
- The report also provides a qualitative and quantitative analysis of vendors to help clients understand the wider business environment as well as the strengths and weaknesses of key market players. Data is qualitatively analyzed to categorize vendors as pure play, category-focused, industry-focused, and diversified; it is quantitatively analyzed to categorize vendors as dominant, leading, strong, tentative, and weak.
Expand operations in the future - To get requisite details, ask for a custom report.
Customer Landscape - Analysis of price sensitivity, Adoption lifecycle, Customer purchase basket, Adoption rates, and purchase criteria by Technavio
- One of the core components of the customer landscape is price sensitivity, an analysis of which will help companies refine marketing strategies to gain a competitive advantage.
- Another key aspect is price sensitivity drivers (purchases are undifferentiated, the purchase is a key cost to buyers, and quality is not important), which range between LOW and HIGH.
- Furthermore, market adoption rates for all regions have been covered.
Get a holistic overview of the market from industry experts to evaluate and develop growth strategies. Download the Sample
The market is segmented by segment application (industrial and HVAC), type (lithium bromide and ammonia), and geography (APAC, Europe, North America, Middle East and Africa, and South America).
Segmentation by application (Inclusion/Exclusion)
The market growth in the industrial segment will be significant during the forecast period. Industrial Absorption chillers are deployed in the industrial sector to maintain the temperature of process equipment and refrigeration of chemicals, food, beverages, and other materials that need to be maintained at a low temperature. Industries such as plastic, chemical, pharmaceutical, oil and gas, food and beverages, and printing are some of the major industrial consumers that use chillers. These chillers can be directly integrated with the processes and can utilize the waste heat generated by the equipment.
Register for a free trial today and gain instant access to 17,000+ market research reports.
Technavio's SUBSCRIPTION platform
Related Reports:
- The nonwoven filter media market size is expected to accelerate at a CAGR of 6.45% and reach USD 2.40 billion by 2026. The increasing use in HVAC systems is notably driving the nonwoven filter media market growth, although factors such as limitations of nonwoven filter media products in energy applications may impede the market growth.
- The agroscience market size is predicted to surge by USD 24.02 billion from 2021 to 2026 at a CAGR of 11.75%. The shrinking availability of arable land is notably driving the market growth, although factors such as the challenges associated with plant breeding may impede the market growth.
What are the key data covered in this absorption chillers market report?
- CAGR of the market during the forecast period
- Detailed information on factors that will drive the growth of the absorption chillers market between 2023 and 2027
- Precise estimation of the size of the absorption chillers market size and its contribution to the market in focus on the parent market
- Accurate predictions about upcoming trends and changes in consumer behavior
- Growth of the absorption chillers market industry across APAC, Europe, North America, Middle East and Africa, and South America
- A thorough analysis of the market's competitive landscape and detailed information about vendors
- Comprehensive analysis of factors that will challenge the growth of Absorption Chillers Market vendors
Absorption Chillers Market Scope | |
Report Coverage | Details |
Page number | 164 |
Base year | 2022 |
Historic period | 2017-2021 |
Forecast period | 2023-2027 |
Growth momentum & CAGR | Accelerate at a CAGR of 4.32% |
Market growth 2023-2027 | USD 741.07 million |
Market structure | Fragmented |
YoY growth 2022-2023 (%) | 3.78 |
Regional analysis | APAC, Europe, North America, Middle East and Africa, and South America |
Performing market contribution | APAC at 46% |
Key countries | US, China, Japan, Germany, and UK |
Competitive landscape | Leading Vendors, Market Positioning of Vendors, Competitive Strategies, and Industry Risks |
Key companies profiled | BROAD Group, Carrier Global Corp., Century Corp., CNIM SA, Daikin Industries Ltd., EAW Energieanlagenbau GmbH, Ebara Corp., Helioclim, Johnson Controls International Plc., Kirloskar Pneumatic Co. Ltd., LG Electronics Inc., Mitsubishi Heavy Industries Ltd., Robur Spa, Shuangliang Eco-Energy Systems Co. Ltd., THE PAR GROUP, Thermax Ltd., Trane Technologies plc, World Energy Co. Ltd., Yazaki Corp., and Berg Chilling Systems Inc. |
Market dynamics | Parent market analysis, Market growth inducers and obstacles, Fast-growing and slow-growing segment analysis, COVID-19 impact and recovery analysis and future consumer dynamics, and Market condition analysis for the forecast period. |
Customization purview | If our report has not included the data that you are looking for, you can reach out to our analysts and get segments customized. |
Table of contents:
1 Executive Summary
- 1.1 Market overview
- Exhibit 01: Executive Summary – Chart on Market Overview
- Exhibit 02: Executive Summary – Data Table on Market Overview
- Exhibit 03: Executive Summary – Chart on Global Market Characteristics
- Exhibit 04: Executive Summary – Chart on Market by Geography
- Exhibit 05: Executive Summary – Chart on Market Segmentation by Application
- Exhibit 06: Executive Summary – Chart on Market Segmentation by Type
- Exhibit 07: Executive Summary – Chart on Incremental Growth
- Exhibit 08: Executive Summary – Data Table on Incremental Growth
- Exhibit 09: Executive Summary – Chart on Vendor Market Positioning
· 2 Market Landscape
- 2.1 Market ecosystem
- Exhibit 10: Parent market
- Exhibit 11: Market Characteristics
· 3 Market Sizing
- 3.1 Market definition
- Exhibit 12: Offerings of vendors included in the market definition
- 3.2 Market segment analysis
- Exhibit 13: Market segments
- 3.3 Market size 2022
- 3.4 Market outlook: Forecast for 2022-2027
- Exhibit 14: Chart on Global - Market size and forecast 2022-2027 ($ million)
- Exhibit 15: Data Table on Global - Market size and forecast 2022-2027 ($ million)
- Exhibit 16: Chart on Global Market: Year-over-year growth 2022-2027 (%)
- Exhibit 17: Data Table on Global Market: Year-over-year growth 2022-2027 (%)
· 4 Historic Market Size
- 4.1 Global absorption chillers market 2017 - 2021
- Exhibit 18: Historic Market Size – Data Table on Global absorption chillers market 2017 - 2021 ($ million)
- 4.2 Application Segment Analysis 2017 - 2021
- Exhibit 19: Historic Market Size – Application Segment 2017 - 2021 ($ million)
- 4.3 Type Segment Analysis 2017 - 2021
- Exhibit 20: Historic Market Size – Type Segment 2017 - 2021 ($ million)
- 4.4 Geography Segment Analysis 2017 - 2021
- Exhibit 21: Historic Market Size – Geography Segment 2017 - 2021 ($ million)
- 4.5 Country Segment Analysis 2017 - 2021
- Exhibit 22: Historic Market Size – Country Segment 2017 - 2021 ($ million)
· 5 Five Forces Analysis
- 5.1 Five forces summary
- Exhibit 23: Five forces analysis - Comparison between 2022 and 2027
- 5.2 Bargaining power of buyers
- Exhibit 24: Chart on Bargaining power of buyers – Impact of key factors 2022 and 2027
- 5.3 Bargaining power of suppliers
- Exhibit 25: Bargaining power of suppliers – Impact of key factors in 2022 and 2027
- 5.4 Threat of new entrants
- Exhibit 26: Threat of new entrants – Impact of key factors in 2022 and 2027
- 5.5 Threat of substitutes
- Exhibit 27: Threat of substitutes – Impact of key factors in 2022 and 2027
- 5.6 Threat of rivalry
- Exhibit 28: Threat of rivalry – Impact of key factors in 2022 and 2027
- 5.7 Market condition
- Exhibit 29: Chart on Market condition - Five forces 2022 and 2027
· 6 Market Segmentation by Application
- 6.1 Market segments
- Exhibit 30: Chart on Application - Market share 2022-2027 (%)
- Exhibit 31: Data Table on Application - Market share 2022-2027 (%)
- 6.2 Comparison by Application
- Exhibit 32: Chart on Comparison by Application
- Exhibit 33: Data Table on Comparison by Application
- 6.3 Industrial - Market size and forecast 2022-2027
- Exhibit 34: Chart on Industrial - Market size and forecast 2022-2027 ($ million)
- Exhibit 35: Data Table on Industrial - Market size and forecast 2022-2027 ($ million)
- Exhibit 36: Chart on Industrial - Year-over-year growth 2022-2027 (%)
- Exhibit 37: Data Table on Industrial - Year-over-year growth 2022-2027 (%)
- 6.4 HVAC - Market size and forecast 2022-2027
- Exhibit 38: Chart on HVAC - Market size and forecast 2022-2027 ($ million)
- Exhibit 39: Data Table on HVAC - Market size and forecast 2022-2027 ($ million)
- Exhibit 40: Chart on HVAC - Year-over-year growth 2022-2027 (%)
- Exhibit 41: Data Table on HVAC - Year-over-year growth 2022-2027 (%)
- 6.5 Market opportunity by Application
- Exhibit 42: Market opportunity by Application ($ million)
· 7 Market Segmentation by Type
- 7.1 Market segments
- Exhibit 43: Chart on Type - Market share 2022-2027 (%)
- Exhibit 44: Data Table on Type - Market share 2022-2027 (%)
- 7.2 Comparison by Type
- Exhibit 45: Chart on Comparison by Type
- Exhibit 46: Data Table on Comparison by Type
- 7.3 Lithium bromide - Market size and forecast 2022-2027
- Exhibit 47: Chart on Lithium bromide - Market size and forecast 2022-2027 ($ million)
- Exhibit 48: Data Table on Lithium bromide - Market size and forecast 2022-2027 ($ million)
- Exhibit 49: Chart on Lithium bromide - Year-over-year growth 2022-2027 (%)
- Exhibit 50: Data Table on Lithium bromide - Year-over-year growth 2022-2027 (%)
- 7.4 Ammonia - Market size and forecast 2022-2027
- Exhibit 51: Chart on Ammonia - Market size and forecast 2022-2027 ($ million)
- Exhibit 52: Data Table on Ammonia - Market size and forecast 2022-2027 ($ million)
- Exhibit 53: Chart on Ammonia - Year-over-year growth 2022-2027 (%)
- Exhibit 54: Data Table on Ammonia - Year-over-year growth 2022-2027 (%)
- 7.5 Market opportunity by Type
- Exhibit 55: Market opportunity by Type ($ million)
· 8 Customer Landscape
- 8.1 Customer landscape overview
- Exhibit 56: Analysis of price sensitivity, lifecycle, customer purchase basket, adoption rates, and purchase criteria
· 9 Geographic Landscape
- 9.1 Geographic segmentation
- Exhibit 57: Chart on Market share by geography 2022-2027 (%)
- Exhibit 58: Data Table on Market share by geography 2022-2027 (%)
- 9.2 Geographic comparison
- Exhibit 59: Chart on Geographic comparison
- Exhibit 60: Data Table on Geographic comparison
- 9.3 APAC - Market size and forecast 2022-2027
- Exhibit 61: Chart on APAC - Market size and forecast 2022-2027 ($ million)
- Exhibit 62: Data Table on APAC - Market size and forecast 2022-2027 ($ million)
- Exhibit 63: Chart on APAC - Year-over-year growth 2022-2027 (%)
- Exhibit 64: Data Table on APAC - Year-over-year growth 2022-2027 (%)
- 9.4 Europe - Market size and forecast 2022-2027
- Exhibit 65: Chart on Europe - Market size and forecast 2022-2027 ($ million)
- Exhibit 66: Data Table on Europe - Market size and forecast 2022-2027 ($ million)
- Exhibit 67: Chart on Europe - Year-over-year growth 2022-2027 (%)
- Exhibit 68: Data Table on Europe - Year-over-year growth 2022-2027 (%)
- 9.5 North America - Market size and forecast 2022-2027
- Exhibit 69: Chart on North America - Market size and forecast 2022-2027 ($ million)
- Exhibit 70: Data Table on North America - Market size and forecast 2022-2027 ($ million)
- Exhibit 71: Chart on North America - Year-over-year growth 2022-2027 (%)
- Exhibit 72: Data Table on North America - Year-over-year growth 2022-2027 (%)
- 9.6 Middle East and Africa - Market size and forecast 2022-2027
- Exhibit 73: Chart on Middle East and Africa - Market size and forecast 2022-2027 ($ million)
- Exhibit 74: Data Table on Middle East and Africa - Market size and forecast 2022-2027 ($ million)
- Exhibit 75: Chart on Middle East and Africa - Year-over-year growth 2022-2027 (%)
- Exhibit 76: Data Table on Middle East and Africa - Year-over-year growth 2022-2027 (%)
- 9.7 South America - Market size and forecast 2022-2027
- Exhibit 77: Chart on South America - Market size and forecast 2022-2027 ($ million)
- Exhibit 78: Data Table on South America - Market size and forecast 2022-2027 ($ million)
- Exhibit 79: Chart on South America - Year-over-year growth 2022-2027 (%)
- Exhibit 80: Data Table on South America - Year-over-year growth 2022-2027 (%)
- 9.8 US - Market size and forecast 2022-2027
- Exhibit 81: Chart on US - Market size and forecast 2022-2027 ($ million)
- Exhibit 82: Data Table on US - Market size and forecast 2022-2027 ($ million)
- Exhibit 83: Chart on US - Year-over-year growth 2022-2027 (%)
- Exhibit 84: Data Table on US - Year-over-year growth 2022-2027 (%)
- 9.9 China - Market size and forecast 2022-2027
- Exhibit 85: Chart on China - Market size and forecast 2022-2027 ($ million)
- Exhibit 86: Data Table on China - Market size and forecast 2022-2027 ($ million)
- Exhibit 87: Chart on China - Year-over-year growth 2022-2027 (%)
- Exhibit 88: Data Table on China - Year-over-year growth 2022-2027 (%)
- 9.10 Japan - Market size and forecast 2022-2027
- Exhibit 89: Chart on Japan - Market size and forecast 2022-2027 ($ million)
- Exhibit 90: Data Table on Japan - Market size and forecast 2022-2027 ($ million)
- Exhibit 91: Chart on Japan - Year-over-year growth 2022-2027 (%)
- Exhibit 92: Data Table on Japan - Year-over-year growth 2022-2027 (%)
- 9.11 Germany - Market size and forecast 2022-2027
- Exhibit 93: Chart on Germany - Market size and forecast 2022-2027 ($ million)
- Exhibit 94: Data Table on Germany - Market size and forecast 2022-2027 ($ million)
- Exhibit 95: Chart on Germany - Year-over-year growth 2022-2027 (%)
- Exhibit 96: Data Table on Germany - Year-over-year growth 2022-2027 (%)
- 9.12 UK - Market size and forecast 2022-2027
- Exhibit 97: Chart on UK - Market size and forecast 2022-2027 ($ million)
- Exhibit 98: Data Table on UK - Market size and forecast 2022-2027 ($ million)
- Exhibit 99: Chart on UK - Year-over-year growth 2022-2027 (%)
- Exhibit 100: Data Table on UK - Year-over-year growth 2022-2027 (%)
- 9.13 Market opportunity by geography
- Exhibit 101: Market opportunity by geography ($ million)
· 10 Drivers, Challenges, and Trends
- 10.1 Market drivers
- 10.2 Market challenges
- 10.3 Impact of drivers and challenges
- Exhibit 102: Impact of drivers and challenges in 2022 and 2027
- 10.4 Market trends
· 11 Vendor Landscape
- 11.1 Overview
- 11.2 Vendor landscape
- Exhibit 103: Overview on Criticality of inputs and Factors of differentiation
- 11.3 Landscape disruption
- Exhibit 104: Overview on factors of disruption
- 11.4 Industry risks
- Exhibit 105: Impact of key risks on business
· 12 Vendor Analysis
- 12.1 Vendors covered
- Exhibit 106: Vendors covered
- 12.2 Market positioning of vendors
- Exhibit 107: Matrix on vendor position and classification
- 12.3 BROAD Group
- Exhibit 108: BROAD Group - Overview
- Exhibit 109: BROAD Group - Product / Service
- Exhibit 110: BROAD Group - Key offerings
- 12.4 Carrier Global Corp.
- Exhibit 111: Carrier Global Corp. - Overview
- Exhibit 112: Carrier Global Corp. - Business segments
- Exhibit 113: Carrier Global Corp. - Key news
- Exhibit 114: Carrier Global Corp. - Key offerings
- Exhibit 115: Carrier Global Corp. - Segment focus
- 12.5 Century Corp.
- Exhibit 116: Century Corp. - Overview
- Exhibit 117: Century Corp. - Product / Service
- Exhibit 118: Century Corp. - Key offerings
- 12.6 Daikin Industries Ltd.
- Exhibit 119: Daikin Industries Ltd. - Overview
- Exhibit 120: Daikin Industries Ltd. - Business segments
- Exhibit 121: Daikin Industries Ltd. - Key news
- Exhibit 122: Daikin Industries Ltd. - Key offerings
- Exhibit 123: Daikin Industries Ltd. - Segment focus
- 12.7 EAW Energieanlagenbau GmbH
- Exhibit 124: EAW Energieanlagenbau GmbH - Overview
- Exhibit 125: EAW Energieanlagenbau GmbH - Product / Service
- Exhibit 126: EAW Energieanlagenbau GmbH - Key offerings
- 12.8 Ebara Corp.
- Exhibit 127: Ebara Corp. - Overview
- Exhibit 128: Ebara Corp. - Business segments
- Exhibit 129: Ebara Corp. - Key offerings
- Exhibit 130: Ebara Corp. - Segment focus
- 12.9 Helioclim
- Exhibit 131: Helioclim - Overview
- Exhibit 132: Helioclim - Product / Service
- Exhibit 133: Helioclim - Key offerings
- 12.10 Johnson Controls International Plc.
- Exhibit 134: Johnson Controls International Plc. - Overview
- Exhibit 135: Johnson Controls International Plc. - Business segments
- Exhibit 136: Johnson Controls International Plc. - Key news
- Exhibit 137: Johnson Controls International Plc. - Key offerings
- Exhibit 138: Johnson Controls International Plc. - Segment focus
- 12.11 Kirloskar Pneumatic Co. Ltd.
- Exhibit 139: Kirloskar Pneumatic Co. Ltd. - Overview
- Exhibit 140: Kirloskar Pneumatic Co. Ltd. - Business segments
- Exhibit 141: Kirloskar Pneumatic Co. Ltd. - Key offerings
- Exhibit 142: Kirloskar Pneumatic Co. Ltd. - Segment focus
- 12.12 LG Electronics Inc.
- Exhibit 143: LG Electronics Inc. - Overview
- Exhibit 144: LG Electronics Inc. - Business segments
- Exhibit 145: LG Electronics Inc. - Key news
- Exhibit 146: LG Electronics Inc. - Key offerings
- Exhibit 147: LG Electronics Inc. - Segment focus
- 12.13 Mitsubishi Heavy Industries Ltd.
- Exhibit 148: Mitsubishi Heavy Industries Ltd. - Overview
- Exhibit 149: Mitsubishi Heavy Industries Ltd. - Business segments
- Exhibit 150: Mitsubishi Heavy Industries Ltd. - Key news
- Exhibit 151: Mitsubishi Heavy Industries Ltd. - Key offerings
- Exhibit 152: Mitsubishi Heavy Industries Ltd. - Segment focus
- 12.14 Thermax Ltd.
- Exhibit 153: Thermax Ltd. - Overview
- Exhibit 154: Thermax Ltd. - Business segments
- Exhibit 155: Thermax Ltd. - Key news
- Exhibit 156: Thermax Ltd. - Key offerings
- Exhibit 157: Thermax Ltd. - Segment focus
- 12.15 Trane Technologies plc
- Exhibit 158: Trane Technologies plc - Overview
- Exhibit 159: Trane Technologies plc - Business segments
- Exhibit 160: Trane Technologies plc - Key offerings
- Exhibit 161: Trane Technologies plc - Segment focus
- 12.16 World Energy Co. Ltd.
- Exhibit 162: World Energy Co. Ltd. - Overview
- Exhibit 163: World Energy Co. Ltd. - Product / Service
- Exhibit 164: World Energy Co. Ltd. - Key offerings
- 12.17 Yazaki Corp.
- Exhibit 165: Yazaki Corp. - Overview
- Exhibit 166: Yazaki Corp. - Product / Service
- Exhibit 167: Yazaki Corp. - Key offerings
· 13 Appendix
- 13.1 Scope of the report
- 13.2 Inclusions and exclusions checklist
- Exhibit 168: Inclusions checklist
- Exhibit 169: Exclusions checklist
- 13.3 Currency conversion rates for US$
- Exhibit 170: Currency conversion rates for US$
- 13.4 Research methodology
- Exhibit 171: Research methodology
- Exhibit 172: Validation techniques employed for market sizing
- Exhibit 173: Information sources
- 13.5 List of abbreviations
- Exhibit 174: List of abbreviations
About Us
Technavio is a leading global technology research and advisory company. Their research and analysis focuses on emerging market trends and provides actionable insights to help businesses identify market opportunities and develop effective strategies to optimize their market positions. With over 500 specialized analysts, Technavio's report library consists of more than 17,000 reports and counting, covering 800 technologies, spanning across 50 countries. Their client base consists of enterprises of all sizes, including more than 100 Fortune 500 companies. This growing client base relies on Technavio's comprehensive coverage, extensive research, and actionable market insights to identify opportunities in existing and potential markets and assess their competitive positions within changing market scenarios.
Contact
Technavio Research
Jesse Maida
Media & Marketing Executive
US: +1 844 364 1100
UK: +44 203 893 3200
Email: media@technavio.com
Website: www.technavio.com/

View original content to download multimedia:https://www.prnewswire.com/news-releases/absorption-chillers-market-driven-by-the-growing-use-of-absorption-chillers-across-various-industries---technavio-301734399.html
SOURCE Technavio
Uncategorized
Bougie Broke The Financial Reality Behind The Facade
Social media users claiming to be Bougie Broke share pictures of their fancy cars, high-fashion clothing, and selfies in exotic locations and expensive…
Share this:


Social media users claiming to be Bougie Broke share pictures of their fancy cars, high-fashion clothing, and selfies in exotic locations and expensive restaurants. Yet they complain about living paycheck to paycheck and lacking the means to support their lifestyle.
Bougie broke is like “keeping up with the Joneses,” spending beyond one’s means to impress others.
Bougie Broke gives us a glimpse into the financial condition of a growing number of consumers. Since personal consumption represents about two-thirds of economic activity, it’s worth diving into the Bougie Broke fad to appreciate if a large subset of the population can continue to consume at current rates.
The Wealth Divide Disclaimer
Forecasting personal consumption is always tricky, but it has become even more challenging in the post-pandemic era. To appreciate why we share a joke told by Mike Green.
Bill Gates and I walk into the bar…
Bartender: “Wow… a couple of billionaires on average!”
Bill Gates, Jeff Bezos, Elon Musk, Mark Zuckerberg, and other billionaires make us all much richer, on average. Unfortunately, we can’t use the average to pay our bills.
According to Wikipedia, Bill Gates is one of 756 billionaires living in the United States. Many of these billionaires became much wealthier due to the pandemic as their investment fortunes proliferated.
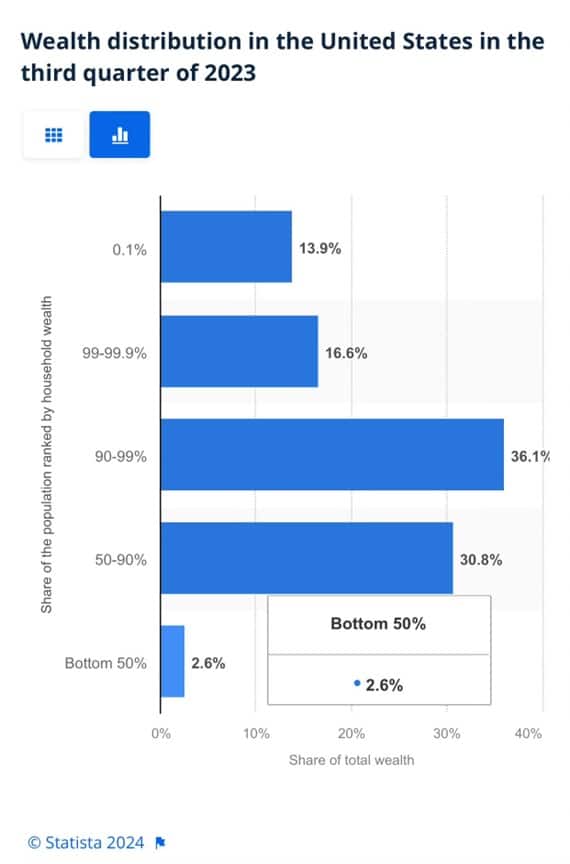
To appreciate the wealth divide, consider the graph below courtesy of Statista. 1% of the U.S. population holds 30% of the wealth. The wealthiest 10% of households have two-thirds of the wealth. The bottom half of the population accounts for less than 3% of the wealth.
The uber-wealthy grossly distorts consumption and savings data. And, with the sharp increase in their wealth over the past few years, the consumption and savings data are more distorted.
Furthermore, and critical to appreciate, the spending by the wealthy doesn’t fluctuate with the economy. Therefore, the spending of the lower wealth classes drives marginal changes in consumption. As such, the condition of the not-so-wealthy is most important for forecasting changes in consumption.
Revenge Spending
Deciphering personal data has also become more difficult because our spending habits have changed due to the pandemic.
A great example is revenge spending. Per the New York Times:
Ola Majekodunmi, the founder of All Things Money, a finance site for young adults, explained revenge spending as expenditures meant to make up for “lost time” after an event like the pandemic.
So, between the growing wealth divide and irregular spending habits, let’s quantify personal savings, debt usage, and real wages to appreciate better if Bougie Broke is a mass movement or a silly meme.
The Means To Consume
Savings, debt, and wages are the three primary sources that give consumers the ability to consume.
Savings
The graph below shows the rollercoaster on which personal savings have been since the pandemic. The savings rate is hovering at the lowest rate since those seen before the 2008 recession. The total amount of personal savings is back to 2017 levels. But, on an inflation-adjusted basis, it’s at 10-year lows. On average, most consumers are drawing down their savings or less. Given that wages are increasing and unemployment is historically low, they must be consuming more.
Now, strip out the savings of the uber-wealthy, and it’s probable that the amount of personal savings for much of the population is negligible. A survey by Payroll.org estimates that 78% of Americans live paycheck to paycheck.

More on Insufficient Savings
The Fed’s latest, albeit old, Report on the Economic Well-Being of U.S. Households from June 2023 claims that over a third of households do not have enough savings to cover an unexpected $400 expense. We venture to guess that number has grown since then. To wit, the number of households with essentially no savings rose 5% from their prior report a year earlier.
Relatively small, unexpected expenses, such as a car repair or a modest medical bill, can be a hardship for many families. When faced with a hypothetical expense of $400, 63 percent of all adults in 2022 said they would have covered it exclusively using cash, savings, or a credit card paid off at the next statement (referred to, altogether, as “cash or its equivalent”). The remainder said they would have paid by borrowing or selling something or said they would not have been able to cover the expense.
Debt
After periods where consumers drained their existing savings and/or devoted less of their paychecks to savings, they either slowed their consumption patterns or borrowed to keep them up. Currently, it seems like many are choosing the latter option. Consumer borrowing is accelerating at a quicker pace than it was before the pandemic.
The first graph below shows outstanding credit card debt fell during the pandemic as the economy cratered. However, after multiple stimulus checks and broad-based economic recovery, consumer confidence rose, and with it, credit card balances surged.
The current trend is steeper than the pre-pandemic trend. Some may be a catch-up, but the current rate is unsustainable. Consequently, borrowing will likely slow down to its pre-pandemic trend or even below it as consumers deal with higher credit card balances and 20+% interest rates on the debt.

The second graph shows that since 2022, credit card balances have grown faster than our incomes. Like the first graph, the credit usage versus income trend is unsustainable, especially with current interest rates.

With many consumers maxing out their credit cards, is it any wonder buy-now-pay-later loans (BNPL) are increasing rapidly?
Insider Intelligence believes that 79 million Americans, or a quarter of those over 18 years old, use BNPL. Lending Tree claims that “nearly 1 in 3 consumers (31%) say they’re at least considering using a buy now, pay later (BNPL) loan this month.”More telling, according to their survey, only 52% of those asked are confident they can pay off their BNPL loan without missing a payment!
Wage Growth
Wages have been growing above trend since the pandemic. Since 2022, the average annual growth in compensation has been 6.28%. Higher incomes support more consumption, but higher prices reduce the amount of goods or services one can buy. Over the same period, real compensation has grown by less than half a percent annually. The average real compensation growth was 2.30% during the three years before the pandemic.
In other words, compensation is just keeping up with inflation instead of outpacing it and providing consumers with the ability to consume, save, or pay down debt.
It’s All About Employment
The unemployment rate is 3.9%, up slightly from recent lows but still among the lowest rates in the last seventy-five years.

The uptick in credit card usage, decline in savings, and the savings rate argue that consumers are slowly running out of room to keep consuming at their current pace.
However, the most significant means by which we consume is income. If the unemployment rate stays low, consumption may moderate. But, if the recent uptick in unemployment continues, a recession is extremely likely, as we have seen every time it turned higher.
It’s not just those losing jobs that consume less. Of greater impact is a loss of confidence by those employed when they see friends or neighbors being laid off.
Accordingly, the labor market is probably the most important leading indicator of consumption and of the ability of the Bougie Broke to continue to be Bougie instead of flat-out broke!
Summary
There are always consumers living above their means. This is often harmless until their means decline or disappear. The Bougie Broke meme and the ability social media gives consumers to flaunt their “wealth” is a new medium for an age-old message.
Diving into the data, it argues that consumption will likely slow in the coming months. Such would allow some consumers to save and whittle down their debt. That situation would be healthy and unlikely to cause a recession.
The potential for the unemployment rate to continue higher is of much greater concern. The combination of a higher unemployment rate and strapped consumers could accentuate a recession.
The post Bougie Broke The Financial Reality Behind The Facade appeared first on RIA.
recession unemployment pandemic economic recovery stimulus fed recession recovery interest rates unemployment stimulusUncategorized
Bitcoin on Wheels: The Story of Bitcoinetas
Meet the Bitcoinetas, a fleet of transformative vehicles on a mission to spread the bitcoin message everywhere they go. From Argentina to South Africa,…
Share this:


You may have seen that picture of Michael Saylor in a bitcoin-branded van, with a cheerful guy right next to the car door. This one:
That car is the Bitcoineta European Edition, and the cheerful guy is Ariel Aguilar. Ariel is part of the European Bitcoineta team, and has previously driven another similar car in Argentina. In fact, there are currently five cars around the world that carry the name Bitcoineta (in some cases preceded with the Spanish definite article “La”).
Argentina: the original La Bitcoineta
The story of Bitcoinetas begins with the birth of 'La Bitcoineta' in Argentina, back in 2017. Inspired by the vibrancy of the South American Bitcoin community, the original Bitcoineta was conceived after an annual Latin American Conference (Labitconf), where the visionaries behind it recognized a unique opportunity to promote Bitcoin education in remote areas. Armed with a bright orange Bitcoin-themed exterior and a mission to bridge the gap in financial literacy, La Bitcoineta embarked on a journey to bring awareness of Bitcoin's potential benefits to villages and towns that often remained untouched by mainstream financial education initiatives. Operated by a team of dedicated volunteers, it was more than just a car; it was a symbol of hope and empowerment for those living on the fringes of financial inclusion.

Ariel was part of that initial Argentinian Bitcoineta team, and spent weeks on the road when the car became a reality. The original dream to bring bitcoin education even to remote areas within Argentina and other South American countries came true, and the La Bitcoineta team took part in dozens of local bitcoin meetups in the subsequent years.

One major hiccup came in late 2018, when the car was crashed into while parked in Puerto Madryn. The car was pretty much destroyed, but since the team was possessed by a honey badger spirit, nothing could stop them from keeping true to their mission. It is a testament to the determination and resilience of the Argentinian team that the car was quickly restored and returned on its orange-pilling quest soon after.

Over the more than 5 years that the Argentinian Bitcoineta has been running, it has traveled more than 80,000 kilometers - and as we’ll see further, it inspired multiple similar initiatives around the world.
Follow La Bitcoineta’s journey:
Twitter: https://twitter.com/labitcoineta
Instagram: https://www.instagram.com/bitcoineta/
El Salvador: Bitcoin Beach
In early 2021, the president of El Salvador passed the Bitcoin Law, making bitcoin legal tender in the country. The Labitconf team decided to celebrate this major step forward in bitcoin adoption by hosting the annual conference in San Salvador, the capital city of El Salvador. And correspondingly, the Argentinian Bitcoineta team made plans for a bold 7000-kilometer road trip to visit the Bitcoin country with the iconic Bitcoin car.
However, it proved to be impossible to cross so many borders separating Argentina and Salvador, since many governments were still imposing travel restrictions due to a Covid pandemic. So two weeks before the November event, the Labitconf team decided to fund a second Bitcoineta directly in El Salvador, as part of the Bitcoin Beach circular economy. Thus the second Bitcoineta was born.

The eye-catching Volkswagen minibus has been donated to the Bitcoin Beach team, which uses the car for the needs of its circular economy based in El Zonte.
Follow Bitcoin Beach:
Twitter: https://twitter.com/Bitcoinbeach
South Africa: Bitcoin Ekasi
Late 2021 saw one other major development in terms of grassroots bitcoin adoption. On the other side of the planet, in South Africa, Hermann Vivier initiated the Bitcoin Ekasi project. “Ekasi” is a colloquial term for a township, and a township in the South African context is an underdeveloped urban area with a predominantly black population, a remnant of the segregationist apartheid regime. Bitcoin Ekasi emerged as an attempt to introduce bitcoin into the economy of the JCC Camp township located in Mossel Bay, and has gained a lot of success on that front.
Bitcoin Ekasi was in large part inspired by the success of the Bitcoin Beach circular economy back in El Salvador, and the respect was mutual. The Bitcoin Beach team thus decided to pass on the favor they received from the Argentinian Bitcoineta team, and provided funds to Bitcoin Ekasi for them to build a Bitcoineta of their own.


Bitcoin Ekasi emerged as a sister organization of Surfer Kids, a non-profit organization with a mission to empower marginalized youths through surfing. The Ekasi Bitcoineta thus partially serves as a means to get the kids to visit various surfer competitions in South Africa. A major highlight in this regard was when the kids got to meet Jordy Smith, one of the most successful South African surfers worldwide.
Coincidentally, South African surfers present an intriguing demographic for understanding Bitcoin due to their unique circumstances and needs. To make it as a professional surfer, the athletes need to attend competitions abroad; but since South Africa has tight currency controls in place, it is often a headache to send money abroad for travel and competition expenses. The borderless nature of Bitcoin offers a solution to these constraints, providing surfers with an alternative means of moving funds across borders without any obstacles.

Photo taken at the South African Junior Surfing Championships 2023. Back row, left to right:
Mbasa, Chuma, Jordy Smith, Sandiso. Front, left to right: Owethu, Sibulele.
To find out more about Bitcoineta South Africa and the non-profit endeavors it serves, watch Lekker Feeling, a documentary by Aubrey Strobel:
Follow Bitcoin Ekasi:
Twitter: https://twitter.com/BitcoinEkasi
Fundraiser: https://support.bitcoinekasi.com/
Europe: Bitcoineta Europa
The European Bitcoineta started its journey in early 2023, with Ariel Aguilar being one of the main catalysts behind the idea. Unlike its predecessors in El Salvador and South Africa, the European Bitcoineta was not funded by a previous team but instead secured support from individual donors, reflecting a grassroots approach to spreading financial literacy.

The European Bitcoineta is a Mercedes box van adorned with a prominent Bitcoin logo and inspiring messages, and serves as a mobile hub for education and discussion at numerous European Bitcoin conferences and local meetups. Inside its spacious interior, both notable bitcoiners and bitcoin plebs share their insights on the walls, fostering a sense of camaraderie and collaboration.


Follow Bitcoineta Europa’s journey:
Twitter: https://twitter.com/BitcoinetaEU
Instagram: https://www.instagram.com/bitcoinetaeu/
Ghana: Bitcoineta West Africa
Embed: https://youtu.be/8oWgIU17aIY?si=hrsKmMIA7lI6jX4k
Introduced in December 2023 at the Africa Bitcoin Conference in Ghana, the fifth Bitcoineta was donated to the Ghanaian Bitcoin Cowries educational initiative as part of the Trezor Academy program.

Bitcoineta West Africa was funded by the proceeds from the bitcoin-only limited edition Trezor device, which was sold out within one day of its launch at the Bitcoin Amsterdam conference.
With plans for an extensive tour spanning Ghana, Togo, Benin, Nigeria, and potentially other countries within the ECOWAS political and economic union, Bitcoineta West Africa embodies the spirit of collaboration and solidarity in driving Bitcoin adoption and financial inclusion throughout the Global South.

Follow Bitcoineta West Africa’s journey:
Twitter: https://twitter.com/BitcoinetaWA
Instagram: https://www.instagram.com/bitcoinetawa/
—
All the Bitcoineta cars around the world share one overarching mission: to empower their local communities through bitcoin education, and thus improve the lives of common people that might have a strong need for bitcoin without being currently aware of such need. As they continue to traverse borders and break down barriers, Bitcoinetas serve as a reminder of the power of grassroots initiatives and the importance of financial education in shaping a more inclusive future. The tradition of Bitcoinetas will continue to flourish, and in the years to come we will hopefully encounter a brazenly decorated bitcoin car everywhere we go.
If the inspiring stories of Bitcoinetas have ignited a passion within you to make a difference in your community, we encourage you to take action! Reach out to one of the existing Bitcoineta teams for guidance, support, and inspiration on how to start your own initiative. Whether you're interested in spreading Bitcoin education, promoting financial literacy, or fostering empowerment in underserved areas, the Bitcoineta community is here to help you every step of the way. Together, we will orange pill the world!
This is a guest post by Josef Tetek. Opinions expressed are entirely their own and do not necessarily reflect those of BTC Inc or Bitcoin Magazine.
bitcoin btc pandemicUncategorized
Digital Currency And Gold As Speculative Warnings
Over the last few years, digital currencies and gold have become decent barometers of speculative investor appetite. Such isn’t surprising given the evolution…
Share this:


Over the last few years, digital currencies and gold have become decent barometers of speculative investor appetite. Such isn’t surprising given the evolution of the market into a “casino” following the pandemic, where retail traders have increased their speculative appetites.
“Such is unsurprising, given that retail investors often fall victim to the psychological behavior of the “fear of missing out.” The chart below shows the “dumb money index” versus the S&P 500. Once again, retail investors are very long equities relative to the institutional players ascribed to being the “smart money.””
“The difference between “smart” and “dumb money” investors shows that, more often than not, the “dumb money” invests near market tops and sells near market bottoms.”

That enthusiasm has increased sharply since last November as stocks surged in hopes that the Federal Reserve would cut interest rates. As noted by Sentiment Trader:
“Over the past 18 weeks, the straight-up rally has moved us to an interesting juncture in the Sentiment Cycle. For the past few weeks, the S&P 500 has demonstrated a high positive correlation to the ‘Enthusiasm’ part of the cycle and a highly negative correlation to the ‘Panic’ phase.”

That frenzy to chase the markets, driven by the psychological bias of the “fear of missing out,” has permeated the entirety of the market. As noted in “This Is Nuts:”
“Since then, the entire market has surged higher following last week’s earnings report from Nvidia (NVDA). The reason I say “this is nuts” is the assumption that all companies were going to grow earnings and revenue at Nvidia’s rate. There is little doubt about Nvidia’s earnings and revenue growth rates. However, to maintain that growth pace indefinitely, particularly at 32x price-to-sales, means others like AMD and Intel must lose market share.”

Of course, it is not just a speculative frenzy in the markets for stocks, specifically anything related to “artificial intelligence,” but that exuberance has spilled over into gold and cryptocurrencies.
Birds Of A Feather
There are a couple of ways to measure exuberance in the assets. While sentiment measures examine the broad market, technical indicators can reflect exuberance on individual asset levels. However, before we get to our charts, we need a brief explanation of statistics, specifically, standard deviation.
As I discussed in “Revisiting Bob Farrell’s 10 Investing Rules”:
“Like a rubber band that has been stretched too far – it must be relaxed in order to be stretched again. This is exactly the same for stock prices that are anchored to their moving averages. Trends that get overextended in one direction, or another, always return to their long-term average. Even during a strong uptrend or strong downtrend, prices often move back (revert) to a long-term moving average.”
The idea of “stretching the rubber band” can be measured in several ways, but I will limit our discussion this week to Standard Deviation and measuring deviation with “Bollinger Bands.”
“Standard Deviation” is defined as:
“A measure of the dispersion of a set of data from its mean. The more spread apart the data, the higher the deviation. Standard deviation is calculated as the square root of the variance.”
In plain English, this means that the further away from the average that an event occurs, the more unlikely it becomes. As shown below, out of 1000 occurrences, only three will fall outside the area of 3 standard deviations. 95.4% of the time, events will occur within two standard deviations.

A second measure of “exuberance” is “relative strength.”
“In technical analysis, the relative strength index (RSI) is a momentum indicator that measures the magnitude of recent price changes to evaluate overbought or oversold conditions in the price of a stock or other asset. The RSI is displayed as an oscillator (a line graph that moves between two extremes) and can read from 0 to 100.
Traditional interpretation and usage of the RSI are that values of 70 or above indicate that a security is becoming overbought or overvalued and may be primed for a trend reversal or corrective pullback in price. An RSI reading of 30 or below indicates an oversold or undervalued condition.” – Investopedia
With those two measures, let’s look at Nvidia (NVDA), the poster child of speculative momentum trading in the markets. Nvidia trades more than 3 standard deviations above its moving average, and its RSI is 81. The last time this occurred was in July of 2023 when Nvidia consolidated and corrected prices through November.

Interestingly, gold also trades well into 3 standard deviation territory with an RSI reading of 75. Given that gold is supposed to be a “safe haven” or “risk off” asset, it is instead getting swept up in the current market exuberance.

The same is seen with digital currencies. Given the recent approval of spot, Bitcoin exchange-traded funds (ETFs), the panic bid to buy Bitcoin has pushed the price well into 3 standard deviation territory with an RSI of 73.

In other words, the stock market frenzy to “buy anything that is going up” has spread from just a handful of stocks related to artificial intelligence to gold and digital currencies.
It’s All Relative
We can see the correlation between stock market exuberance and gold and digital currency, which has risen since 2015 but accelerated following the post-pandemic, stimulus-fueled market frenzy. Since the market, gold and cryptocurrencies, or Bitcoin for our purposes, have disparate prices, we have rebased the performance to 100 in 2015.
Gold was supposed to be an inflation hedge. Yet, in 2022, gold prices fell as the market declined and inflation surged to 9%. However, as inflation has fallen and the stock market surged, so has gold. Notably, since 2015, gold and the market have moved in a more correlated pattern, which has reduced the hedging effect of gold in portfolios. In other words, during the subsequent market decline, gold will likely track stocks lower, failing to provide its “wealth preservation” status for investors.

The same goes for cryptocurrencies. Bitcoin is substantially more volatile than gold and tends to ebb and flow with the overall market. As sentiment surges in the S&P 500, Bitcoin and other cryptocurrencies follow suit as speculative appetites increase. Unfortunately, for individuals once again piling into Bitcoin to chase rising prices, if, or when, the market corrects, the decline in cryptocurrencies will likely substantially outpace the decline in market-based equities. This is particularly the case as Wall Street can now short the spot-Bitcoin ETFs, creating additional selling pressure on Bitcoin.

Just for added measure, here is Bitcoin versus gold.

Not A Recommendation
There are many narratives surrounding the markets, digital currency, and gold. However, in today’s market, more than in previous years, all assets are getting swept up into the investor-feeding frenzy.
Sure, this time could be different. I am only making an observation and not an investment recommendation.
However, from a portfolio management perspective, it will likely pay to remain attentive to the correlated risk between asset classes. If some event causes a reversal in bullish exuberance, cash and bonds may be the only place to hide.
The post Digital Currency And Gold As Speculative Warnings appeared first on RIA.
bonds pandemic sp 500 equities stocks bitcoin currencies gold

Digital Currency And Gold As Speculative Warnings


Bougie Broke The Financial Reality Behind The Facade


NY Fed Finds Medium, Long-Term Inflation Expectations Jump Amid Surge In Stock Market Optimism


Aging at AACR Annual Meeting 2024


Bitcoin on Wheels: The Story of Bitcoinetas
-

 Uncategorized3 weeks ago
All Of The Elements Are In Place For An Economic Crisis Of Staggering Proportions
-

 International5 days ago
EyePoint poaches medical chief from Apellis; Sandoz CFO, longtime BioNTech exec to retire
-

 Uncategorized4 weeks ago
California Counties Could Be Forced To Pay $300 Million To Cover COVID-Era Program
-

 Uncategorized3 weeks ago
Apparel Retailer Express Moving Toward Bankruptcy
-

 Uncategorized4 weeks ago
Industrial Production Decreased 0.1% in January
-

 International5 days ago
Walmart launches clever answer to Target’s new membership program
-

 Uncategorized4 weeks ago
RFK Jr: The Wuhan Cover-Up & The Rise Of The Biowarfare-Industrial Complex
-

 Uncategorized3 weeks ago
GOP Efforts To Shore Up Election Security In Swing States Face Challenges