Connect with us

International

A Bizarre Discrepancy Emerges In The Trade Data Between US And China

A Bizarre Discrepancy Emerges In The Trade Data Between US And China

Tyler Durden

Mon, 12/07/2020 – 11:30

Overnight, China reported its latest trade data for the month of November which was, in a word, blockbuster: exports accelerat

Published

on

A Bizarre Discrepancy Emerges In The Trade Data Between US And China Tyler Durden Mon, 12/07/2020 - 11:30

Overnight, China reported its latest trade data for the month of November which was, in a word, blockbuster: exports accelerated sharply to 21.1% Y/Y (from 11.4% Y/Y) in October driven by a surge in covid-related exports, with sequential growth up to +5.1% month-on-month; Imports moderated slightly in November and grew 4.5% Y/Y (1.0% month-on-month non-annualized expansion), compared with the 4.7% Y/Y increase in October (although as Rabobank's Michael Every cautions, many of the imports were of soft commodities vs. higher value-added goods).

In any case, the result was a record monthly goods trade surplus in November of  $75.4BN, which below above consensus expectations of $46.3BN and was well above the October surplus of $58.4BN.

Digging into the number, exports of Covid-19 related products surged in November due to the resurgence of coronavirus in most major economies: exports of textile & fabric goods grew 21.0% Y/Y, vs 14.8% Y/Y in October, while "working from home" related exports accelerated as well - growth of exports in automatic data processing machines accelerated to 34.3% Y/Y in November vs 26.7% Y/Y in October. Growth of exports in electronic integrated circuits also improved to 26.4% Y/Y in November from 13.9% Y/Y in October. Exports of plastic articles remained strong and grew 112.9% Y/Y vs 97.9% Y/Y in October. Housing related exports accelerated further - exports of furniture grew 41.9% Y/Y vs 32.3% Y/Y in October.

But while the overall trade numbers were impressive, if not for positive reasons since China's export boom continues to be driven by covid-related demand - yes, the same covid that was unleashed by, well, China - what was most remarkable in the latest data set released by China's National Bureau of Statistics is that exports to the US surged 46.1% in US Dollar terms, putting the monthly bilateral surplus ($32.8bn) above levels observed at the end of 2019 (just as the US/China Phase 1 deal was being finalized); as BMO's Stephen Gallo writes, "From the perspective of that agreement, the US/China bilateral balance has been trending in the wrong direction (helped by the effects of COVID-19). Merchandise exports to the US, as a share of total exports, ended 2019 at 13.6%, but they were back to 17.6% as of November 2020."

In short, after the US made some headway in its trade war with Beijing, all that progress and more is now gone as Chinese net exports are steamrolling ahead... thanks to covid.

Yet here an interesting observation emerges: while the trade surplus with the US according to China Customs data indeed hit a record high, US Bureau of Economic Analysis data shows something quite different, and this deiscepancy is showin the chart below:

This is, to say the least, strange: after all data is data, and when one using the same nominal amount of trade exports and imports between the two countries engaging in trade, one should - in theory at least - end up with the same trade surplus (and respectively deficit) number.

Alas, as the chart above shows, not only has that has not been the case for the past two decades, but curiously, after years of US data showing a larger bilateral deficit with China than the Chinese data shows a surplus with the United States (largely due to the so-called Hong Kong port effect which explains much of the discrepancy), this has reversed in the past few months when China’s reported exports to the United States have significantly exceeded reported U.S. imports (the exact opposite of the established pattern). This can be seen clearly in the chart below which is a zoomed in portion the bilateral trade balances shown above:

This phenomenon which has escalated drastically in recent months, was first pointed out by former Treasury official Brad Setser who pointed out the data discrepancy in an October blog post , writing that "there is no doubt there is a gap. In July 2018, China said it exported $41.6 billion to the United States, and the United States reported importing $47 billion from China. In July 2019, China said it exported $38.9 billion to the United States (down because of the tariffs), and the United States reported importing $41.4 billion from China. And in July 2020, China said it exported $43.7 billion to the United States, while the United States only reported importing $40.7 billion from China."

As a result, as Setser adds, "the answer to a lot of politically-salient questions—for example, is the bilateral trade deficit with China larger or smaller now than in 2016?—hinges on whether you use the U.S. or the Chinese data. "

If you look at the Chinese data, its current monthly surplus with the United States is at an all-time high for the months of July and August, topping its pre-trade war peaks by substantial margins

In the U.S. data, the July deficit with China and Hong Kong (adding in Hong Kong reduces the size of the deficit as the United States runs a surplus with HK) is only just above its 2016 levels.

Fast-forwarding two months to the latest December data only shows that this divergence has accelerated with the latest Chinese data showing yet another record surplus for the month of November.

To be sure, and as one can easily see in the charts above, the gap between China’s reported exports to the United States - red line - and reported U.S. imports - blue line - plus the larger deficit when reported from the U.S. side than the surplus on the Chinese side, has been a long-standing pattern. It reflects the previously discussed role of Hong Kong in U.S.-China trade, because as Setser explains, "a lot of what China records in its data as an export to Hong Kong historically has ended up in the U.S. data as an import from China, and a lot of what the United States reports as an export to Hong Kong has historically ended up in the Chinese data as an import from the United States."

What is novel here is the change in the pattern - the long established and well-understood discrepancy between the import and export side data has gone away.    

The puzzle, as Setser wrote, "is why the sign on the discrepancy looks to be flipping." There are two possible explanations which immediately come to mind.

Chinese exporters might be overstating their exports, in general and to the United States. Overstating exports is a classic way of getting capital into a country with capital controls.

However, a simpler explanation is that the US tariffs have created a strong incentive for firms importing into the United States to go to some lengths to understate their imports from China. Thus, U.S. imports from China are now likely under-counted (which by implication holds the bilateral trade deficit down).

As Setser concludes, while "mapping one country’s import data to a partner’s export data" is a dull but exercise, "sometimes it yields interesting results. A similar exercise back in 2015—the Chinese current account surplus stopped tracking the goods balance—led me to look at whether the reported increase in tourism imports in the Chinese data was matched by a rise in the number of actual tourists (it wasn’t) and ultimately produced quite a good Fed paper." We are confident that economists looking at the growing discrepancy in trade data between the US and China will soon be busy coming up with their own theories, even if the real answer why this most critical trade relationship in a world where the US-China trade war has been the overriding theme for much of the past 4 years, will likely remain a mystery.

Read More

Continue Reading

International

Analyst reviews Apple stock price target amid challenges

Here’s what could happen to Apple shares next.

Published

on

They said it was bound to happen.

It was Jan. 11, 2024 when software giant Microsoft  (MSFT)  briefly passed Apple  (AAPL)  as the most valuable company in the world.

Microsoft's stock closed 0.5% higher, giving it a market valuation of $2.859 trillion. 

It rose as much as 2% during the session and the company was briefly worth $2.903 trillion. Apple closed 0.3% lower, giving the company a market capitalization of $2.886 trillion. 

"It was inevitable that Microsoft would overtake Apple since Microsoft is growing faster and has more to benefit from the generative AI revolution," D.A. Davidson analyst Gil Luria said at the time, according to Reuters.

The two tech titans have jostled for top spot over the years and Microsoft was ahead at last check, with a market cap of $3.085 trillion, compared with Apple's value of $2.684 trillion.

Analysts noted that Apple had been dealing with weakening demand, including for the iPhone, the company’s main source of revenue. 

Demand in China, a major market, has slumped as the country's economy makes a slow recovery from the pandemic and competition from Huawei.

Sales in China of Apple's iPhone fell by 24% in the first six weeks of 2024 compared with a year earlier, according to research firm Counterpoint, as the company contended with stiff competition from a resurgent Huawei "while getting squeezed in the middle on aggressive pricing from the likes of OPPO, vivo and Xiaomi," said senior Analyst Mengmeng Zhang.

“Although the iPhone 15 is a great device, it has no significant upgrades from the previous version, so consumers feel fine holding on to the older-generation iPhones for now," he said.

A man scrolling through Netflix on an Apple iPad Pro. Photo by Phil Barker/Future Publishing via Getty Images.

Future Publishing/Getty Images

Big plans for China

Counterpoint said that the first six weeks of 2023 saw abnormally high numbers with significant unit sales being deferred from December 2022 due to production issues.

Apple is planning to open its eighth store in Shanghai – and its 47th across China – on March 21.

Related: Tech News Now: OpenAI says Musk contract 'never existed', Xiaomi's EV, and more

The company also plans to expand its research centre in Shanghai to support all of its product lines and open a new lab in southern tech hub Shenzhen later this year, according to the South China Morning Post.

Meanwhile, over in Europe, Apple announced changes to comply with the European Union's Digital Markets Act (DMA), which went into effect last week, Reuters reported on March 12.

Beginning this spring, software developers operating in Europe will be able to distribute apps to EU customers directly from their own websites instead of through the App Store.

"To reflect the DMA’s changes, users in the EU can install apps from alternative app marketplaces in iOS 17.4 and later," Apple said on its website, referring to the software platform that runs iPhones and iPads. 

"Users will be able to download an alternative marketplace app from the marketplace developer’s website," the company said.

Apple has also said it will appeal a $2 billion EU antitrust fine for thwarting competition from Spotify  (SPOT)  and other music streaming rivals via restrictions on the App Store.

The company's shares have suffered amid all this upheaval, but some analysts still see good things in Apple's future.

Bank of America Securities confirmed its positive stance on Apple, maintaining a buy rating with a steady price target of $225, according to Investing.com

The firm's analysis highlighted Apple's pricing strategy evolution since the introduction of the first iPhone in 2007, with initial prices set at $499 for the 4GB model and $599 for the 8GB model.

BofA said that Apple has consistently launched new iPhone models, including the Pro/Pro Max versions, to target the premium market. 

Analyst says Apple selloff 'overdone'

Concurrently, prices for previous models are typically reduced by about $100 with each new release. 

This strategy, coupled with installment plans from Apple and carriers, has contributed to the iPhone's installed base reaching a record 1.2 billion in 2023, the firm said.

More Tech Stocks:

Apple has effectively shifted its sales mix toward higher-value units despite experiencing slower unit sales, BofA said.

This trend is expected to persist and could help mitigate potential unit sales weaknesses, particularly in China. 

BofA also noted Apple's dominance in the high-end market, maintaining a market share of over 90% in the $1,000 and above price band for the past three years.

The firm also cited the anticipation of a multi-year iPhone cycle propelled by next-generation AI technology, robust services growth, and the potential for margin expansion.

On Monday, Evercore ISI analysts said they believed that the sell-off in the iPhone maker’s shares may be “overdone.”

The firm said that investors' growing preference for AI-focused stocks like Nvidia  (NVDA)  has led to a reallocation of funds away from Apple. 

In addition, Evercore said concerns over weakening demand in China, where Apple may be losing market share in the smartphone segment, have affected investor sentiment.

And then ongoing regulatory issues continue to have an impact on investor confidence in the world's second-biggest company.

“We think the sell-off is rather overdone, while we suspect there is strong valuation support at current levels to down 10%, there are three distinct drivers that could unlock upside on the stock from here – a) Cap allocation, b) AI inferencing, and c) Risk-off/defensive shift," the firm said in a research note.

Related: Veteran fund manager picks favorite stocks for 2024

Read More

Continue Reading

International

Major typhoid fever surveillance study in sub-Saharan Africa indicates need for the introduction of typhoid conjugate vaccines in endemic countries

There is a high burden of typhoid fever in sub-Saharan African countries, according to a new study published today in The Lancet Global Health. This high…

Published

on

There is a high burden of typhoid fever in sub-Saharan African countries, according to a new study published today in The Lancet Global Health. This high burden combined with the threat of typhoid strains resistant to antibiotic treatment calls for stronger prevention strategies, including the use and implementation of typhoid conjugate vaccines (TCVs) in endemic settings along with improvements in access to safe water, sanitation, and hygiene.

Credit: IVI

There is a high burden of typhoid fever in sub-Saharan African countries, according to a new study published today in The Lancet Global Health. This high burden combined with the threat of typhoid strains resistant to antibiotic treatment calls for stronger prevention strategies, including the use and implementation of typhoid conjugate vaccines (TCVs) in endemic settings along with improvements in access to safe water, sanitation, and hygiene.


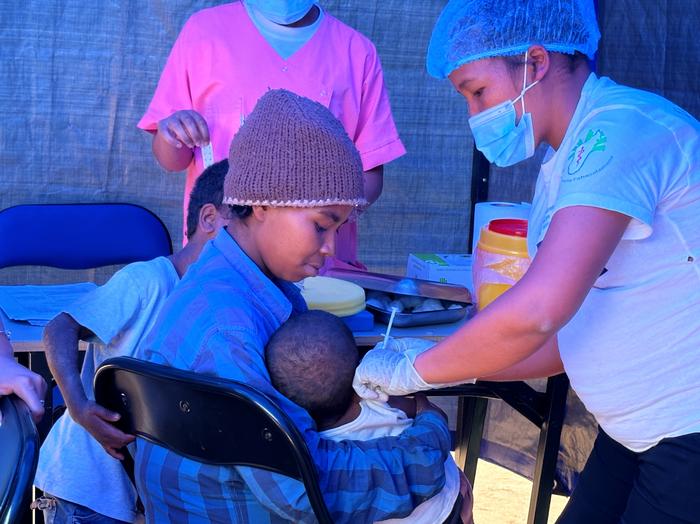
The findings from this 4-year study, the Severe Typhoid in Africa (SETA) program, offers new typhoid fever burden estimates from six countries: Burkina Faso, Democratic Republic of the Congo (DRC), Ethiopia, Ghana, Madagascar, and Nigeria, with four countries recording more than 100 cases for every 100,000 person-years of observation, which is considered a high burden. The highest incidence of typhoid was found in DRC with 315 cases per 100,000 people while children between 2-14 years of age were shown to be at highest risk across all 25 study sites.


There are an estimated 12.5 to 16.3 million cases of typhoid every year with 140,000 deaths. However, with generic symptoms such as fever, fatigue, and abdominal pain, and the need for blood culture sampling to make a definitive diagnosis, it is difficult for governments to capture the true burden of typhoid in their countries.


“Our goal through SETA was to address these gaps in typhoid disease burden data,” said lead author Dr. Florian Marks, Deputy Director General of the International Vaccine Institute (IVI). “Our estimates indicate that introduction of TCV in endemic settings would go to lengths in protecting communities, especially school-aged children, against this potentially deadly—but preventable—disease.”


In addition to disease incidence, this study also showed that the emergence of antimicrobial resistance (AMR) in Salmonella Typhi, the bacteria that causes typhoid fever, has led to more reliance beyond the traditional first line of antibiotic treatment. If left untreated, severe cases of the disease can lead to intestinal perforation and even death. This suggests that prevention through vaccination may play a critical role in not only protecting against typhoid fever but reducing the spread of drug-resistant strains of the bacteria.


There are two TCVs prequalified by the World Health Organization (WHO) and available through Gavi, the Vaccine Alliance. In February 2024, IVI and SK bioscience announced that a third TCV, SKYTyphoid™, also achieved WHO PQ, paving the way for public procurement and increasing the global supply.


Alongside the SETA disease burden study, IVI has been working with colleagues in three African countries to show the real-world impact of TCV vaccination. These studies include a cluster-randomized trial in Agogo, Ghana and two effectiveness studies following mass vaccination in Kisantu, DRC and Imerintsiatosika, Madagascar.


Dr. Birkneh Tilahun Tadesse, Associate Director General at IVI and Head of the Real-World Evidence Department, explains, “Through these vaccine effectiveness studies, we aim to show the full public health value of TCV in settings that are directly impacted by a high burden of typhoid fever.” He adds, “Our final objective of course is to eliminate typhoid or to at least reduce the burden to low incidence levels, and that’s what we are attempting in Fiji with an island-wide vaccination campaign.”


As more countries in typhoid endemic countries, namely in sub-Saharan Africa and South Asia, consider TCV in national immunization programs, these data will help inform evidence-based policy decisions around typhoid prevention and control.


###


About the International Vaccine Institute (IVI)
The International Vaccine Institute (IVI) is a non-profit international organization established in 1997 at the initiative of the United Nations Development Programme with a mission to discover, develop, and deliver safe, effective, and affordable vaccines for global health.

IVI’s current portfolio includes vaccines at all stages of pre-clinical and clinical development for infectious diseases that disproportionately affect low- and middle-income countries, such as cholera, typhoid, chikungunya, shigella, salmonella, schistosomiasis, hepatitis E, HPV, COVID-19, and more. IVI developed the world’s first low-cost oral cholera vaccine, pre-qualified by the World Health Organization (WHO) and developed a new-generation typhoid conjugate vaccine that is recently pre-qualified by WHO.

IVI is headquartered in Seoul, Republic of Korea with a Europe Regional Office in Sweden, a Country Office in Austria, and Collaborating Centers in Ghana, Ethiopia, and Madagascar. 39 countries and the WHO are members of IVI, and the governments of the Republic of Korea, Sweden, India, Finland, and Thailand provide state funding. For more information, please visit https://www.ivi.int.


CONTACT

Aerie Em, Global Communications & Advocacy Manager
+82 2 881 1386 | aerie.em@ivi.int


Read More

Continue Reading

International

US Spent More Than Double What It Collected In February, As 2024 Deficit Is Second Highest Ever… And Debt Explodes

US Spent More Than Double What It Collected In February, As 2024 Deficit Is Second Highest Ever… And Debt Explodes

Earlier today, CNBC’s…

Published

on

US Spent More Than Double What It Collected In February, As 2024 Deficit Is Second Highest Ever... And Debt Explodes

Earlier today, CNBC's Brian Sullivan took a horse dose of Red Pills when, about six months after our readers, he learned that the US is issuing $1 trillion in debt every 100 days, which prompted him to rage tweet, (or rageX, not sure what the proper term is here) the following:

We’ve added 60% to national debt since 2018. Germany - a country with major economic woes - added ‘just’ 32%.   

Maybe it will never matter.   Maybe MMT is real.   Maybe we just cancel or inflate it out. Maybe career real estate borrowers or career politicians aren’t the answer.

I have no idea.  Only time will tell.   But it’s going to be fascinating to watch it play out.

He is right: it will be fascinating, and the latest budget deficit data simply confirmed that the day of reckoning will come very soon, certainly sooner than the two years that One River's Eric Peters predicted this weekend for the coming "US debt sustainability crisis."

According to the US Treasury, in February, the US collected $271 billion in various tax receipts, and spent $567 billion, more than double what it collected.

The two charts below show the divergence in US tax receipts which have flatlined (on a trailing 6M basis) since the covid pandemic in 2020 (with occasional stimmy-driven surges)...

... and spending which is about 50% higher compared to where it was in 2020.

The end result is that in February, the budget deficit rose to $296.3 billion, up 12.9% from a year prior, and the second highest February deficit on record.

And the punchline: on a cumulative basis, the budget deficit in fiscal 2024 which began on October 1, 2023 is now $828 billion, the second largest cumulative deficit through February on record, surpassed only by the peak covid year of 2021.

But wait there's more: because in a world where the US is spending more than twice what it is collecting, the endgame is clear: debt collapse, and while it won't be tomorrow, or the week after, it is coming... and it's also why the US is now selling $1 trillion in debt every 100 days just to keep operating (and absorbing all those millions of illegal immigrants who will keep voting democrat to preserve the socialist system of the US, so beloved by the Soros clan).

And it gets even worse, because we are now in the ponzi finance stage of the Minsky cycle, with total interest on the debt annualizing well above $1 trillion, and rising every day

... having already surpassed total US defense spending and soon to surpass total health spending and, finally all social security spending, the largest spending category of all, which means that US debt will now rise exponentially higher until the inevitable moment when the US dollar loses its reserve status and it all comes crashing down.

We conclude with another observation by CNBC's Brian Sullivan, who quotes an email by a DC strategist...

.. which lays out the proposed Biden budget as follows:

The budget deficit will growth another $16 TRILLION over next 10 years. Thats *with* the proposed massive tax hikes.

Without them the deficit will grow $19 trillion.

That's why you will hear the "deficit is being reduced by $3 trillion" over the decade.

No family budget or business could exist with this kind of math.

Of course, in the long run, neither can the US... and since neither party will ever cut the spending which everyone by now is so addicted to, the best anyone can do is start planning for the endgame.

Tyler Durden Tue, 03/12/2024 - 18:40

Read More

Continue Reading

Trending