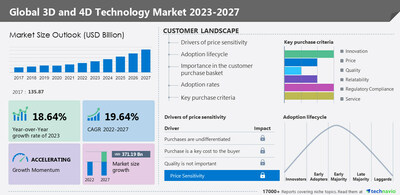
NEW YORK, Jan. 25, 2023 /PRNewswire/ -- The 3D and 4D Technology Market by Solution, End-user, and Geography - Forecast and Analysis 2023-2027 report has been published by Technavio. Market growth is estimated to accelerate at a CAGR of 19.64% and register an incremental growth of USD 371.19 billion during the forecast period. The report provides a comprehensive analysis of growth opportunities at regional levels, new product launches, the latest trends, and the post-pandemic recovery of the global market. Download a PDF sample report
Company profiles
The 3D and 4D technology market report includes information on the key products and recent developments of leading vendors, including:
- 3D Systems Corp.: The company offers 3D and 4D technology products such as 3D printers.
- American Paper Optics LLC: The company offers 3D and 4D technology products such as 3D Fireworks glasses.
- Autodesk Inc: The company offers 3D and 4D technology products such as 3ds Max.
- Barco NV: The company offers 3D and 4D technology products such as 3D walls, canvas, caves.
- Desktop Metal Inc.: The company offers 3D and 4D technology products through its subsidiary ExOne Company.
- Dolby Laboratories Inc.
- FARO Technologies Inc.
- General Electric Co.
- Hexagon AB
- To gain access to more vendor profiles available with Technavio, buy the report!
Regional analysis
Based on region, the global 3D and 4D technology market is segmented into North America, APAC, Europe, South America, and the Middle East and Africa. North America is estimated to account for 47% of the market's growth during the forecast period. An increase in government investments and the growing demand for 3D printers in the consumer electronics, education, and defense sectors are driving the growth of the market in the region. The expansion of facilities and the extensive use of 3D printing technology for different components and parts will also propel the growth of the regional market during the forecast period
Market dynamics
The market is driven by factors such as the use of 3D and 4D in security and surveillance systems, the increasing adoption of 3D displays in advertisement, and the growing prevalence of 3D printing technology. However, the high cost associated with 3D displays is hindering market growth.
Competitive analysis
The competitive scenario categorizes companies based on various performance indicators. Some of the factors considered include the financial performance of companies over the past few years, growth strategies, product innovations, new product launches, investments, growth in market share, among others. Request a sample
Market segmentation
- Based on the solution, the market is segmented into 3D and 4D output device and 3D and 4D input device. The 3D and 4D output device segment accounted for the largest share of the market in 2022.
- Based on geography, the market is segmented into North America, APAC, Europe, South America, and Middle East and Africa. North America held the largest share of the market in 2022.
- Based on end-user, the market is segmented into entertainment, consumer electronics, and others.
Related Reports:
The 3D imaging market size is expected to increase by USD 29.17 billion from 2021 to 2026, and the market's growth momentum will accelerate at a CAGR of 17.5%. The increasing product launches is notably driving the 3D imaging market growth, although factors such as high initial costs of 3D imaging equipment may impede the market growth.
The 3D sensors market size is expected to increase by USD 10.84 billion from 2021 to 2026, and the market's growth momentum will accelerate at a CAGR of 23.19%. The use of 3D sensors in security and surveillance systems is notably driving the market growth, although factors such as accuracy and calibration issues during sensor fusion may impede the market growth.
Technavio's library includes over 17,000+ reports, covering more than 2,000 emerging technologies. Subscribe to our "Basic Plan" at just USD 5,000 and get lifetime access to Technavio Insights
What are the key data covered in this 3D and 4D technology market report?
- CAGR of the market during the forecast period
- Detailed information on factors that will drive the growth of the 3D and 4D technology market between 2023 and 2027
- Precise estimation of the 3D and 4D technology market size and its contribution to the parent market
- Accurate predictions about upcoming trends and changes in consumer behavior
- Growth of the industry across North America, Europe, APAC, Middle East and Africa, and South America
- A thorough analysis of the market's competitive landscape and detailed information about vendors
- Comprehensive analysis of factors that will challenge the growth of 3d and 4d technology market vendors
3D And 4D Technology Market Scope
|
Report Coverage
| Details
|
Page number
| 162
|
Base year
| 2022
|
Historic period
| 2017-2021
|
Forecast period
| 2023-2027
|
Growth momentum & CAGR
| Accelerate at a CAGR of 19.64%
|
Market growth 2023-2027
| USD 371.19 billion
|
Market structure
| Fragmented
|
YoY growth 2022-2023(%)
| 18.64
|
Regional analysis
| North America, Europe, APAC, Middle East and Africa, and South America
|
Performing market contribution
| North America at 47%
|
Key countries
| US, China, Japan, Germany, and UK
|
Competitive landscape
| Leading vendors, market positioning of vendors, competitive strategies, and industry risks
|
Key companies profiled
| 3D Systems Corp., American Paper Optics LLC, Barco NV, Desktop Metal Inc., Dolby Laboratories Inc., FARO Technologies Inc., General Electric Co., Hexagon AB, Koninklijke Philips NV, LG Electronics Inc., Nikon Corp., Optomec Inc., Panasonic Holdings Corp., Renishaw Plc, Samsung Electronics Co. Ltd., Sharp Corp., Sony Group Corp., Stratasys Ltd., Vicon Motion Systems Ltd., and Autodesk Inc.
|
Market dynamics
| Parent market analysis, market growth inducers and obstacles, fast-growing and slow-growing segment analysis, COVID-19 impact and recovery analysis and future consumer dynamics, and market condition analysis for the forecast period.
|
Customization purview
| If our report has not included the data that you are looking for, you can reach out to our analysts and get segments customized.
|
Browse for Technavio's information technology market reports
Table of contents:
1 Executive Summary
- 1.1 Market overview
- Exhibit 01: Executive Summary – Chart on Market Overview
- Exhibit 02: Executive Summary – Data Table on Market Overview
- Exhibit 03: Executive Summary – Chart on Global Market Characteristics
- Exhibit 04: Executive Summary – Chart on Market by Geography
- Exhibit 05: Executive Summary – Chart on Market Segmentation by Solution
- Exhibit 06: Executive Summary – Chart on Market Segmentation by End-user
- Exhibit 07: Executive Summary – Chart on Incremental Growth
- Exhibit 08: Executive Summary – Data Table on Incremental Growth
- Exhibit 09: Executive Summary – Chart on Vendor Market Positioning
2 Market Landscape
- 2.1 Market ecosystem
- Exhibit 10: Parent market
- Exhibit 11: Market Characteristics
3 Market Sizing
- 3.1 Market definition
- Exhibit 12: Offerings of vendors included in the market definition
- 3.2 Market segment analysis
- Exhibit 13: Market segments
- 3.4 Market outlook: Forecast for 2022-2027
- Exhibit 14: Chart on Global - Market size and forecast 2022-2027 ($ billion)
- Exhibit 15: Data Table on Global - Market size and forecast 2022-2027 ($ billion)
- Exhibit 16: Chart on Global Market: Year-over-year growth 2022-2027 (%)
- Exhibit 17: Data Table on Global Market: Year-over-year growth 2022-2027 (%)
4 Historic Market Size
- 4.1 Global 3D and 4D technology market 2017 - 2021
- Exhibit 18: Historic Market Size – Data Table on Global 3D and 4D technology market 2017 - 2021 ($ billion)
- 4.2 Solution Segment Analysis 2017 - 2021
- Exhibit 19: Historic Market Size – Solution Segment 2017 - 2021 ($ billion)
- 4.3 End- user Segment Analysis 2017 - 2021
- Exhibit 20: Historic Market Size – End- user Segment 2017 - 2021 ($ billion)
- 4.4 Geography Segment Analysis 2017 - 2021
- Exhibit 21: Historic Market Size – Geography Segment 2017 - 2021 ($ billion)
- 4.5 Country Segment Analysis 2017 - 2021
- Exhibit 22: Historic Market Size – Country Segment 2017 - 2021 ($ billion)
5 Five Forces Analysis
- 5.1 Five forces summary
- Exhibit 23: Five forces analysis - Comparison between 2022 and 2027
- 5.2 Bargaining power of buyers
- Exhibit 24: Chart on Bargaining power of buyers – Impact of key factors 2022 and 2027
- 5.3 Bargaining power of suppliers
- Exhibit 25: Bargaining power of suppliers – Impact of key factors in 2022 and 2027
- 5.4 Threat of new entrants
- Exhibit 26: Threat of new entrants – Impact of key factors in 2022 and 2027
- 5.5 Threat of substitutes
- Exhibit 27: Threat of substitutes – Impact of key factors in 2022 and 2027
- 5.6 Threat of rivalry
- Exhibit 28: Threat of rivalry – Impact of key factors in 2022 and 2027
- 5.7 Market condition
- Exhibit 29: Chart on Market condition - Five forces 2022 and 2027
6 Market Segmentation by Solution
- 6.1 Market segments
- Exhibit 30: Chart on Solution - Market share 2022-2027 (%)
- Exhibit 31: Data Table on Solution - Market share 2022-2027 (%)
- 6.2 Comparison by Solution
- Exhibit 32: Chart on Comparison by Solution
- Exhibit 33: Data Table on Comparison by Solution
- 6.3 3D and 4D output device - Market size and forecast 2022-2027
- Exhibit 34: Chart on 3D and 4D output device - Market size and forecast 2022-2027 ($ billion)
- Exhibit 35: Data Table on 3D and 4D output device - Market size and forecast 2022-2027 ($ billion)
- Exhibit 36: Chart on 3D and 4D output device - Year-over-year growth 2022-2027 (%)
- Exhibit 37: Data Table on 3D and 4D output device - Year-over-year growth 2022-2027 (%)
- 6.4 3D and 4D input device - Market size and forecast 2022-2027
- Exhibit 38: Chart on 3D and 4D input device - Market size and forecast 2022-2027 ($ billion)
- Exhibit 39: Data Table on 3D and 4D input device - Market size and forecast 2022-2027 ($ billion)
- Exhibit 40: Chart on 3D and 4D input device - Year-over-year growth 2022-2027 (%)
- Exhibit 41: Data Table on 3D and 4D input device - Year-over-year growth 2022-2027 (%)
- 6.5 Market opportunity by Solution
- Exhibit 42: Market opportunity by Solution ($ billion)
7 Market Segmentation by End-user
- 7.1 Market segments
- Exhibit 43: Chart on End-user - Market share 2022-2027 (%)
- Exhibit 44: Data Table on End-user - Market share 2022-2027 (%)
- 7.2 Comparison by End-user
- Exhibit 45: Chart on Comparison by End-user
- Exhibit 46: Data Table on Comparison by End-user
- 7.3 Entertainment - Market size and forecast 2022-2027
- Exhibit 47: Chart on Entertainment - Market size and forecast 2022-2027 ($ billion)
- Exhibit 48: Data Table on Entertainment - Market size and forecast 2022-2027 ($ billion)
- Exhibit 49: Chart on Entertainment - Year-over-year growth 2022-2027 (%)
- Exhibit 50: Data Table on Entertainment - Year-over-year growth 2022-2027 (%)
- 7.4 Consumer electronics - Market size and forecast 2022-2027
- Exhibit 51: Chart on Consumer electronics - Market size and forecast 2022-2027 ($ billion)
- Exhibit 52: Data Table on Consumer electronics - Market size and forecast 2022-2027 ($ billion)
- Exhibit 53: Chart on Consumer electronics - Year-over-year growth 2022-2027 (%)
- Exhibit 54: Data Table on Consumer electronics - Year-over-year growth 2022-2027 (%)
- 7.5 Others - Market size and forecast 2022-2027
- Exhibit 55: Chart on Others - Market size and forecast 2022-2027 ($ billion)
- Exhibit 56: Data Table on Others - Market size and forecast 2022-2027 ($ billion)
- Exhibit 57: Chart on Others - Year-over-year growth 2022-2027 (%)
- Exhibit 58: Data Table on Others - Year-over-year growth 2022-2027 (%)
- 7.6 Market opportunity by End-user
- Exhibit 59: Market opportunity by End-user ($ billion)
8 Customer Landscape
- 8.1 Customer landscape overview
- Exhibit 60: Analysis of price sensitivity, lifecycle, customer purchase basket, adoption rates, and purchase criteria
9 Geographic Landscape
- 9.1 Geographic segmentation
- Exhibit 61: Chart on Market share by geography 2022-2027 (%)
- Exhibit 62: Data Table on Market share by geography 2022-2027 (%)
- 9.2 Geographic comparison
- Exhibit 63: Chart on Geographic comparison
- Exhibit 64: Data Table on Geographic comparison
- 9.3 North America - Market size and forecast 2022-2027
- Exhibit 65: Chart on North America - Market size and forecast 2022-2027 ($ billion)
- Exhibit 66: Data Table on North America - Market size and forecast 2022-2027 ($ billion)
- Exhibit 67: Chart on North America - Year-over-year growth 2022-2027 (%)
- Exhibit 68: Data Table on North America - Year-over-year growth 2022-2027 (%)
- 9.4 Europe - Market size and forecast 2022-2027
- Exhibit 69: Chart on Europe - Market size and forecast 2022-2027 ($ billion)
- Exhibit 70: Data Table on Europe - Market size and forecast 2022-2027 ($ billion)
- Exhibit 71: Chart on Europe - Year-over-year growth 2022-2027 (%)
- Exhibit 72: Data Table on Europe - Year-over-year growth 2022-2027 (%)
- 9.5 APAC - Market size and forecast 2022-2027
- Exhibit 73: Chart on APAC - Market size and forecast 2022-2027 ($ billion)
- Exhibit 74: Data Table on APAC - Market size and forecast 2022-2027 ($ billion)
- Exhibit 75: Chart on APAC - Year-over-year growth 2022-2027 (%)
- Exhibit 76: Data Table on APAC - Year-over-year growth 2022-2027 (%)
- 9.6 Middle East and Africa - Market size and forecast 2022-2027
- Exhibit 77: Chart on Middle East and Africa - Market size and forecast 2022-2027 ($ billion)
- Exhibit 78: Data Table on Middle East and Africa - Market size and forecast 2022-2027 ($ billion)
- Exhibit 79: Chart on Middle East and Africa - Year-over-year growth 2022-2027 (%)
- Exhibit 80: Data Table on Middle East and Africa - Year-over-year growth 2022-2027 (%)
- 9.7 South America - Market size and forecast 2022-2027
- Exhibit 81: Chart on South America - Market size and forecast 2022-2027 ($ billion)
- Exhibit 82: Data Table on South America - Market size and forecast 2022-2027 ($ billion)
- Exhibit 83: Chart on South America - Year-over-year growth 2022-2027 (%)
- Exhibit 84: Data Table on South America - Year-over-year growth 2022-2027 (%)
- 9.8 US - Market size and forecast 2022-2027
- Exhibit 85: Chart on US - Market size and forecast 2022-2027 ($ billion)
- Exhibit 86: Data Table on US - Market size and forecast 2022-2027 ($ billion)
- Exhibit 87: Chart on US - Year-over-year growth 2022-2027 (%)
- Exhibit 88: Data Table on US - Year-over-year growth 2022-2027 (%)
- 9.9 China - Market size and forecast 2022-2027
- Exhibit 89: Chart on China - Market size and forecast 2022-2027 ($ billion)
- Exhibit 90: Data Table on China - Market size and forecast 2022-2027 ($ billion)
- Exhibit 91: Chart on China - Year-over-year growth 2022-2027 (%)
- Exhibit 92: Data Table on China - Year-over-year growth 2022-2027 (%)
- 9.10 Germany - Market size and forecast 2022-2027
- Exhibit 93: Chart on Germany - Market size and forecast 2022-2027 ($ billion)
- Exhibit 94: Data Table on Germany - Market size and forecast 2022-2027 ($ billion)
- Exhibit 95: Chart on Germany - Year-over-year growth 2022-2027 (%)
- Exhibit 96: Data Table on Germany - Year-over-year growth 2022-2027 (%)
- 9.11 Japan - Market size and forecast 2022-2027
- Exhibit 97: Chart on Japan - Market size and forecast 2022-2027 ($ billion)
- Exhibit 98: Data Table on Japan - Market size and forecast 2022-2027 ($ billion)
- Exhibit 99: Chart on Japan - Year-over-year growth 2022-2027 (%)
- Exhibit 100: Data Table on Japan - Year-over-year growth 2022-2027 (%)
- 9.12 UK - Market size and forecast 2022-2027
- Exhibit 101: Chart on UK - Market size and forecast 2022-2027 ($ billion)
- Exhibit 102: Data Table on UK - Market size and forecast 2022-2027 ($ billion)
- Exhibit 103: Chart on UK - Year-over-year growth 2022-2027 (%)
- Exhibit 104: Data Table on UK - Year-over-year growth 2022-2027 (%)
- 9.13 Market opportunity by geography
- Exhibit 105: Market opportunity by geography ($ billion)
10 Drivers, Challenges, and Trends
- 10.3 Impact of drivers and challenges
- Exhibit 106: Impact of drivers and challenges in 2022 and 2027
11 Vendor Landscape
- 11.2 Vendor landscape
- Exhibit 107: Overview on Criticality of inputs and Factors of differentiation
- 11.3 Landscape disruption
- Exhibit 108: Overview on factors of disruption
- 11.4 Industry risks
- Exhibit 109: Impact of key risks on business
12 Vendor Analysis
- 12.1 Vendors covered
- Exhibit 110: Vendors covered
- 12.2 Market positioning of vendors
- Exhibit 111: Matrix on vendor position and classification
- 12.3 3D Systems Corp.
- Exhibit 112: 3D Systems Corp. - Overview
- Exhibit 113: 3D Systems Corp. - Business segments
- Exhibit 114: 3D Systems Corp. - Key news
- Exhibit 115: 3D Systems Corp. - Key offerings
- Exhibit 116: 3D Systems Corp. - Segment focus
- 12.4 American Paper Optics LLC
- Exhibit 117: American Paper Optics LLC - Overview
- Exhibit 118: American Paper Optics LLC - Product / Service
- Exhibit 119: American Paper Optics LLC - Key offerings
- 12.5 Autodesk Inc.
- Exhibit 120: Autodesk Inc. - Overview
- Exhibit 121: Autodesk Inc. - Product / Service
- Exhibit 122: Autodesk Inc. - Key news
- Exhibit 123: Autodesk Inc. - Key offerings
- 12.6 Barco NV
- Exhibit 124: Barco NV - Overview
- Exhibit 125: Barco NV - Business segments
- Exhibit 126: Barco NV - Key offerings
- Exhibit 127: Barco NV - Segment focus
- 12.7 Desktop Metal Inc.
- Exhibit 128: Desktop Metal Inc. - Overview
- Exhibit 129: Desktop Metal Inc. - Business segments
- Exhibit 130: Desktop Metal Inc. - Key news
- Exhibit 131: Desktop Metal Inc. - Key offerings
- Exhibit 132: Desktop Metal Inc. - Segment focus
- 12.8 Dolby Laboratories Inc.
- Exhibit 133: Dolby Laboratories Inc. - Overview
- Exhibit 134: Dolby Laboratories Inc. - Product / Service
- Exhibit 135: Dolby Laboratories Inc. - Key news
- Exhibit 136: Dolby Laboratories Inc. - Key offerings
- 12.9 FARO Technologies Inc.
- Exhibit 137: FARO Technologies Inc. - Overview
- Exhibit 138: FARO Technologies Inc. - Business segments
- Exhibit 139: FARO Technologies Inc. - Key news
- Exhibit 140: FARO Technologies Inc. - Key offerings
- Exhibit 141: FARO Technologies Inc. - Segment focus
- 12.10 Hexagon AB
- Exhibit 142: Hexagon AB - Overview
- Exhibit 143: Hexagon AB - Business segments
- Exhibit 144: Hexagon AB - Key offerings
- Exhibit 145: Hexagon AB - Segment focus
- 12.11 Koninklijke Philips NV
- Exhibit 146: Koninklijke Philips NV - Overview
- Exhibit 147: Koninklijke Philips NV - Business segments
- Exhibit 148: Koninklijke Philips NV - Key news
- Exhibit 149: Koninklijke Philips NV - Key offerings
- Exhibit 150: Koninklijke Philips NV - Segment focus
- 12.12 LG Electronics Inc.
- Exhibit 151: LG Electronics Inc. - Overview
- Exhibit 152: LG Electronics Inc. - Business segments
- Exhibit 153: LG Electronics Inc. - Key news
- Exhibit 154: LG Electronics Inc. - Key offerings
- Exhibit 155: LG Electronics Inc. - Segment focus
- 12.13 Panasonic Holdings Corp.
- Exhibit 156: Panasonic Holdings Corp. - Overview
- Exhibit 157: Panasonic Holdings Corp. - Business segments
- Exhibit 158: Panasonic Holdings Corp. - Key news
- Exhibit 159: Panasonic Holdings Corp. - Key offerings
- Exhibit 160: Panasonic Holdings Corp. - Segment focus
- 12.14 Samsung Electronics Co. Ltd.
- Exhibit 161: Samsung Electronics Co. Ltd. - Overview
- Exhibit 162: Samsung Electronics Co. Ltd. - Business segments
- Exhibit 163: Samsung Electronics Co. Ltd. - Key news
- Exhibit 164: Samsung Electronics Co. Ltd. - Key offerings
- Exhibit 165: Samsung Electronics Co. Ltd. - Segment focus
- 12.15 Sony Group Corp.
- Exhibit 166: Sony Group Corp. - Overview
- Exhibit 167: Sony Group Corp. - Business segments
- Exhibit 168: Sony Group Corp. - Key news
- Exhibit 169: Sony Group Corp. - Key offerings
- Exhibit 170: Sony Group Corp. - Segment focus
- 12.16 Stratasys Ltd.
- Exhibit 171: Stratasys Ltd. - Overview
- Exhibit 172: Stratasys Ltd. - Product / Service
- Exhibit 173: Stratasys Ltd. - Key news
- Exhibit 174: Stratasys Ltd. - Key offerings
- 12.17 Vicon Motion Systems Ltd.
- Exhibit 175: Vicon Motion Systems Ltd. - Overview
- Exhibit 176: Vicon Motion Systems Ltd. - Product / Service
- Exhibit 177: Vicon Motion Systems Ltd. - Key offerings
13 Appendix
- 13.2 Inclusions and exclusions checklist
- Exhibit 178: Inclusions checklist
- Exhibit 179: Exclusions checklist
- 13.3 Currency conversion rates for US$
- Exhibit 180: Currency conversion rates for US$
- 13.4 Research methodology
- Exhibit 181: Research methodology
- Exhibit 182: Validation techniques employed for market sizing
- Exhibit 183: Information sources
- 13.5 List of abbreviations
- Exhibit 184: List of abbreviations
About Us
Technavio is a leading global technology research and advisory company. Their research and analysis focus on emerging market trends and provide actionable insights to help businesses identify market opportunities and develop effective strategies to optimize their market positions. With over 500 specialized analysts, Technavio's report library consists of more than 17,000 reports and counting, covering 800 technologies, spanning across 50 countries. Their client base consists of enterprises of all sizes, including more than 100 Fortune 500 companies. This growing client base relies on Technavio's comprehensive coverage, extensive research, and actionable market insights to identify opportunities in existing and potential markets and assess their competitive positions within changing market scenarios.
Contact
Technavio Research
Jesse Maida
Media & Marketing Executive
US: +1 844 364 1100
UK: +44 203 893 3200
Email: media@technavio.com
Website: www.technavio.com/
View original content to download multimedia:https://www.prnewswire.com/news-releases/3d-and-4d-technology-market-size-to-increase-by-usd-371-19-billion-north-america-will-account-for-47-of-market-growth---technavio-301729151.html
SOURCE Technavio

")


