As anyone who’s moved to a city sight unseen can tell you — this reporter included — making platonic connections isn’t easy. Adult friendships are fickle beasts in metros of millions, where casual friends are cheap currency.
Statistics back up my anecdotal evidence. According to a 2021 survey conducted by the Survey Center on American Life, an increasing number of people can’t identify a single person as a “close friend.” In 1990, only 3% of Americans said that they had no close friends, while in 2021, that percentage rose to 12%.
Many a startup has attempted to “solve socializing” with apps, algorithms and social nudges, or a combination of those three things. Bumble, for instance, has experimented with a communities feature that lets users connect with one another based on topics and interests. Patook took a Tinder-like approach to matching potential friends, using AI both to connect users and block flirtatious messages.
But not everyone’s found these experiences to be especially fulfilling.
“[I’m alarmed] by the tech industry’s lack of focus on building social products that are truly social rather than purely built to capture attention and exploit our desire for external validation,” Keyan Kazemian told TechCrunch in an interview. He’s one of the three co-founders of 222, a social events app that aims to — unlike many that’ve come before it — facilitate meaningful and authentic connections.
“Our society’s brightest minds — our fellow scientists, engineers and product managers — are being paid hundreds of thousands of dollars not to solve the existential problems of loneliness, climate change, space travel, cancer and aging but to instead find new ways to keep an already mentally ill society consuming endless content, always fighting for more of their attention,” Kazemian continued. “We’re building a product to swing the pendulum in the other direction.”
Kazemian co-launched 222 in late 2021 with Danial Hashemi and Arman Roshannai. They initially came together over a university-funded project around predicting social compatibility among a group of strangers. Toward the end of the pandemic, Kazemian, Hashemi and Roshannai — all Gen Zers (at 23, Kazemian is the oldest) — curated intimate dinners in Kazemian’s backyard over wine and pasta for friends of friends who’d never met each other, using machine learning and a psychological questionnaire to craft the guest lists.
“Folks loved the backyard dinners so much they convinced us to try to replicate it with real venues,” Kazemian said. “In early 2022, we moved to Los Angeles and started partnering with brick and mortar locations, creating a marketplace between hyperlocal venues and members looking to discover their city and meet new people through unique social experiences.”
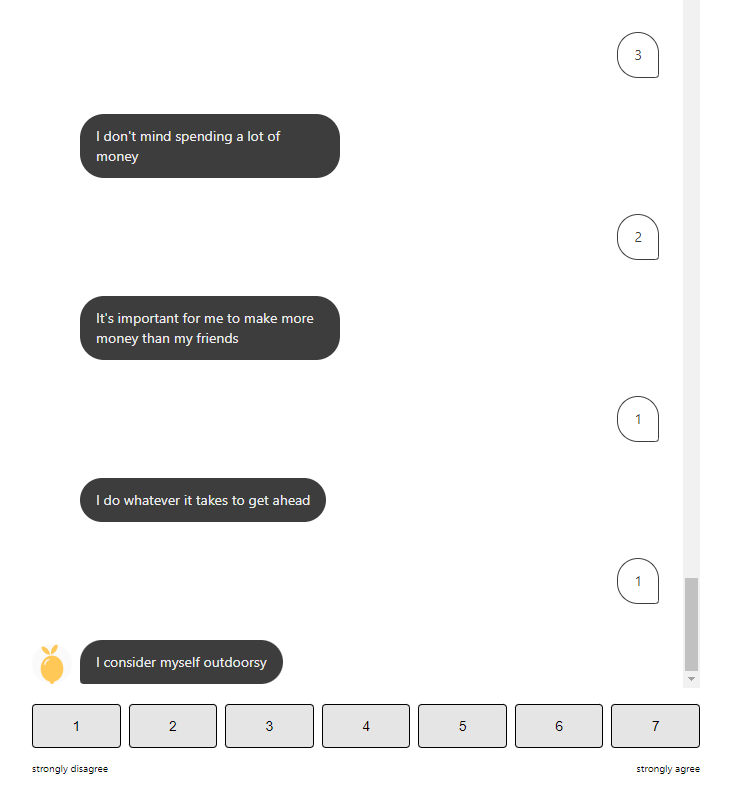
That marketplace became 222. Today, anyone between the ages of 18 and 27 can sign up for an account — the founding team is focused on the Gen Z crowd presently. There’s no app — just a basic Typeform workflow — and the sign-up process is designed to be simple. Once you provide your name, email address and date of birth, 222 has you answer roughly 30 Myers-Briggs-type questions covering topics from movie, music and cereal preferences to political views and religious affiliation.
222’s onboarding survey.
Some are uncomfortably personal — you’ll be asked about your income level, sexual orientation and college major — but Kazemian says it’s in the interest of narrowing down potential matches. “All of our data is encrypted and used only to better each 222 member’s social experience,” he added when asked about 222’s privacy practices.
222’s small print also indicates that data from the app is being analyzed as a part of a university social science project — a continuation of the one Kazemian, Hashemi and Roshannai led a year ago. Opting out requires contacting the company.
Image Credits: 222
After answering additional questions about your personality (e.g. “Is social activism is incredibly important for you?”, “Are you willing to have uncomfortable and difficult conversations with your friends?”) and go-to social activities (e.g. drinking, watching sports, going out to nightclubs), 222 has you list dietary restrictions and your ZIP code. You’re then asked to choose which factors you find most important in meeting new people (e.g., social scene, political leanings), and it’s finally off to the races.
Or it should be. When I tried to sign up, the website threw an internal server error. I eventually received a text confirming my enrollment, but it included a link to a webpage that endlessly loaded. Kazemian chalked it up to teething issues and promised a fix.
When the Typeform is working properly, Kazemian says, an algorithm behind the scenes factors in the answers to those 30-some questions to determine which of 16 categories your personality falls into. Once that’s decided, you’ll be notified if you’re selected for a 222 event — for example, dinner at a local venue partner of 222’s — which are currently held weekly and cost $2.22 to attend. Those who aren’t recruited for the dinner can choose to join for post-event mingling.
So is the algorithm any good? Kazemian asserts that it is, and that, furthermore, 222 is one of the few social apps directly training and matching based on real-life experiences.
“Most dating apps don’t do any sort of matching at all and rather focus solely on an Elo-type score, like in chess. Users on those products are only exposed to those that have a similar ‘yes-swipe-to-no-swipe ratio to themselves,” Kazemian said. “[By contrast,] based on our member’s onboarding questionnaire, 222 develops a psychological profile for each new sign up … Our algorithm will then not only pair each member with the best possible group of strangers for a given experience, it will also curate an itinerary for the evening with the best possible consumer experience — which speakeasy, café, concert or restaurant will this group of individuals have the best time at.”
That’s quite a claim to make considering Tinder and even Facebook has dabbled with helping strangers connect at events. But algorithmic robustness aside, users might be wary of attending events with perfect strangers. According to a 2022 report from the Australian Institute of Criminology, three in every four respondents had been subjected to real-life abuse through dating apps in the past five years.
222 isn’t a dating app, to be fair. And when asked about moderation and anti-harrassment measures, Kazemian said that the platform verifies every user’s identity — primarily through their payment information — and that venue staff are on hand at every event. Venue managers are educated on 222’s moderation and guidelines and it’s incumbent on them to instruct staff, Kazemian said.
“All 222 experiences are always in public and in a group setting, unlike most dating app meet-ups. 222’s phone number serves as an emergency hotline during experiences, so that members can text us if anything ever goes wrong and someone will respond right away,” Kazemian said. “Lastly, if any member is reported during a bad experience, that individual is immediately banned for life.”
222 is an intriguing platform, to be sure. But it’s tough to imagine it scaling far beyond its current size. The three-person company (222 plans to expand to eight people by the end of the year) has its hands full coordinating events in and around Los Angeles — its home city — at present, vetting venues and working to bulk up the backend infrastructure in preparation for an iOS app launch. There’s no revenue model (other than a merch store); unlike the now-defunct PartyWith, which shared a number of features in common with 222, 222 hasn’t experimented with sponsored events or other ways to monetize its experiences yet.
Perhaps that will change now that 222 has VC money behind it. Working out of the University of Southern California’s Viterbi Startup Garage, the company raised over $1.45 million in a pre-seed round led by General Catalyst with participation from backers including Y Combinator, 1517 Fund, Z Fellows, Crescent Fund and Wonder VC Scout Fund.
One wonders if the investor interest stems from the crop of new social and dating apps that aim to spark connections differently. A recent Crunchbase report highlights the growth of audio-based, video-based and even meme-based social apps, which have collectively raised tens of millions in capital from VCs over the past two years.
In an emailed statement, General Catalyst’s Nick Bonatsos expressed confidence in 222’s growth potential:
“Young people have been robbed of ~2 years of their social life due to the pandemic. They’ve been craving for social connection, making new friends and falling in love. The timing is ripe as 222 is offering their key audience a timely product — a marketplace facilitating chance social encounters at hyperlocal venues. At General Catalyst, we love partnering with Gen Z technical founders who are building products for themselves.”
Will 222 successfully turn the demand for social connection post-pandemic into a profitable business? That’ll depend on whether it can overcome the growing pains, technical and otherwise.
Over the last few years, digital currencies and gold have become decent barometers of speculative investor appetite. Such isn’t surprising given the evolution…
Over the last few years, digital currencies and gold have become decent barometers of speculative investor appetite. Such isn’t surprising given the evolution of the market into a “casino” following the pandemic, where retail traders have increased their speculative appetites.
“Such is unsurprising, given that retail investors often fall victim to the psychological behavior of the “fear of missing out.” The chart below shows the “dumb money index” versus the S&P 500. Once again, retail investors are very long equities relative to the institutional players ascribed to being the “smart money.””
“The difference between “smart” and “dumb money” investors shows that, more often than not, the “dumb money” invests near market tops and sells near market bottoms.”
That enthusiasm has increased sharply since last November as stocks surged in hopes that the Federal Reserve would cut interest rates. As noted by Sentiment Trader:
“Over the past 18 weeks, the straight-up rally has moved us to an interesting juncture in the Sentiment Cycle. For the past few weeks, the S&P 500 has demonstrated a high positive correlation to the ‘Enthusiasm’ part of the cycle and a highly negative correlation to the ‘Panic’ phase.”
That frenzy to chase the markets, driven by the psychological bias of the “fear of missing out,” has permeated the entirety of the market. As noted in “This Is Nuts:”
“Since then, the entire market has surged higher following last week’s earnings report from Nvidia (NVDA). The reason I say “this is nuts” is the assumption that all companies were going to grow earnings and revenue at Nvidia’s rate. There is little doubt about Nvidia’s earnings and revenue growth rates. However, to maintain that growth pace indefinitely, particularly at 32x price-to-sales, means others like AMD and Intel must lose market share.”
Of course, it is not just a speculative frenzy in the markets for stocks, specifically anything related to “artificial intelligence,” but that exuberance has spilled over into gold and cryptocurrencies.
Birds Of A Feather
There are a couple of ways to measure exuberance in the assets. While sentiment measures examine the broad market, technical indicators can reflect exuberance on individual asset levels. However, before we get to our charts, we need a brief explanation of statistics, specifically, standard deviation.
“Like a rubber band that has been stretched too far – it must be relaxed in order to be stretched again. This is exactly the same for stock prices that are anchored to their moving averages. Trends that get overextended in one direction, or another, always return to their long-term average. Even during a strong uptrend or strong downtrend, prices often move back (revert) to a long-term moving average.”
The idea of “stretching the rubber band” can be measured in several ways, but I will limit our discussion this week to Standard Deviation and measuring deviation with “Bollinger Bands.”
“Standard Deviation” is defined as:
“A measure of the dispersion of a set of data from its mean. The more spread apart the data, the higher the deviation. Standard deviation is calculated as the square root of the variance.”
In plain English,this meansthat the further away from the average that an event occurs, the more unlikely it becomes. As shown below, out of 1000 occurrences, only three will fall outside the area of 3 standard deviations. 95.4% of the time, events will occur within two standard deviations.
A second measure of “exuberance” is “relative strength.”
“In technical analysis, the relative strength index (RSI) is a momentum indicator that measures the magnitude of recent price changes to evaluate overbought or oversold conditions in the price of a stock or other asset. The RSI is displayed as an oscillator (a line graph that moves between two extremes) and can read from 0 to 100.
Traditional interpretation and usage of the RSI are that values of 70 or above indicate that a security is becoming overbought or overvalued and may be primed for a trend reversal or corrective pullback in price. An RSI reading of 30 or below indicates an oversold or undervalued condition.” – Investopedia
With those two measures, let’s look at Nvidia (NVDA), the poster child of speculative momentum trading in the markets. Nvidia trades more than 3 standard deviations above its moving average, and its RSI is 81. The last time this occurred was in July of 2023 when Nvidia consolidated and corrected prices through November.
Interestingly, gold also trades well into 3 standard deviation territory with an RSI reading of 75. Given that gold is supposed to be a “safe haven” or “risk off” asset, it is instead getting swept up in the current market exuberance.
The same is seen with digital currencies. Given the recent approval of spot, Bitcoin exchange-traded funds (ETFs), the panic bid to buy Bitcoin has pushed the price well into 3 standard deviation territory with an RSI of 73.
In other words, the stock market frenzy to “buy anything that is going up” has spread from just a handful of stocks related to artificial intelligence to gold and digital currencies.
It’s All Relative
We can see the correlation between stock market exuberance and gold and digital currency, which has risen since 2015 but accelerated following the post-pandemic, stimulus-fueled market frenzy. Since the market, gold and cryptocurrencies, or Bitcoin for our purposes, have disparate prices, we have rebased the performance to 100 in 2015.
Gold was supposed to be an inflation hedge. Yet, in 2022, gold prices fell as the market declined and inflation surged to 9%. However, as inflation has fallen and the stock market surged, so has gold. Notably, since 2015, gold and the market have moved in a more correlated pattern, which has reduced the hedging effect of gold in portfolios. In other words, during the subsequent market decline, gold will likely track stocks lower, failing to provide its “wealth preservation” status for investors.
The same goes for cryptocurrencies. Bitcoin is substantially more volatile than gold and tends to ebb and flow with the overall market. As sentiment surges in the S&P 500, Bitcoin and other cryptocurrencies follow suit as speculative appetites increase. Unfortunately, for individuals once again piling into Bitcoin to chase rising prices, if, or when, the market corrects, the decline in cryptocurrencies will likely substantially outpace the decline in market-based equities. This is particularly the case as Wall Street can now short the spot-Bitcoin ETFs, creating additional selling pressure on Bitcoin.
Just for added measure, here is Bitcoin versus gold.
Not A Recommendation
There are many narratives surrounding the markets, digital currency, and gold. However, in today’s market, more than in previous years, all assets are getting swept up into the investor-feeding frenzy.
Sure, this time could be different. I am only making an observation and not an investment recommendation.
However, from a portfolio management perspective, it will likely pay to remain attentive to the correlated risk between asset classes. If some event causes a reversal in bullish exuberance, cash and bonds may be the only place to hide.
BUFFALO, NY- March 11, 2024 – Impact Journals publishes scholarly journals in the biomedical sciences with a focus on all areas of cancer and aging research. Aging is one of the most prominent journals published by Impact Journals.
Credit: Impact Journals
BUFFALO, NY- March 11, 2024 – Impact Journals publishes scholarly journals in the biomedical sciences with a focus on all areas of cancer and aging research. Aging is one of the most prominent journals published by Impact Journals.
Impact Journals will be participating as an exhibitor at the American Association for Cancer Research (AACR) Annual Meeting 2024 from April 5-10 at the San Diego Convention Center in San Diego, California. This year, the AACR meeting theme is “Inspiring Science • Fueling Progress • Revolutionizing Care.”
Visit booth #4159 at the AACR Annual Meeting 2024 to connect with members of the Agingteam.
About Aging-US:
Agingpublishes research papers in all fields of aging research including but not limited, aging from yeast to mammals, cellular senescence, age-related diseases such as cancer and Alzheimer’s diseases and their prevention and treatment, anti-aging strategies and drug development and especially the role of signal transduction pathways such as mTOR in aging and potential approaches to modulate these signaling pathways to extend lifespan. The journal aims to promote treatment of age-related diseases by slowing down aging, validation of anti-aging drugs by treating age-related diseases, prevention of cancer by inhibiting aging. Cancer and COVID-19 are age-related diseases.
Agingis indexed and archived byPubMed/Medline (abbreviated as “Aging (Albany NY)”), PubMed Central, Web of Science: Science Citation Index Expanded (abbreviated as “Aging‐US” and listed in the Cell Biology and Geriatrics & Gerontology categories), Scopus (abbreviated as “Aging” and listed in the Cell Biology and Aging categories), Biological Abstracts, BIOSIS Previews, EMBASE, META (Chan Zuckerberg Initiative) (2018-2022), and Dimensions (Digital Science).
Please visit our website at www.Aging-US.com and connect with us:
NY Fed Finds Medium, Long-Term Inflation Expectations Jump Amid Surge In Stock Market Optimism
One month after the inflation outlook tracked by the NY Fed Consumer Survey extended their late 2023 slide, with 3Y inflation expectations in January sliding to a record low 2.4% (from 2.6% in December), even as 1 and 5Y inflation forecasts remained flat, moments ago the NY Fed reported that in February there was a sharp rebound in longer-term inflation expectations, rising to 2.7% from 2.4% at the three-year ahead horizon, and jumping to 2.9% from 2.5% at the five-year ahead horizon, while the 1Y inflation outlook was flat for the 3rd month in a row, stuck at 3.0%.
The increases in both the three-year ahead and five-year ahead measures were most pronounced for respondents with at most high school degrees (in other words, the "really smart folks" are expecting deflation soon). The survey’s measure of disagreement across respondents (the difference between the 75th and 25th percentile of inflation expectations) decreased at all horizons, while the median inflation uncertainty—or the uncertainty expressed regarding future inflation outcomes—declined at the one- and three-year ahead horizons and remained unchanged at the five-year ahead horizon.
Going down the survey, we find that the median year-ahead expected price changes increased by 0.1 percentage point to 4.3% for gas; decreased by 1.8 percentage points to 6.8% for the cost of medical care (its lowest reading since September 2020); decreased by 0.1 percentage point to 5.8% for the cost of a college education; and surprisingly decreased by 0.3 percentage point for rent to 6.1% (its lowest reading since December 2020), and remained flat for food at 4.9%.
We find the rent expectations surprising because it is happening just asking rents are rising across the country.
At the same time as consumers erroneously saw sharply lower rents, median home price growth expectations remained unchanged for the fifth consecutive month at 3.0%.
Turning to the labor market, the survey found that the average perceived likelihood of voluntary and involuntary job separations increased, while the perceived likelihood of finding a job (in the event of a job loss) declined. "The mean probability of leaving one’s job voluntarily in the next 12 months also increased, by 1.8 percentage points to 19.5%."
Mean unemployment expectations - or the mean probability that the U.S. unemployment rate will be higher one year from now - decreased by 1.1 percentage points to 36.1%, the lowest reading since February 2022. Additionally, the median one-year-ahead expected earnings growth was unchanged at 2.8%, remaining slightly below its 12-month trailing average of 2.9%.
Turning to household finance, we find the following:
The median expected growth in household income remained unchanged at 3.1%. The series has been moving within a narrow range of 2.9% to 3.3% since January 2023, and remains above the February 2020 pre-pandemic level of 2.7%.
Median household spending growth expectations increased by 0.2 percentage point to 5.2%. The increase was driven by respondents with a high school degree or less.
Median year-ahead expected growth in government debt increased to 9.3% from 8.9%.
The mean perceived probability that the average interest rate on saving accounts will be higher in 12 months increased by 0.6 percentage point to 26.1%, remaining below its 12-month trailing average of 30%.
Perceptions about households’ current financial situations deteriorated somewhat with fewer respondents reporting being better off than a year ago. Year-ahead expectations also deteriorated marginally with a smaller share of respondents expecting to be better off and a slightly larger share of respondents expecting to be worse off a year from now.
The mean perceived probability that U.S. stock prices will be higher 12 months from now increased by 1.4 percentage point to 38.9%.
At the same time, perceptions and expectations about credit access turned less optimistic: "Perceptions of credit access compared to a year ago deteriorated with a larger share of respondents reporting tighter conditions and a smaller share reporting looser conditions compared to a year ago."
Also, a smaller percentage of consumers, 11.45% vs 12.14% in prior month, expect to not be able to make minimum debt payment over the next three months
Last, and perhaps most humorous, is the now traditional cognitive dissonance one observes with these polls, because at a time when long-term inflation expectations jumped, which clearly suggests that financial conditions will need to be tightened, the number of respondents expecting higher stock prices one year from today jumped to the highest since November 2021... which incidentally is just when the market topped out during the last cycle before suffering a painful bear market.
We use cookies on our website to give you the most relevant experience by remembering your preferences and repeat visits. By clicking “Accept”, you consent to the use of ALL the cookies.
This website uses cookies to improve your experience while you navigate through the website. Out of these, the cookies that are categorized as necessary are stored on your browser as they are essential for the working of basic functionalities of the website. We also use third-party cookies that help us analyze and understand how you use this website. These cookies will be stored in your browser only with your consent. You also have the option to opt-out of these cookies. But opting out of some of these cookies may affect your browsing experience.
Necessary cookies are absolutely essential for the website to function properly. These cookies ensure basic functionalities and security features of the website, anonymously.
Cookie
Duration
Description
cookielawinfo-checbox-analytics
11 months
This cookie is set by GDPR Cookie Consent plugin. The cookie is used to store the user consent for the cookies in the category "Analytics".
cookielawinfo-checbox-functional
11 months
The cookie is set by GDPR cookie consent to record the user consent for the cookies in the category "Functional".
cookielawinfo-checbox-others
11 months
This cookie is set by GDPR Cookie Consent plugin. The cookie is used to store the user consent for the cookies in the category "Other.
cookielawinfo-checkbox-necessary
11 months
This cookie is set by GDPR Cookie Consent plugin. The cookies is used to store the user consent for the cookies in the category "Necessary".
cookielawinfo-checkbox-performance
11 months
This cookie is set by GDPR Cookie Consent plugin. The cookie is used to store the user consent for the cookies in the category "Performance".
viewed_cookie_policy
11 months
The cookie is set by the GDPR Cookie Consent plugin and is used to store whether or not user has consented to the use of cookies. It does not store any personal data.
Functional cookies help to perform certain functionalities like sharing the content of the website on social media platforms, collect feedbacks, and other third-party features.
Performance cookies are used to understand and analyze the key performance indexes of the website which helps in delivering a better user experience for the visitors.
Analytical cookies are used to understand how visitors interact with the website. These cookies help provide information on metrics the number of visitors, bounce rate, traffic source, etc.
Advertisement cookies are used to provide visitors with relevant ads and marketing campaigns. These cookies track visitors across websites and collect information to provide customized ads.


