Connect with us

Government

Virtual follow-up care is more convenient and just as beneficial to surgical patients

Virtual follow-up care is more convenient and just as beneficial to surgical patients

Published

on

Surgeons find that shifting to virtual visits could be a way to improve patient-centered care, satisfy busy patients

IMAGE

Credit: American College of Surgeons

CHICAGO: Surgical patients who participate in virtual follow-up visits after their operations spend a similar amount of time with surgical team members as those who meet face-to-face. Moreover, these patients benefit by spending less time waiting at and traveling to the clinic for in-person appointments, according to research findings presented at the virtual American College of Surgeons Clinical Congress 2020.

“I think it’s really valuable for patients to understand that, in the virtual space scenario, they are still going to get quality time with their surgical team,” said lead study author Caroline Reinke, MD, FACS, associate professor of surgery at Atrium Health in Charlotte, N.C. “A virtual appointment does not shorten that time, and there is still an ability to answer questions, connect, and address ongoing medical care.”

Due to the Coronavirus Disease 2019 (COVID-19) pandemic and the widespread adoption of technology, many surgical patients are being offered virtual appointments in place of traditional in-person visits. The researchers say this is one of the first studies to look at how patients spend their time in post-operative virtual visits compared with face-to-face consultations.

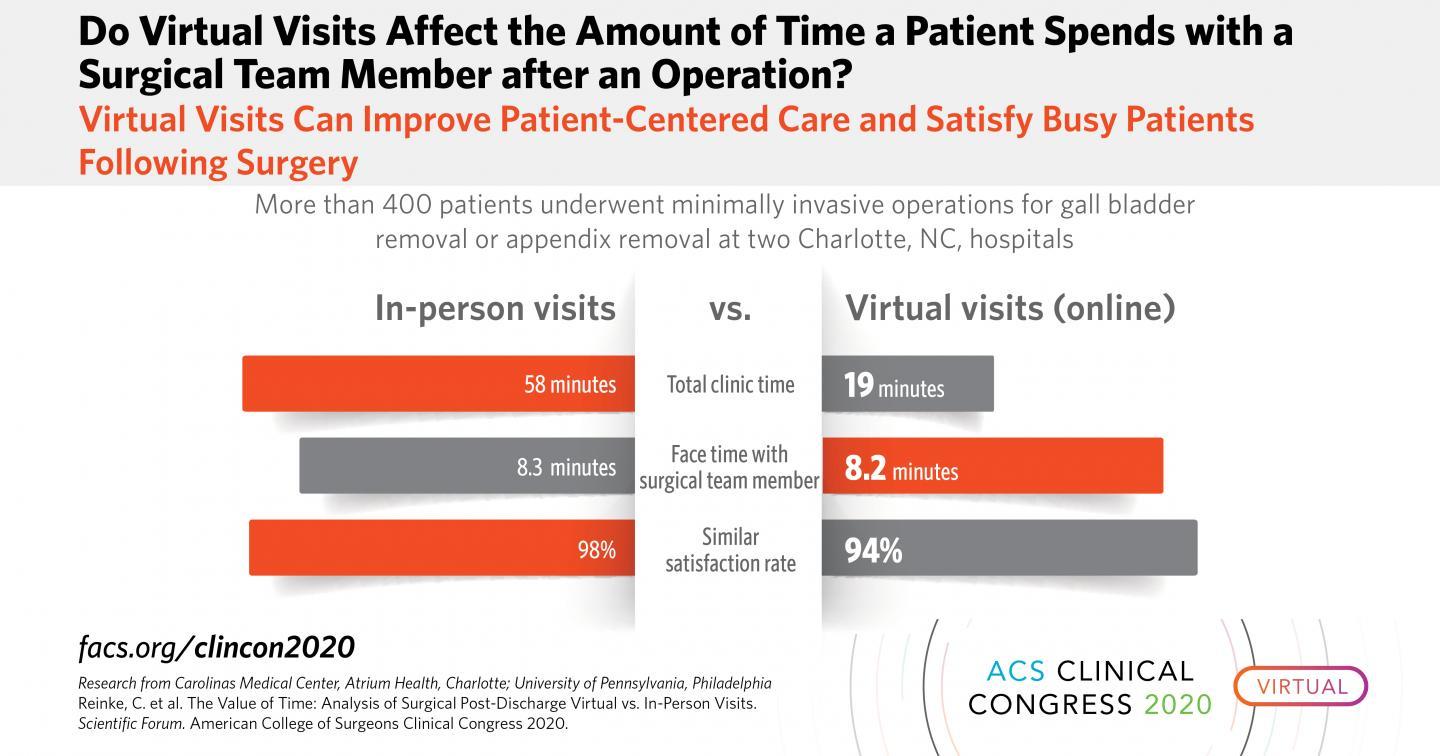
The study design was a non-inferiority, randomized controlled trial that involved more than 400 patients who underwent laparoscopic appendectomy or cholecystectomy at two hospitals in Charlotte, N.C. and were randomized 2:1 to a post-discharge virtual visit or to an in-person visit. The study began in August 2017 but was put on hold in March 2020 due to COVID-19.

“Other studies have looked at the total visit time, but they haven’t been able to break down the specific amount of time the patient spends with the provider. And we wanted to know if that was the same or different between a virtual visit and an in-person visit,” Dr. Reinke said. “We wanted to get down to the nitty gritty of how much face time was actually being spent between the surgical team member and the patient.”

Researchers tracked total time the patients spent checking in, waiting in the waiting room and exam room, meeting with the surgical team member, and being discharged after the exam. For in-person visits, on-site waiting time and an estimated drive time was factored into the overall time commitment.

Just 64 percent of patients completed the follow-up visit. “Sometimes, patients are doing so well after minimally invasive surgery that about 30 percent of these patients don’t show up for a post-operative visit,” Dr. Reinke said.

Overall, results showed that the total clinic time was longer for in-person visits than virtual visits (58 minutes vs. 19 minutes). However, patients in both groups spent the same amount of face time with a member of their surgical team (8.3 minutes vs. 8.2 minutes) discussing their post-operative recovery.

“I was pleasantly surprised that the amount of time patients spent with the surgical team member was the same, because one of the main concerns with virtual visits is that patients feel disconnected and that there isn’t as much value in it,” Dr. Reinke said.

Importantly, patients placed a high value on convenience and flexibility. “We received overwhelmingly positive responses to this patient-centered care option.” Dr. Reinke said. “Patients were able to do the post-operative visit at work or at home while caring for children, without having to disrupt their day in such a significant way.”

The researchers also found that patients embraced the virtual scenario. The satisfaction rate between both groups of patients was similar (94 percent vs. 98 percent).

In addition, wait time was much less for patients who got virtual care. “Even for virtual visits, the amount of time the patients spent checking in and waiting was about 55 percent of total time. Because virtual visits have the same regulations as in-person visits, even if you take out the components of waiting room and patient flow within the clinic, patients are still spending about half of their time on the logistics of check in,” Dr. Reinke. “Yet, with virtual visits, there is still much less time spent waiting, about 80 percent less time.”

Still, some patients are not comfortable with the technology. The number of patients who couldn’t or didn’t want to do a virtual visit was higher than expected, according to the authors.

“I think there are some patients that would really just rather come in and shake someone’s hand,” Dr. Reinke said. “I think for surgery it’s a little bit different, because with surgical care there are incisions to check on. However, we were able to check on incisions pretty easily, having patients show us their incisions virtually on the video screen.”

###

Coauthors are Kristen Harkey, DNP; Nicole Kaiser, BS; Brent Duane Matthews, MD, FACS; Rachel Kelz, MD, FACS; and Michael Inman, BS.

This research was supported by the American College of Surgeons Franklin H. Martin Faculty Research Fellowship.
“FACS” designates that a surgeon is a Fellow of the American College of Surgeons.

Citation: The Value of Time: Analysis of Surgical Post-Discharge Virtual vs. In-Person Visits. Scientific Forum, American College of Surgeons Clinical Congress 2020, October 3-7, 2020.

About the American College of Surgeons

The American College of Surgeons is a scientific and educational organization of surgeons that was founded in 1913 to raise the standards of surgical practice and improve the quality of care for all surgical patients. The College is dedicated to the ethical and competent practice of surgery. Its achievements have significantly influenced the course of scientific surgery in America and have established it as an important advocate for all surgical patients. The College has more than 82,000 members and is the largest organization of surgeons in the world. For more information, visit http://www.facs.org.

Media Contact
Sally Garneski
pressinquiry@facs.org

Read More

Continue Reading

International

Fuel poverty in England is probably 2.5 times higher than government statistics show

The top 40% most energy efficient homes aren’t counted as being in fuel poverty, no matter what their bills or income are.

Published

on

By

Julian Hochgesang|Unsplash

The cap set on how much UK energy suppliers can charge for domestic gas and electricity is set to fall by 15% from April 1 2024. Despite this, prices remain shockingly high. The average household energy bill in 2023 was £2,592 a year, dwarfing the pre-pandemic average of £1,308 in 2019.

The term “fuel poverty” refers to a household’s ability to afford the energy required to maintain adequate warmth and the use of other essential appliances. Quite how it is measured varies from country to country. In England, the government uses what is known as the low income low energy efficiency (Lilee) indicator.

Since energy costs started rising sharply in 2021, UK households’ spending powers have plummeted. It would be reasonable to assume that these increasingly hostile economic conditions have caused fuel poverty rates to rise.

However, according to the Lilee fuel poverty metric, in England there have only been modest changes in fuel poverty incidence year on year. In fact, government statistics show a slight decrease in the nationwide rate, from 13.2% in 2020 to 13.0% in 2023.

Our recent study suggests that these figures are incorrect. We estimate the rate of fuel poverty in England to be around 2.5 times higher than what the government’s statistics show, because the criteria underpinning the Lilee estimation process leaves out a large number of financially vulnerable households which, in reality, are unable to afford and maintain adequate warmth.

Blocks of flats in London.
Household fuel poverty in England is calculated on the basis of the energy efficiency of the home. Igor Sporynin|Unsplash

Energy security

In 2022, we undertook an in-depth analysis of Lilee fuel poverty in Greater London. First, we combined fuel poverty, housing and employment data to provide an estimate of vulnerable homes which are omitted from Lilee statistics.

We also surveyed 2,886 residents of Greater London about their experiences of fuel poverty during the winter of 2022. We wanted to gauge energy security, which refers to a type of self-reported fuel poverty. Both parts of the study aimed to demonstrate the potential flaws of the Lilee definition.

Introduced in 2019, the Lilee metric considers a household to be “fuel poor” if it meets two criteria. First, after accounting for energy expenses, its income must fall below the poverty line (which is 60% of median income).

Second, the property must have an energy performance certificate (EPC) rating of D–G (the lowest four ratings). The government’s apparent logic for the Lilee metric is to quicken the net-zero transition of the housing sector.

In Sustainable Warmth, the policy paper that defined the Lilee approach, the government says that EPC A–C-rated homes “will not significantly benefit from energy-efficiency measures”. Hence, the focus on fuel poverty in D–G-rated properties.

Generally speaking, EPC A–C-rated homes (those with the highest three ratings) are considered energy efficient, while D–G-rated homes are deemed inefficient. The problem with how Lilee fuel poverty is measured is that the process assumes that EPC A–C-rated homes are too “energy efficient” to be considered fuel poor: the main focus of the fuel poverty assessment is a characteristic of the property, not the occupant’s financial situation.

In other words, by this metric, anyone living in an energy-efficient home cannot be considered to be in fuel poverty, no matter their financial situation. There is an obvious flaw here.

Around 40% of homes in England have an EPC rating of A–C. According to the Lilee definition, none of these homes can or ever will be classed as fuel poor. Even though energy prices are going through the roof, a single-parent household with dependent children whose only income is universal credit (or some other form of benefits) will still not be considered to be living in fuel poverty if their home is rated A-C.

The lack of protection afforded to these households against an extremely volatile energy market is highly concerning.

In our study, we estimate that 4.4% of London’s homes are rated A-C and also financially vulnerable. That is around 171,091 households, which are currently omitted by the Lilee metric but remain highly likely to be unable to afford adequate energy.

In most other European nations, what is known as the 10% indicator is used to gauge fuel poverty. This metric, which was also used in England from the 1990s until the mid 2010s, considers a home to be fuel poor if more than 10% of income is spent on energy. Here, the main focus of the fuel poverty assessment is the occupant’s financial situation, not the property.

Were such alternative fuel poverty metrics to be employed, a significant portion of those 171,091 households in London would almost certainly qualify as fuel poor.

This is confirmed by the findings of our survey. Our data shows that 28.2% of the 2,886 people who responded were “energy insecure”. This includes being unable to afford energy, making involuntary spending trade-offs between food and energy, and falling behind on energy payments.

Worryingly, we found that the rate of energy insecurity in the survey sample is around 2.5 times higher than the official rate of fuel poverty in London (11.5%), as assessed according to the Lilee metric.

It is likely that this figure can be extrapolated for the rest of England. If anything, energy insecurity may be even higher in other regions, given that Londoners tend to have higher-than-average household income.

The UK government is wrongly omitting hundreds of thousands of English households from fuel poverty statistics. Without a more accurate measure, vulnerable households will continue to be overlooked and not get the assistance they desperately need to stay warm.

The Conversation

Torran Semple receives funding from Engineering and Physical Sciences Research Council (EPSRC) grant EP/S023305/1.

John Harvey does not work for, consult, own shares in or receive funding from any company or organisation that would benefit from this article, and has disclosed no relevant affiliations beyond their academic appointment.

Read More

Continue Reading

International

Looking Back At COVID’s Authoritarian Regimes

After having moved from Canada to the United States, partly to be wealthier and partly to be freer (those two are connected, by the way), I was shocked,…

Published

on

After having moved from Canada to the United States, partly to be wealthier and partly to be freer (those two are connected, by the way), I was shocked, in March 2020, when President Trump and most US governors imposed heavy restrictions on people’s freedom. The purpose, said Trump and his COVID-19 advisers, was to “flatten the curve”: shut down people’s mobility for two weeks so that hospitals could catch up with the expected demand from COVID patients. In her book Silent Invasion, Dr. Deborah Birx, the coordinator of the White House Coronavirus Task Force, admitted that she was scrambling during those two weeks to come up with a reason to extend the lockdowns for much longer. As she put it, “I didn’t have the numbers in front of me yet to make the case for extending it longer, but I had two weeks to get them.” In short, she chose the goal and then tried to find the data to justify the goal. This, by the way, was from someone who, along with her task force colleague Dr. Anthony Fauci, kept talking about the importance of the scientific method. By the end of April 2020, the term “flatten the curve” had all but disappeared from public discussion.

Now that we are four years past that awful time, it makes sense to look back and see whether those heavy restrictions on the lives of people of all ages made sense. I’ll save you the suspense. They didn’t. The damage to the economy was huge. Remember that “the economy” is not a term used to describe a big machine; it’s a shorthand for the trillions of interactions among hundreds of millions of people. The lockdowns and the subsequent federal spending ballooned the budget deficit and consequent federal debt. The effect on children’s learning, not just in school but outside of school, was huge. These effects will be with us for a long time. It’s not as if there wasn’t another way to go. The people who came up with the idea of lockdowns did so on the basis of abstract models that had not been tested. They ignored a model of human behavior, which I’ll call Hayekian, that is tested every day.

These are the opening two paragraphs of my latest Defining Ideas article, “Looking Back at COVID’s Authoritarian Regimes,” Defining Ideas, March 14, 2024.

Another excerpt:

That wasn’t the only uncertainty. My daughter Karen lived in San Francisco and made her living teaching Pilates. San Francisco mayor London Breed shut down all the gyms, and so there went my daughter’s business. (The good news was that she quickly got online and shifted many of her clients to virtual Pilates. But that’s another story.) We tried to see her every six weeks or so, whether that meant our driving up to San Fran or her driving down to Monterey. But were we allowed to drive to see her? In that first month and a half, we simply didn’t know.

Read the whole thing, which is longer than usual.

(0 COMMENTS)

Read More

Continue Reading

International

Problems After COVID-19 Vaccination More Prevalent Among Naturally Immune: Study

Problems After COVID-19 Vaccination More Prevalent Among Naturally Immune: Study

Authored by Zachary Stieber via The Epoch Times (emphasis…

Published

on

Problems After COVID-19 Vaccination More Prevalent Among Naturally Immune: Study

Authored by Zachary Stieber via The Epoch Times (emphasis ours),

People who recovered from COVID-19 and received a COVID-19 shot were more likely to suffer adverse reactions, researchers in Europe are reporting.

A medical worker administers a dose of the Pfizer-BioNTech COVID-19 vaccine to a patient at a vaccination center in Ancenis-Saint-Gereon, France, on Nov. 17, 2021. (Stephane Mahe//Reuters)

Participants in the study were more likely to experience an adverse reaction after vaccination regardless of the type of shot, with one exception, the researchers found.

Across all vaccine brands, people with prior COVID-19 were 2.6 times as likely after dose one to suffer an adverse reaction, according to the new study. Such people are commonly known as having a type of protection known as natural immunity after recovery.

People with previous COVID-19 were also 1.25 times as likely after dose 2 to experience an adverse reaction.

The findings held true across all vaccine types following dose one.

Of the female participants who received the Pfizer-BioNTech vaccine, for instance, 82 percent who had COVID-19 previously experienced an adverse reaction after their first dose, compared to 59 percent of females who did not have prior COVID-19.

The only exception to the trend was among males who received a second AstraZeneca dose. The percentage of males who suffered an adverse reaction was higher, 33 percent to 24 percent, among those without a COVID-19 history.

Participants who had a prior SARS-CoV-2 infection (confirmed with a positive test) experienced at least one adverse reaction more often after the 1st dose compared to participants who did not have prior COVID-19. This pattern was observed in both men and women and across vaccine brands,” Florence van Hunsel, an epidemiologist with the Netherlands Pharmacovigilance Centre Lareb, and her co-authors wrote.

There were only slightly higher odds of the naturally immune suffering an adverse reaction following receipt of a Pfizer or Moderna booster, the researchers also found.

The researchers performed what’s known as a cohort event monitoring study, following 29,387 participants as they received at least one dose of a COVID-19 vaccine. The participants live in a European country such as Belgium, France, or Slovakia.

Overall, three-quarters of the participants reported at least one adverse reaction, although some were minor such as injection site pain.

Adverse reactions described as serious were reported by 0.24 percent of people who received a first or second dose and 0.26 percent for people who received a booster. Different examples of serious reactions were not listed in the study.

Participants were only specifically asked to record a range of minor adverse reactions (ADRs). They could provide details of other reactions in free text form.

“The unsolicited events were manually assessed and coded, and the seriousness was classified based on international criteria,” researchers said.

The free text answers were not provided by researchers in the paper.

The authors note, ‘In this manuscript, the focus was not on serious ADRs and adverse events of special interest.’” Yet, in their highlights section they state, “The percentage of serious ADRs in the study is low for 1st and 2nd vaccination and booster.”

Dr. Joel Wallskog, co-chair of the group React19, which advocates for people who were injured by vaccines, told The Epoch Times: “It is intellectually dishonest to set out to study minor adverse events after COVID-19 vaccination then make conclusions about the frequency of serious adverse events. They also fail to provide the free text data.” He added that the paper showed “yet another study that is in my opinion, deficient by design.”

Ms. Hunsel did not respond to a request for comment.

She and other researchers listed limitations in the paper, including how they did not provide data broken down by country.

The paper was published by the journal Vaccine on March 6.

The study was funded by the European Medicines Agency and the Dutch government.

No authors declared conflicts of interest.

Some previous papers have also found that people with prior COVID-19 infection had more adverse events following COVID-19 vaccination, including a 2021 paper from French researchers. A U.S. study identified prior COVID-19 as a predictor of the severity of side effects.

Some other studies have determined COVID-19 vaccines confer little or no benefit to people with a history of infection, including those who had received a primary series.

The U.S. Centers for Disease Control and Prevention still recommends people who recovered from COVID-19 receive a COVID-19 vaccine, although a number of other health authorities have stopped recommending the shot for people who have prior COVID-19.

Another New Study

In another new paper, South Korean researchers outlined how they found people were more likely to report certain adverse reactions after COVID-19 vaccination than after receipt of another vaccine.

The reporting of myocarditis, a form of heart inflammation, or pericarditis, a related condition, was nearly 20 times as high among children as the reporting odds following receipt of all other vaccines, the researchers found.

The reporting odds were also much higher for multisystem inflammatory syndrome or Kawasaki disease among adolescent COVID-19 recipients.

Researchers analyzed reports made to VigiBase, which is run by the World Health Organization.

Based on our results, close monitoring for these rare but serious inflammatory reactions after COVID-19 vaccination among adolescents until definitive causal relationship can be established,” the researchers wrote.

The study was published by the Journal of Korean Medical Science in its March edition.

Limitations include VigiBase receiving reports of problems, with some reports going unconfirmed.

Funding came from the South Korean government. One author reported receiving grants from pharmaceutical companies, including Pfizer.

Tyler Durden Fri, 03/15/2024 - 05:00

Read More

Continue Reading

Trending