Unum Group Reports Second Quarter 2022 Results
Unum Group Reports Second Quarter 2022 Results
PR Newswire
CHATTANOOGA, Tenn., Aug. 2, 2022
Net income of $370.4 million ($1.83 per diluted common share) for the second quarter of 2022; after-tax adjusted operating income was $386.6 million ($1.91 …
Share this:


Unum Group Reports Second Quarter 2022 Results
PR Newswire
CHATTANOOGA, Tenn., Aug. 2, 2022
- Net income of $370.4 million ($1.83 per diluted common share) for the second quarter of 2022; after-tax adjusted operating income was $386.6 million ($1.91 per diluted common share).
- Results reflect improving trend in COVID-related mortality impacts, strong operating performance, and favorable sales and premium trends in core business segments.
- Strong balance sheet and liquidity with holding company liquidity of $1.2 billion and weighted average risk-based capital ratio of approximately 415 percent.
- Full-year 2022 outlook increased; after-tax adjusted operating income per share now expected to grow 40 percent to 45 percent relative to full-year 2021, compared to the previous outlook of an increase of 15 percent to 20 percent.
- Book value per common share of $48.47 declined 9.5 percent over the year-ago quarter; book value per common share excluding accumulated other comprehensive income (loss) (AOCI) grew 9.2 percent over the year-ago quarter to $57.32.
CHATTANOOGA, Tenn., Aug. 2, 2022 /PRNewswire/ -- Unum Group (NYSE: UNM) today reported net income of $370.4 million ($1.83 per diluted common share) for the second quarter of 2022, compared to net income of $182.9 million ($0.89 per diluted common share) for the second quarter of 2021.
Included in net income for the second quarter of 2022 are the after-tax amortization of the cost of reinsurance of $13.1 million ($0.06 per diluted common share) and a net after-tax investment loss on the Company's investment portfolio of $3.1 million ($0.02 per diluted common share). Included in net income for the second quarter of 2021 are after-tax costs related to the early retirement of debt of $53.2 million ($0.26 per diluted common share), an after-tax impairment loss on the right-of-use (ROU) asset related to one of our operating leases for office space that we are no longer using to support our general operations of $11.0 million ($0.05 per diluted common share), the net tax expense related to a U.K. tax rate increase of $24.2 million ($0.12 per diluted common share), the after-tax amortization of the cost of reinsurance of $15.5 million ($0.08 per diluted common share), as well as a net after-tax investment gain on the Company's investment portfolio of $0.6 million ($0.01 per diluted common share). Excluding the items above, after-tax adjusted operating income was $386.6 million ($1.91 per diluted common share) in the second quarter of 2022, compared to $286.2 million ($1.39 per diluted common share) in the second quarter of 2021.
"Our strong second quarter results were driven by continued growth in premium income across our core business segments and positive benefits experience," said Richard P. McKenney, president and chief executive officer. "The current business environment remains favorable, and our capital strength provides continued financial flexibility. These factors, combined with our team's consistent execution, enable us to increase our outlook for growth in 2022."
RESULTS BY SEGMENT
We measure and analyze our segment performance on the basis of "adjusted operating income" or "adjusted operating loss", which differ from income before income tax as presented in our consolidated statements of income due to the exclusion of investment gains and losses, amortization of cost of reinsurance, and certain other items. Investment gains or losses primarily include realized investment gains or losses, expected investment credit losses, and gains or losses on derivatives. These performance measures are in accordance with GAAP guidance for segment reporting, but they should not be viewed as a substitute for income before income tax or net income.
Unum US Segment
Unum US reported adjusted operating income of $295.4 million in the second quarter of 2022, an increase of 64.8 percent from $179.3 million in the second quarter of 2021. Premium income increased 3.3 percent to $1,572.3 million in the second quarter of 2022, compared to $1,522.1 million in the second quarter of 2021. Net investment income decreased 8.6 percent to $167.8 million in the second quarter of 2022, compared to $183.6 million in the second quarter of 2021.
Within the Unum US operating segment, the group disability line of business reported a 79.5 percent increase in adjusted operating income to $107.5 million in the second quarter of 2022, compared to $59.9 million in the second quarter of 2021. Premium income for the group disability line of business increased 5.1 percent to $706.5 million in the second quarter of 2022, compared to $672.2 million in the second quarter of 2021 due primarily to in-force block growth, favorable persistency, and higher sales across all product lines. Net investment income decreased 6.9 percent to $87.5 million in the second quarter of 2022, compared to $94.0 million in the second quarter of 2021, driven by lower miscellaneous investment income and a decrease in the yield on invested assets. The benefit ratio for the second quarter of 2022 was 66.4 percent, compared to 74.7 percent in the second quarter of 2021, due primarily to favorable claim recoveries in the group long-term disability product line as well as lower claims incidence in both the group short-term and long-term disability product lines. Group long-term disability sales were $63.2 million in the second quarter of 2022, an increase of 50.5 percent from $42.0 million in the second quarter of 2021. Group short-term disability sales were $36.3 million in the second quarter of 2022, an increase of 16.3 percent from $31.2 million in the second quarter of 2021. Persistency in the group long-term disability product line was 90.9 percent for the first half of 2022, compared to 90.1 percent for the first half of 2021. Persistency in the group short-term disability product line was 89.2 percent for the first half of 2022, compared to 87.2 percent for the first half of 2021.
The group life and accidental death and dismemberment line of business reported an adjusted operating income of $67.3 million in the second quarter of 2022, compared to $5.2 million in the second quarter of 2021. Premium income for this line of business increased 1.5 percent to $463.4 million in the second quarter of 2022, compared to $456.6 million in the second quarter of 2021 driven by in-force block growth, partially offset by lower persistency. Net investment income decreased 7.4 percent to $24.9 million in the second quarter of 2022, compared to $26.9 million in the second quarter of 2021, due to lower miscellaneous investment income, partially offset by a higher level of invested assets. The benefit ratio in the second quarter of 2022 was 70.7 percent, compared to 85.2 percent in the second quarter of 2021, largely due to lower mortality in the group life product line, resulting primarily from lessening impacts of COVID-19 on our insured population. Sales of group life and accidental death and dismemberment products increased 20.7 percent in the second quarter of 2022 to $77.0 million, compared to $63.8 million in the second quarter of 2021. Persistency in the group life product line was 89.4 percent for the first half of 2022, compared to 90.1 percent for the first half of 2021. Persistency in the accidental death and dismemberment product line was 88.2 percent for the first half of 2022, compared to 89.6 percent for the first half of 2021.
The supplemental and voluntary line of business reported an increase of 5.6 percent in adjusted operating income to $120.6 million in the second quarter of 2022, compared to $114.2 million in the second quarter of 2021. Premium income for the supplemental and voluntary line of business increased 2.3 percent to $402.4 million in the second quarter of 2022, compared to $393.3 million in the second quarter of 2021, with growth across all product lines due primarily to generally favorable persistency and higher sales. Net investment income decreased 11.6 percent to $55.4 million in the second quarter of 2022, compared to $62.7 million in the second quarter of 2021, due primarily to lower miscellaneous investment income, a decline on yield on invested assets, and a decrease in the level of invested assets. The benefit ratio for the voluntary benefits product line was 40.8 percent in the second quarter of 2022, compared to 44.2 percent for the second quarter of 2021, due primarily to favorable claims experience in the critical illness product line. The benefit ratio for the individual disability product line was 41.3 percent for the second quarter of 2022, compared to 48.4 percent for the second quarter of 2021, due primarily to lower claims activity. The benefit ratio for the dental and vision product line was 72.9 percent for the second quarter of 2022, compared to 77.1 percent for the second quarter of 2021, due primarily to lower claims incidence. Relative to the second quarter of 2021, sales in the voluntary benefits product line increased 23.6 percent in the second quarter of 2022 to $54.0 million. Sales in the individual disability product line increased 25.5 percent in the second quarter of 2022 to $18.7 million. Sales in the dental and vision product line totaled $12.9 million for the second quarter of 2022, a decrease of 0.8 percent compared to the second quarter of 2021. Persistency in the voluntary benefits product line was 75.8 percent for the first half of 2022, compared to 74.5 percent for the first half of 2021. Persistency in the individual disability product line was 89.4 percent for the first half of 2022, compared to 89.0 percent for the first half of 2021. Persistency in the dental and vision product line was 82.0 percent for the first half of 2022, compared to 86.6 percent for the first half of 2021.
Unum International
The Unum International segment reported adjusted operating income of $24.9 million in the second quarter of 2022, an increase of 0.4 percent from $24.8 million in the second quarter of 2021. Premium income decreased 2.2 percent to $179.4 million in the second quarter of 2022, compared to $183.5 million in the second quarter of 2021. Net investment income increased 42.3 percent to $50.8 million in the second quarter of 2022, compared to $35.7 million in the second quarter of 2021. Sales increased 8.2 percent to $35.8 million in the second quarter of 2022, compared to $33.1 million in the second quarter of 2021. For the second quarter of 2022, Unum International results were unfavorably impacted by fluctuations in the British pound sterling to U.S. dollar exchange rate relative to the second quarter of 2021.
The Unum UK line of business reported adjusted operating income, in local currency, of £19.3 million in the second quarter of 2022, an increase of 14.9 percent from £16.8 million in the second quarter of 2021. Premium income was £125.0 million in the second quarter of 2022, an increase of 8.6 percent from £115.1 million in the second quarter of 2021, due to in-force block growth. Net investment income was £39.2 million in the second quarter of 2022, an increase of 61.3 percent from £24.3 million in the second quarter of 2021, due primarily to higher investment income from inflation index-linked bonds. The benefit ratio in the second quarter of 2022 was 89.7 percent, compared to 82.5 percent in the second quarter of 2021, due to higher inflation-linked experience in benefits, lower claim terminations in the group long-term disability product line, and higher claim incidence in our group critical illness product line. Sales increased 20.3 percent to £25.5 million in the second quarter of 2022, compared to £21.2 million in the second quarter of 2021. Persistency in the group long-term disability product line was 87.4 percent for the first half of 2022, compared to 89.4 percent for the first half of 2021. Persistency in the group life product line was 88.1 percent for the first half of 2022, compared to 84.3 percent for the first half of 2021. Persistency in the supplemental product line was 91.5 percent for the first half of 2022, compared to 89.2 percent for the first half of 2021.
Colonial Life Segment
Colonial Life reported a 5.5 percent increase in adjusted operating income to $101.1 million in the second quarter of 2022, compared to $95.8 million in the second quarter of 2021. Premium income increased 1.9 percent to $427.6 million in the second quarter of 2022, compared to $419.7 million in the second quarter of 2021, due to higher sales in prior periods and higher overall persistency. Net investment income decreased 7.0 percent to $38.7 million in the second quarter of 2022, compared to the $41.6 million in the second quarter of 2021, due to lower miscellaneous investment income and a decline in the yield on invested assets, partially offset by an increase in the level of invested assets. The benefit ratio was 47.6 percent in the second quarter of 2022, compared to 51.7 percent in the second quarter of 2021, due primarily to favorable claim experience across all products.
Sales increased 6.4 percent to $118.2 million in the second quarter of 2022, compared to $111.1 million in the second quarter of 2021. Persistency in Colonial Life was 78.6 percent for the first half of 2022, compared to 78.3 percent for the first half of 2021.
Closed Block Segment
The Closed Block segment reported adjusted operating income of $79.3 million in the second quarter of 2022, compared to $111.2 million in the second quarter of 2021. Excluded from adjusted operating income for the second quarter of 2022 and 2021 is the amortization of the cost of reinsurance related to the Closed Block individual disability reinsurance transaction of $16.6 million and $19.7 million, respectively. Premium income for this segment decreased 4.5 percent to $238.0 million in the second quarter of 2022, compared to $249.1 million in the second quarter of 2021, due to policy terminations and maturities, partially offset by rate increases. Net investment income decreased 1.1 percent to $291.5 million in the second quarter of 2022, compared to $294.7 million in the second quarter of 2021, due to a decline in the yield on invested assets and lower miscellaneous investment income, partially offset by an increase in the level of invested assets.
The interest adjusted loss ratio for the long-term care line of business was 85.9 percent in the second quarter of 2022, compared to an interest adjusted loss ratio of 74.6 percent in the second quarter of 2021, driven by lower claim terminations. The interest adjusted loss ratio for long-term care for the rolling twelve months ended June 30, 2022, excluding the reserve increase of $2.1 million related to the assumption updates in the third quarter of 2021, was 78.3 percent which is below our long-term expected range. The interest adjusted loss ratio for the individual disability line of business was 79.5 percent in the second quarter of 2022, compared to 69.6 percent in the second quarter of 2021, due primarily to volatility as a result of the relatively small amount of business retained.
Corporate Segment
The Corporate segment reported an adjusted operating loss of $36.9 million in the second quarter of 2022, compared to an adjusted operating loss of $48.5 million in the second quarter of 2021, which excludes the before-tax cost related to the early retirement of debt of $67.3 million and the before-tax impairment loss on the ROU asset of $13.9 million.
OTHER INFORMATION
Shares Outstanding
The Company's weighted average number of shares outstanding, assuming dilution, was 202.4 million for the second quarter of 2022, compared to 205.3 million for the second quarter of 2021. Shares outstanding totaled 200.2 million at June 30, 2022. During the second quarter of 2022, the final settlement of the accelerated share repurchase agreement executed in the first quarter of 2022 was completed with the delivery to us of approximately 0.4 million shares at a cost of $12.5 million. In addition, the Company repurchased approximately 1.4 million shares in open market transactions at a cost of approximately $44.9 million. For the first half of 2022, the Company has repurchased approximately 3.1 million shares at a cost of $94.9 million.
Capital Management
At June 30, 2022, the weighted average risk-based capital ratio for the Company's traditional U.S. insurance companies was approximately 415 percent, and the holding companies had available holding company liquidity of $1,177.0 million.
Book Value
Book value per common share as of June 30, 2022 was $48.47, compared to $53.57 at June 30, 2021. Book value per common share excluding AOCI as of June 30, 2022 was $57.32, compared to $52.49 at June 30, 2021.
Outlook
The Company expects positive operating trends in our core business during 2022, with solid premium growth and improving claim experience as impacts from COVID-19 lessen. The Company also anticipates an increase in after-tax adjusted operating income per share of 40 percent to 45 percent relative to full-year 2021, compared to its previous outlook of an increase of 15 percent to 20 percent. The increased expectation reflects the Company's strong first half performance and an improved outlook for the balance of 2022.
NON-GAAP FINANCIAL MEASURES
We analyze our performance using non-GAAP financial measures. A non-GAAP financial measure is a numerical measure of a company's performance, financial position, or cash flows that excludes or includes amounts that are not normally excluded or included in the most directly comparable measure calculated and presented in accordance with GAAP. The non-GAAP financial measure of "after-tax adjusted operating income" differs from net income as presented in our consolidated operating results and income statements prepared in accordance with GAAP due to the exclusion of investment gains or losses and the amortization of the cost of reinsurance as well as certain other items as specified in the reconciliations in the Financial Highlights section below. Investment gains or losses primarily include realized investment gains or losses, expected investment credit losses, and gains or losses on derivatives. We believe after-tax adjusted operating income is a better performance measure and better indicator of the profitability and underlying trends in our business.
Investment gains or losses depend on market conditions and do not necessarily relate to decisions regarding the underlying business of our segments. Our investment focus is on investment income to support our insurance liabilities as opposed to the generation of investment gains or losses. Although we may experience investment gains or losses which will affect future earnings levels, a long-term focus is necessary to maintain profitability over the life of the business since our underlying business is long-term in nature, and we need to earn the interest rates assumed in calculating our liabilities.
We have exited a substantial portion of our Closed Block individual disability product line through the two phases of the reinsurance transaction that were executed in December 2020 and March 2021, respectively. As a result, we exclude the amortization of the cost of reinsurance that was recognized upon the exit of the business related to the ceded reserves for the cohort of policies on claim status. We believe that the exclusion of the amortization of the cost of reinsurance provides a better view of our results from our ongoing businesses.
We may at other times exclude certain other items from our discussion of financial ratios and metrics in order to enhance the understanding and comparability of our operational performance and the underlying fundamentals, but this exclusion is not an indication that similar items may not recur and does not replace net income or net loss as a measure of our overall profitability.
CONFERENCE CALL INFORMATION
Members of Unum Group senior management will host a conference call on Wednesday, August 3, at 8:00 a.m. (Eastern Time) to discuss the results of operations for the second quarter. Topics may include forward-looking information, such as the Company's outlook on future results, trends in operations, and other material information.
The dial-in number for the conference call is 1-844-200-6205 for callers in the U.S. (access code 573667). For callers in Canada the dial-in is 1-833-950-0062 (access code 573667). For all other callers, the dial-in number is 1-929-526-1599 (access code 573667). A live webcast of the call will also be available at www.investors.unum.com in a listen-only mode. It is recommended that webcast viewers access the Investors section of the Company's website and opt-in to the webcast approximately 10 minutes prior to the start of the call. A replay of the webcast will be available on the Company's website, and will be available through Wednesday, August 10 by dialing 1-866-813-9403 (U.S.), 1-226-828-7578 (Canada), 0204-525-0658 (U.K. local), or +44-204-525-0658 (All Other Locations) - access code 951720.
In conjunction with today's earnings announcement, the Company's Statistical Supplement for the second quarter of 2022 is available on the Investors section of the Company's website.
ABOUT UNUM GROUP
Unum Group (www.unum.com) an international provider of workplace benefits and services, has been helping workers and their families for more than 170 years. Through its Unum and Colonial Life brands, the company offers disability, life, accident, critical illness, dental, vision and stop-loss insurance; leave and absence management support and behavioral health services. In 2021, Unum reported revenues of $12.0 billion and paid $8.2 billion in benefits. The Fortune 250 company is one of the 2022 World's Most Ethical Companies, recognized by Ethisphere®.
For more information, connect with us on Facebook (www.facebook.com/unumbenefits), Twitter (www.twitter.com/unumnews) and LinkedIn (www.linkedin.com/company/unum).
SAFE HARBOR STATEMENT
Certain information in this news release constitutes "forward-looking statements" within the meaning of the Private Securities Litigation Reform Act of 1995. Forward-looking statements are those not based on historical information, but rather relate to our outlook, future operations, strategies, financial results, or other developments and speak only as of the date made. These forward-looking statements, including statements about anticipated growth in after-tax adjusted operating income per share, are subject to numerous assumptions, risks, and uncertainties, many of which are beyond our control. The following factors, in addition to other factors mentioned from time to time, may cause actual results to differ materially from those contemplated by the forward-looking statements: (1) the impact of COVID-19 on our business, financial position, results of operations, liquidity and capital resources, and overall business operations; (2) sustained periods of low interest rates; (3) fluctuation in insurance reserve liabilities and claim payments due to changes in claim incidence, recovery rates, mortality and morbidity rates, and policy benefit offsets due to, among other factors, the rate of unemployment and consumer confidence, the emergence of new diseases, epidemics, or pandemics, new trends and developments in medical treatments, the effectiveness of our claims operational processes, and changes in governmental programs; (4) unfavorable economic or business conditions, both domestic and foreign, that may result in decreases in sales, premiums, or persistency, as well as unfavorable claims activity; (5) changes in, or interpretations or enforcement of laws and regulations; (6) our ability to hire and retain qualified employees; (7) a cyber attack or other security breach could result in the unauthorized acquisition of confidential data; (8) the failure of our business recovery and incident management processes to resume our business operations in the event of a natural catastrophe, cyber attack, or other event; (9) investment results, including, but not limited to, changes in interest rates, defaults, changes in credit spreads, impairments, and the lack of appropriate investments in the market which can be acquired to match our liabilities; (10) increased competition from other insurers and financial services companies due to industry consolidation, new entrants to our markets, or other factors; (11) changes in our financial strength and credit ratings; (12) our ability to develop digital capabilities or execute on our technology systems upgrades or replacements; (13) actual experience in the broad array of our products that deviates from our assumptions used in pricing, underwriting, and reserving; (14) availability of reinsurance in the market and the ability of our reinsurers to meet their obligations to us; (15) ability to generate sufficient internal liquidity and/or obtain external financing; (16) damage to our reputation due to, among other factors, regulatory investigations, legal proceedings, external events, and/or inadequate or failed internal controls and procedures; (17) recoverability and/or realization of the carrying value of our intangible assets, long-lived assets, and deferred tax assets; (18) effectiveness of our risk management program; (19) contingencies and the level and results of litigation; (20) ineffectiveness of our derivatives hedging programs due to changes in the economic environment, counterparty risk, ratings downgrades, capital market volatility, changes in interest rates, and/or regulation; (21) fluctuation in foreign currency exchange rates; and (22) our ability to meet environment, social, and governance standards and expectations of investors, regulators, customers, and other stakeholders.
For further discussion of risks and uncertainties which could cause actual results to differ from those contained in the forward-looking statements, see Part 1, Item 1A "Risk Factors" of our annual report on Form 10-K for the year ended December 31, 2021. The forward-looking statements in this news release are being made as of the date of this news release, and we expressly disclaim any obligation to update or revise any forward-looking statement contained herein, even if made available on our website or otherwise.
Unum Group FINANCIAL HIGHLIGHTS (Unaudited) | |||||||
($ in millions, except share data) | |||||||
Three Months Ended June 30 | Six Months Ended June 30 | ||||||
2022 | 2021 | 2022 | 2021 | ||||
Revenue | |||||||
Premium Income | $ 2,417.3 | $ 2,374.4 | $ 4,820.6 | $ 4,752.7 | |||
Net Investment Income | 559.0 | 563.5 | 1,086.2 | 1,112.2 | |||
Net Investment Gain (Loss) | (4.1) | 0.9 | (17.9) | 85.5 | |||
Other Income | 68.7 | 54.2 | 134.5 | 114.6 | |||
Total Revenue | 3,040.9 | 2,993.0 | 6,023.4 | 6,065.0 | |||
Benefits and Expenses | |||||||
Benefits and Change in Reserves for Future Benefits | 1,758.1 | 1,854.1 | 3,602.0 | 3,905.3 | |||
Commissions | 274.4 | 259.7 | 547.6 | 519.6 | |||
Interest and Debt Expense | 47.4 | 45.3 | 94.3 | 89.7 | |||
Cost Related to Early Retirement of Debt | — | 67.3 | — | 67.3 | |||
Deferral of Acquisition Costs | (137.9) | (129.7) | (279.7) | (260.3) | |||
Amortization of Deferred Acquisition Costs | 142.6 | 136.0 | 298.7 | 302.4 | |||
Other Expenses | 513.2 | 497.7 | 1,005.3 | 979.6 | |||
Total Benefits and Expenses | 2,597.8 | 2,730.4 | 5,268.2 | 5,603.6 | |||
Income Before Income Tax | 443.1 | 262.6 | 755.2 | 461.4 | |||
Income Tax Expense | 72.7 | 79.7 | 131.3 | 125.5 | |||
Net Income | $ 370.4 | $ 182.9 | $ 623.9 | $ 335.9 | |||
PER SHARE INFORMATION | |||||||
Net Income Per Common Share | |||||||
Basic | $ 1.84 | $ 0.89 | $ 3.09 | $ 1.64 | |||
Assuming Dilution | $ 1.83 | $ 0.89 | $ 3.07 | $ 1.64 | |||
Weighted Average Common Shares - Basic (000s) | 201,151.7 | 204,504.5 | 201,888.8 | 204,323.1 | |||
Weighted Average Common Shares - Assuming Dilution | 202,431.7 | 205,273.8 | 202,966.5 | 205,009.8 | |||
Outstanding Shares - (000s) | 200,233.4 | 204,349.8 | |||||
Reconciliation of Non-GAAP Financial Measures | |||||||
Three Months Ended June 30 | |||||||
2022 | 2021 | ||||||
(in millions) | per share * | (in millions) | per share * | ||||
Net Income | $ 370.4 | $ 1.83 | $ 182.9 | $ 0.89 | |||
Excluding: | |||||||
Net Investment Gain (Loss) (net of tax expense (benefit) of | (3.1) | (0.02) | 0.6 | 0.01 | |||
Amortization of the Cost of Reinsurance (net of tax benefit of | (13.1) | (0.06) | (15.5) | (0.08) | |||
Cost Related to Early Retirement of Debt (net of tax benefit of | — | — | (53.2) | (0.26) | |||
Impairment Loss on ROU Asset (net of tax benefit of $—; $2.9) | — | — | (11.0) | (0.05) | |||
Impact of U.K. Tax Rate Increase | — | — | (24.2) | (0.12) | |||
After-tax Adjusted Operating Income | $ 386.6 | $ 1.91 | $ 286.2 | $ 1.39 | |||
* Assuming Dilution | |||||||
June 30 | |||||||
2022 | 2021 | ||||||
(in millions) | per share | (in millions) | per share | ||||
Total Stockholders' Equity (Book Value) | $ 9,705.1 | $ 48.47 | $ 10,947.5 | $ 53.57 | |||
Excluding: | |||||||
Net Unrealized Gain (Loss) on Securities | (1,064.9) | (5.32) | 911.4 | 4.46 | |||
Net Gain on Hedges | 46.4 | 0.23 | 77.5 | 0.38 | |||
Subtotal | 10,723.6 | 53.56 | 9,958.6 | 48.73 | |||
Excluding: | |||||||
Foreign Currency Translation Adjustment | (366.9) | (1.83) | (244.7) | (1.20) | |||
Subtotal | 11,090.5 | 55.39 | 10,203.3 | 49.93 | |||
Excluding: | |||||||
Unrecognized Pension and Postretirement Benefit Costs | (386.8) | (1.93) | (522.1) | (2.56) | |||
Total Stockholders' Equity, Excluding Accumulated Other | $ 11,477.3 | $ 57.32 | $ 10,725.4 | $ 52.49 | |||
")
View original content to download multimedia:https://www.prnewswire.com/news-releases/unum-group-reports-second-quarter-2022-results-301598346.html
SOURCE Unum Group
International
Gen Z, The Most Pessimistic Generation In History, May Decide The Election
Gen Z, The Most Pessimistic Generation In History, May Decide The Election
Authored by Mike Shedlock via MishTalk.com,
Young adults are more…
Share this:

Authored by Mike Shedlock via MishTalk.com,
Young adults are more skeptical of government and pessimistic about the future than any living generation before them.
This is with reason, and it’s likely to decide the election.
Rough Years and the Most Pessimism Ever
The Wall Street Journal has an interesting article on The Rough Years That Turned Gen Z Into America’s Most Disillusioned Voters.
Young adults in Generation Z—those born in 1997 or after—have emerged from the pandemic feeling more disillusioned than any living generation before them, according to long-running surveys and interviews with dozens of young people around the country. They worry they’ll never make enough money to attain the security previous generations have achieved, citing their delayed launch into adulthood, an impenetrable housing market and loads of student debt.
And they’re fed up with policymakers from both parties.
Washington is moving closer to passing legislation that would ban or force the sale of TikTok, a platform beloved by millions of young people in the U.S. Several young people interviewed by The Wall Street Journal said they spend hours each day on the app and use it as their main source of news.
“It’s funny how they quickly pass this bill about this TikTok situation. What about schools that are getting shot up? We’re not going to pass a bill about that?” Gaddie asked. “No, we’re going to worry about TikTok and that just shows you where their head is…. I feel like they don’t really care about what’s going on with humanity.”
Gen Z’s widespread gloominess is manifesting in unparalleled skepticism of Washington and a feeling of despair that leaders of either party can help. Young Americans’ entire political memories are subsumed by intense partisanship and warnings about the looming end of everything from U.S. democracy to the planet. When the darkest days of the pandemic started to end, inflation reached 40-year highs. The right to an abortion was overturned. Wars in Ukraine and the Middle East raged.
Dissatisfaction is pushing some young voters to third-party candidates in this year’s presidential race and causing others to consider staying home on Election Day or leaving the top of the ticket blank. While young people typically vote at lower rates, a small number of Gen Z voters could make the difference in the election, which four years ago was decided by tens of thousands of votes in several swing states.
Roughly 41 million Gen Z Americans—ages 18 to 27—will be eligible to vote this year, according to Tufts University.
Gen Z is among the most liberal segments of the electorate, according to surveys, but recent polling shows them favoring Biden by only a slim margin. Some are unmoved by those who warn that a vote against Biden is effectively a vote for Trump, arguing that isn’t enough to earn their support.
Confidence
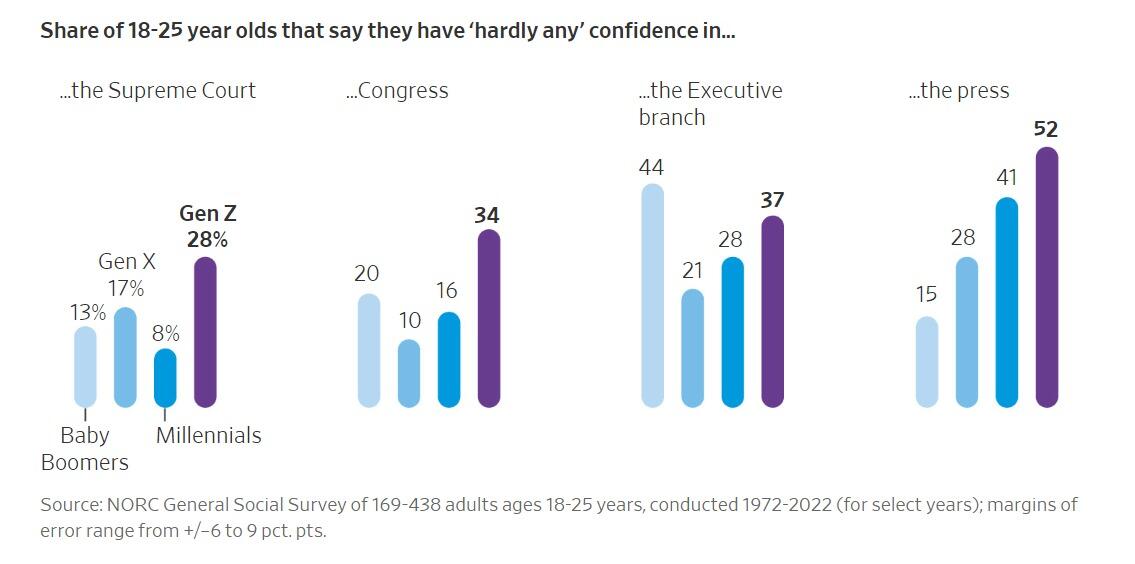
When asked if they had confidence in a range of public institutions, Gen Z’s faith in them was generally below that of the older cohorts at the same point in their lives.
One-third of Gen Z Americans described themselves as conservative, according to NORC’s 2022 General Social Survey. That is a larger share identifying as conservative than when millennials, Gen X and baby boomers took the survey when they were the same age, though some of the differences were small and within the survey’s margin of error.
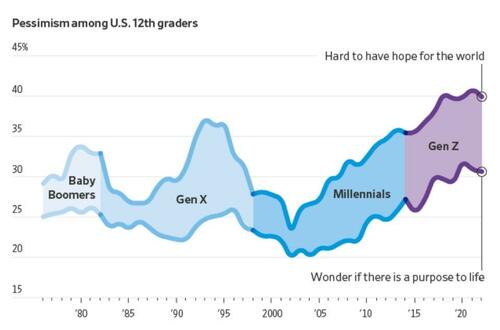
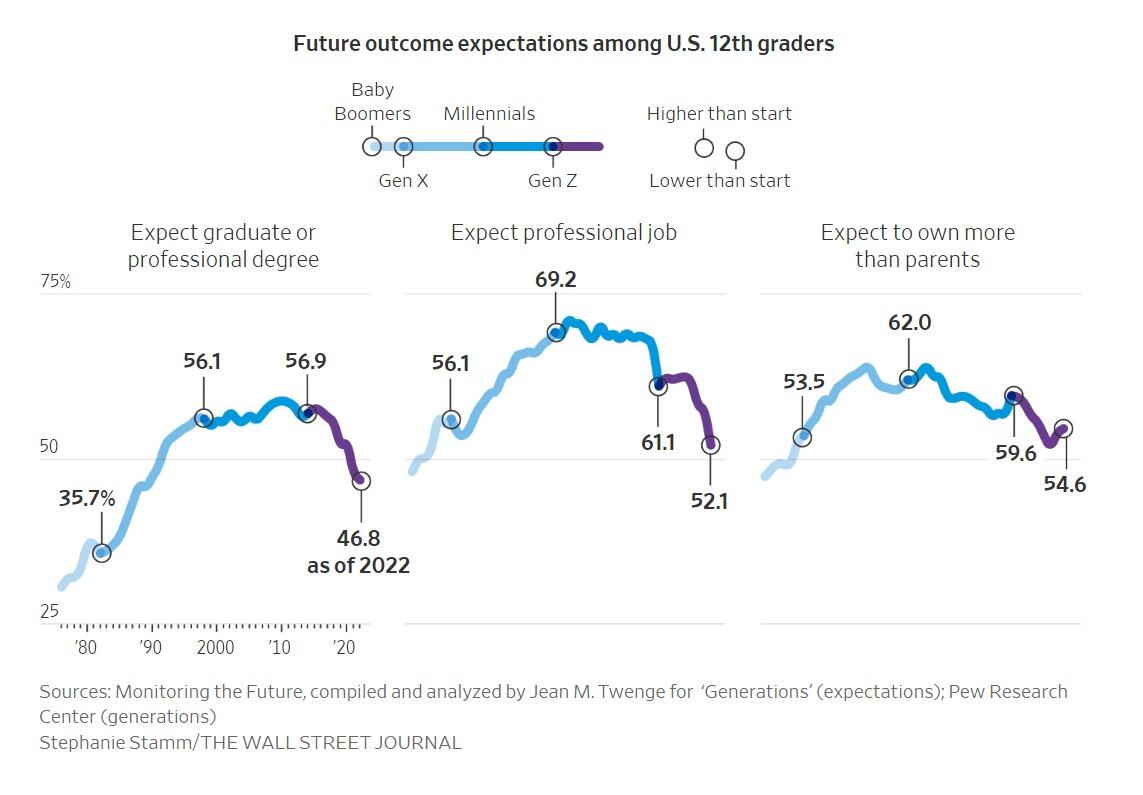
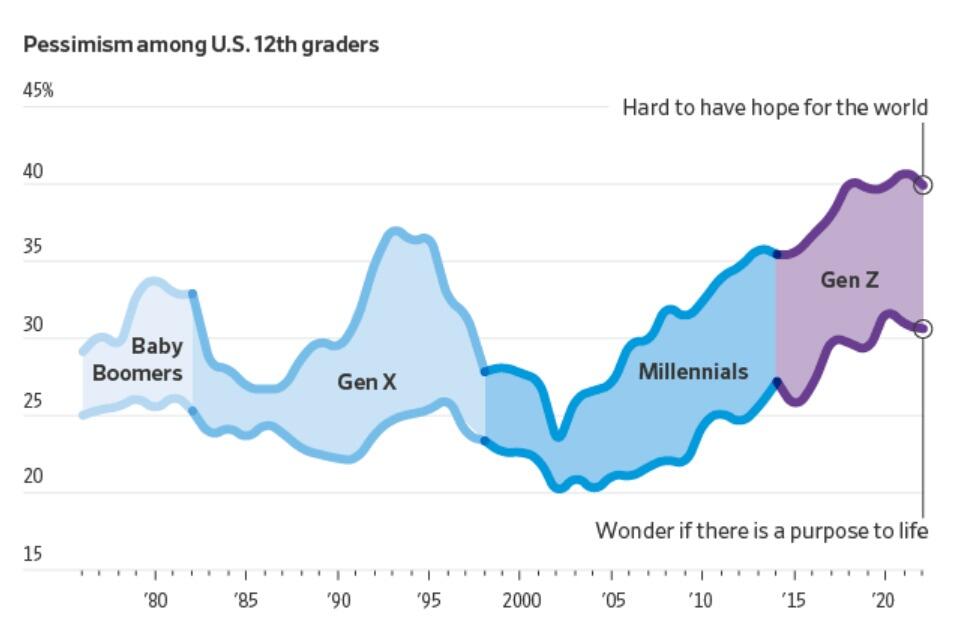
More young people now say they find it hard to have hope for the world than at any time since at least 1976, according to a University of Michigan survey that has tracked public sentiment among 12th-graders for nearly five decades. Young people today are less optimistic than any generation in decades that they’ll get a professional job or surpass the success of their parents, the long-running survey has found. They increasingly believe the system is stacked against them and support major changes to the way the country operates.
Gen Z future Outcome
“It’s the starkest difference I’ve documented in 20 years of doing this research,” said Twenge, the author of the book “Generations.” The pandemic, she said, amplified trends among Gen Z that have existed for years: chronic isolation, a lack of social interaction and a propensity to spend large amounts of time online.
A 2020 study found past epidemics have left a lasting impression on young people around the world, creating a lack of confidence in political institutions and their leaders. The study, which analyzed decades of Gallup World polling from dozens of countries, found the decline in trust among young people typically persists for two decades.
Young people are more likely than older voters to have a pessimistic view of the economy and disapprove of Biden’s handling of inflation, according to the recent Journal poll. Among people under 30, Biden leads Trump by 3 percentage points, 35% to 32%, with 14% undecided and the remaining shares going to third-party candidates, including 10% to independent Robert F. Kennedy Jr.
Economic Reality
Gen Z may be the first generation in US history that is not better off than their parents.
Many have given up on the idea they will ever be able to afford a home.
The economy is allegedly booming (I disagree). Regardless, stress over debt is high with younger millennials and zoomers.
This has been a constant theme of mine for many months.
Credit Card and Auto Delinquencies Soar
Credit card debt surged to a record high in the fourth quarter. Even more troubling is a steep climb in 90 day or longer delinquencies.
![]()
Record High Credit Card Debt
Credit card debt rose to a new record high of $1.13 trillion, up $50 billion in the quarter. Even more troubling is the surge in serious delinquencies, defined as 90 days or more past due.
For nearly all age groups, serious delinquencies are the highest since 2011.
Auto Loan Delinquencies
![]()
Serious delinquencies on auto loans have jumped from under 3 percent in mid-2021 to to 5 percent at the end of 2023 for age group 18-29.Age group 30-39 is also troubling. Serious delinquencies for age groups 18-29 and 30-39 are at the highest levels since 2010.
For further discussion please see Credit Card and Auto Delinquencies Soar, Especially Age Group 18 to 39
Generational Homeownership Rates
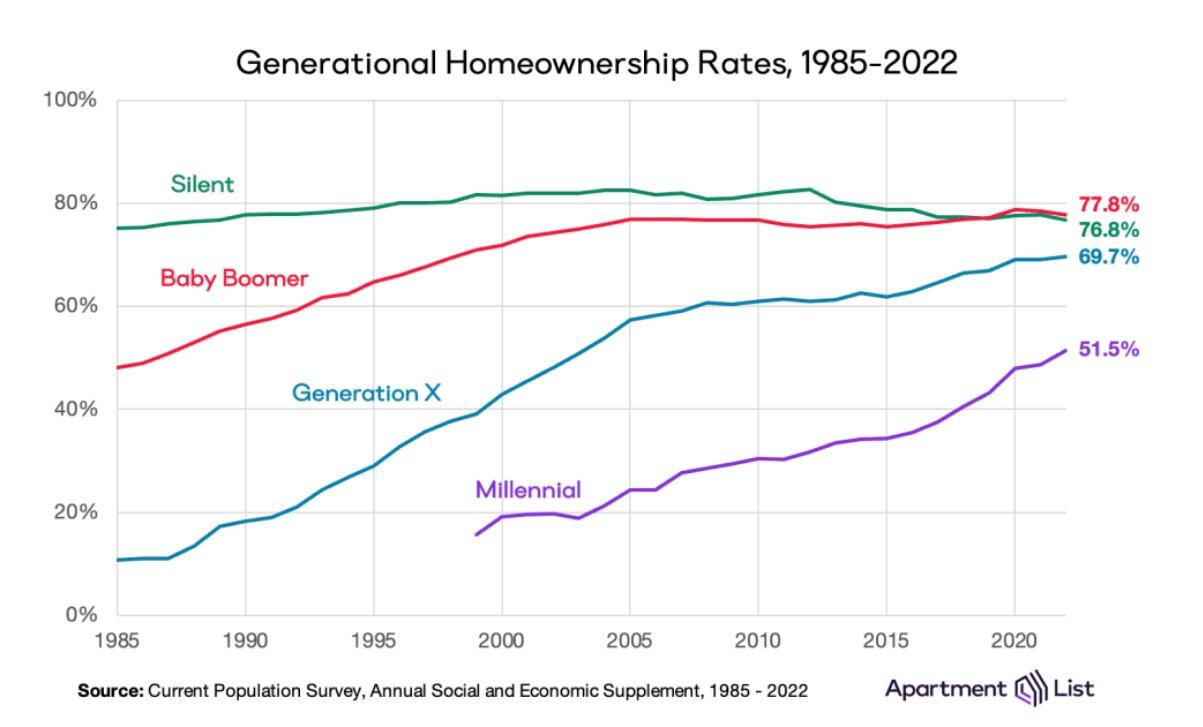
Home ownership rates courtesy of Apartment List
The above chart is from the Apartment List’s 2023 Millennial Homeownership Report
Those struggling with rent are more likely to be Millennials and Zoomers than Generation X, Baby Boomers, or members of the Silent Generation.
The same age groups struggling with credit card and auto delinquencies.
On Average Everything is Great
Average it up, and things look pretty good. This is why we have seen countless stories attempting to explain why people should be happy.
Krugman Blames Partisanship
With the recent rise in consumer sentiment, time to revisit this excellent Briefing Book paper. On reflection, I'd do it a bit differently; same basic conclusion, but I think partisan asymmetry explains even more of the remaining low numbers 1/ https://t.co/4lqm7X4472
— Paul Krugman (@paulkrugman) February 17, 2024
OK, there is a fair amount of partisanship in the polls.
However, Biden isn’t struggling from partisanship alone. If that was the reason, Biden would not be polling so miserably with Democrats in general, blacks, and younger voters.
OK, there is a fair amount of partisanship in the polls.
However, Biden isn’t struggling from partisanship alone. If that was the reason, Biden would not be polling so miserably with Democrats in general, blacks, and younger voters.
This allegedly booming economy left behind the renters and everyone under the age of 40 struggling to make ends meet.
Many Are Addicted to “Buy Now, Pay Later” Plans
Buy Now Pay Later, BNPL, plans are increasingly popular. It’s another sign of consumer credit stress.
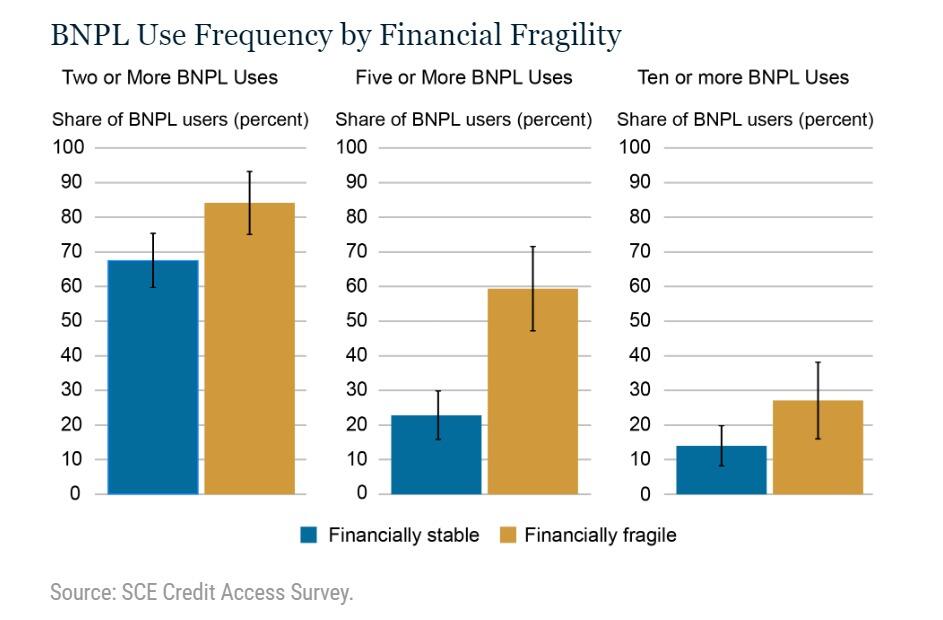
For discussion, please see Many Are Addicted to “Buy Now, Pay Later” Plans, It’s a Big Trap
The study did not break things down by home owners vs renters, but I strongly suspect most of the BNPL use is by renters.
What About Jobs?
Another seemingly strong jobs headline falls apart on closer scrutiny. The massive divergence between jobs and employment continued into February.
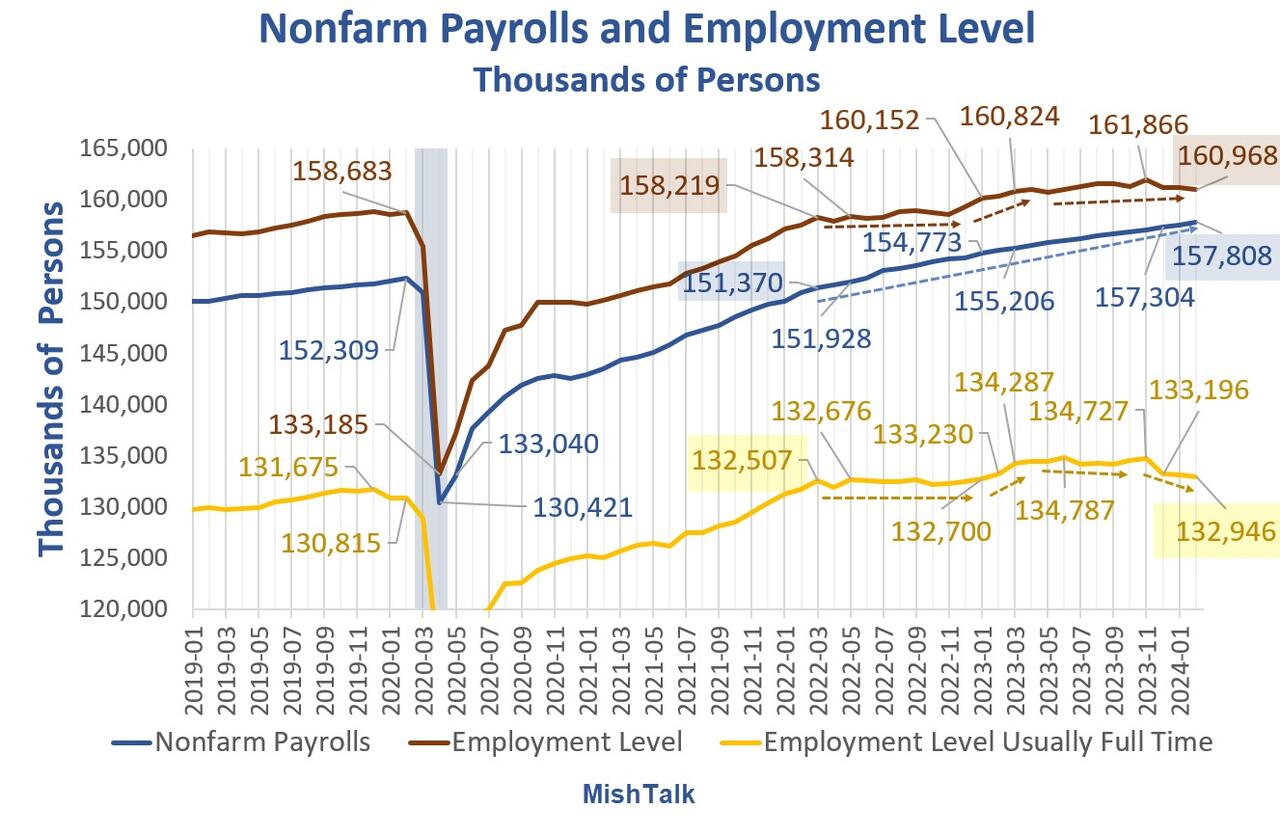
Nonfarm payrolls and employment levels from the BLS, chart by Mish.
Payrolls vs Employment Gains Since March 2023
-
Nonfarm Payrolls: 2,602,000
-
Employment Level: +144,000
-
Full Time Employment: -284,000
For more details of the weakening labor markets, please see Jobs Up 275,000 Employment Down 184,000
CPI Hot Again
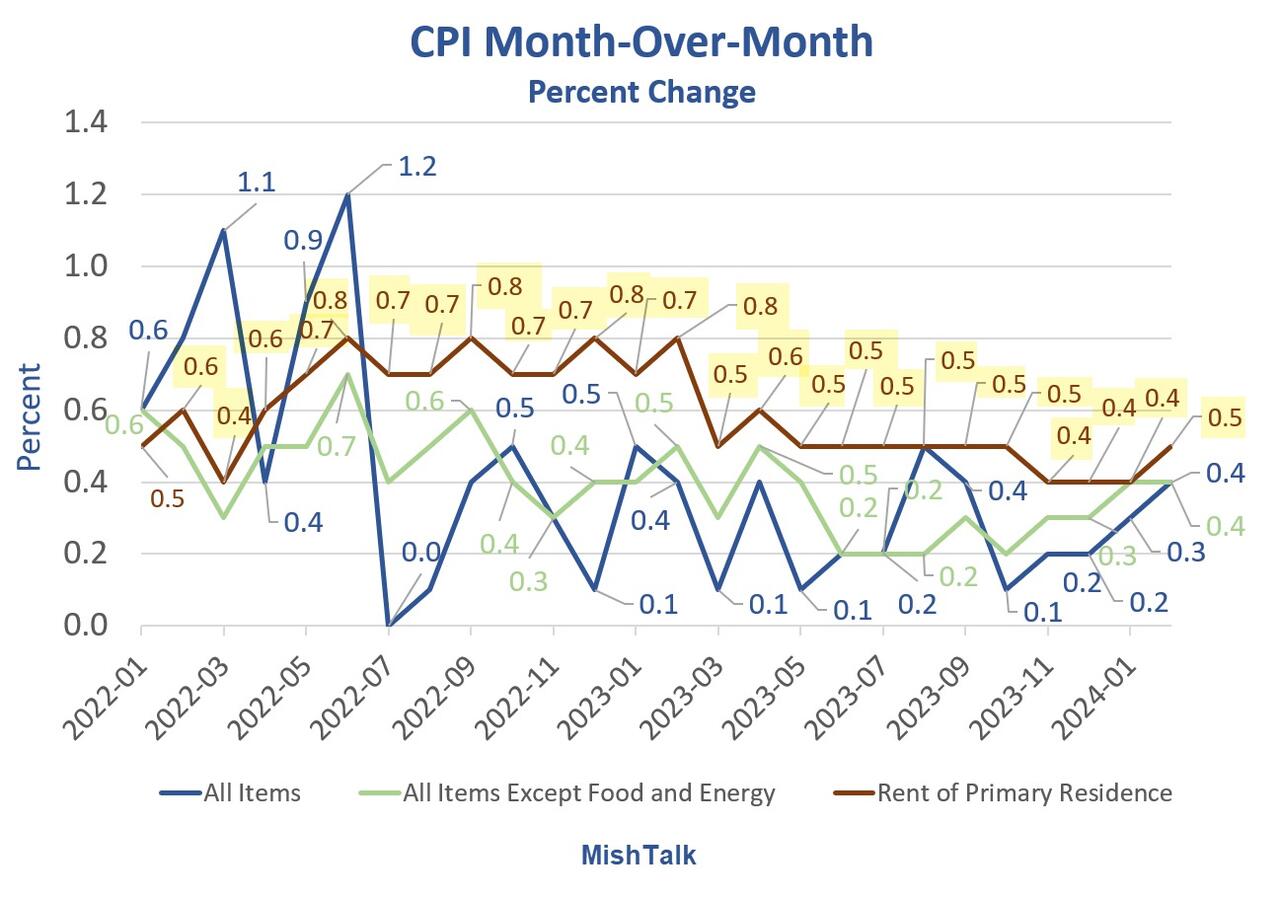
CPI Data from the BLS, chart by Mish.
For discussion of the CPI inflation data for February, please see CPI Hot Again, Rent Up at Least 0.4 Percent for 30 Straight Months
Also note the Producer Price Index (PPI) Much Hotter Than Expected in February
Major Economic Cracks
There are economic cracks in spending, cracks in employment, and cracks in delinquencies.
But there are no cracks in the CPI. It’s coming down much slower than expected. And the PPI appears to have bottomed.
Add it up: Inflation + Recession = Stagflation.
Election Impact
In 2020, younger voters turned out in the biggest wave in history. And they voted for Biden.
Younger voters are not as likely to vote in 2024, and they are less likely to vote for Biden.
Millions of voters will not vote for either Trump or Biden. Net, this will impact Biden more. The base will not decide the election, but the Trump base is far more energized than the Biden base.
If Biden signs a TikTok ban, that alone could tip the election.
If No Labels ever gets its act together, I suspect it will siphon more votes from Biden than Trump. But many will just sit it out.
“We’re just kind of over it,” Noemi Peña, 20, a Tucson, Ariz., resident who works in a juice bar, said of her generation’s attitude toward politics. “We don’t even want to hear about it anymore.” Peña said she might not vote because she thinks it won’t change anything and “there’s just gonna be more fighting.” Biden won Arizona in 2020 by just over 10,000 votes.
The Journal noted nearly one-third of voters under 30 have an unfavorable view of both Biden and Trump, a higher number than all older voters. Sixty-three percent of young voters think neither party adequately represents them.
Young voters in 2020 were energized to vote against Trump. Now they have thrown in the towel.
And Biden telling everyone how great the economy is only rubs salt in the wound.
Uncategorized
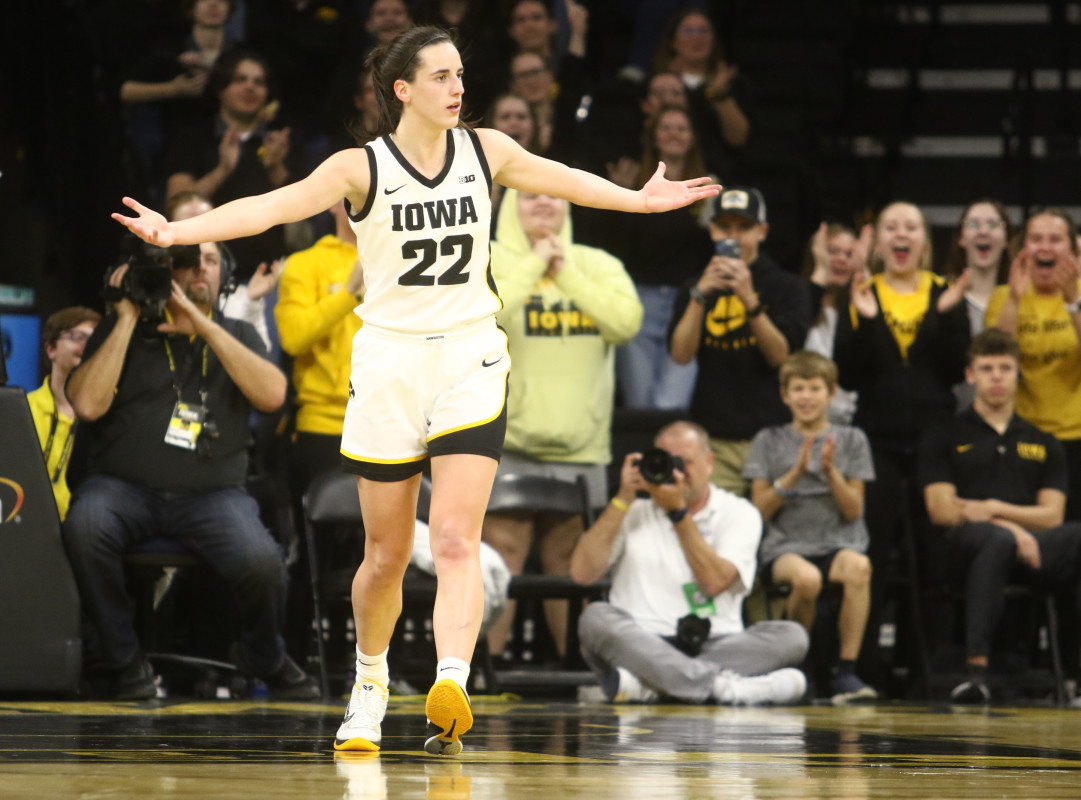
Women’s basketball is gaining ground, but is March Madness ready to rival the men’s game?
The hype around Caitlin Clark, NCAA Women’s Basketball is unprecedented — but can its March Madness finally rival the Men’s?
Share this:

In March 2021, the world was struggling to find its legs amid the ongoing Covid-19 pandemic. Sports leagues were trying their best to keep going.
It started with the NBA creating a bubble in Orlando in late 2020, playing a full postseason in the confines of Disney World in arenas that were converted into gyms devoid of fans. Other leagues eventually allowed for limited capacity seating in stadiums, including the NCAA for its Men’s and Women’s Basketball tournaments.
The two tournaments were confined to two cities that year — instead of games normally played in different regions around the country: Indianapolis for the men and San Antonio for the women.
But a glaring difference between the men’s and women’s facilities was exposed by Oregon’s Sedona Prince on social media. The workout and practice area for the men was significantly larger than the women, whose weight room was just a single stack of dumbbells.
Let me put it on Twitter too cause this needs the attention pic.twitter.com/t0DWKL2YHR
— SEDONA (@sedonaprince_) March 19, 2021
The video drew significant attention to the equity gaps between the Men’s and Women’s divisions, leading to a 114-page report by a civil rights law firm that detailed the inequities between the two and suggested ways to improve the NCAA’s efforts for the Women’s side. One of these suggestions was simply to give the Women’s Tournament the same March Madness moniker as the men, which it finally got in 2022.
But underneath the surface of these institutional changes, women’s basketball’s single-biggest success driver was already emerging out of the shadows.
During the same COVID-marred season, a rookie from Iowa led the league in scoring with 26.6 points per game.
Her name: Caitlin Clark.
As it stands today, Clark is the leading scorer in the history of college basketball — Men’s or Women’s. Her jaw-dropping shooting ability has fueled record viewership and ticket sales for Women’s collegiate games, carrying momentum to the March Madness tournament that has NBA legends like Kevin Garnett and Paul Pierce more excited for the Women’s March Madness than the Men’s this year.
Related: Ticket prices for Caitlin Clark's final college home game are insanely high
But as the NCAA tries to bridge the opportunities given to the two sides, can the hype around Clark be enough for the Women’s March Madness to bring in the same fandom as the Men for the 2024 tournaments?
TheStreet spoke with Jon Lewis of Sports Media Watch, who has been following sports viewership trends for the last two decades; Melissa Isaacson, a veteran sports journalist and longtime advocate of women’s basketball; and Pete Giorgio, Deloitte’s leader for Global and US Sports to dissect the rise Caitlin Clark and women’s collegiate hoops ahead of March Madness.
“Nobody is moving the needle like Caitlin Clark,” Lewis told TheStreet. “Nobody else in sports, period, right now, is fueling record numbers on all these different networks, driving viewership beyond what the norm has been for 20 years."
The Caitlin Clark Effect is real — but there are other reasons for the success of women's basketball
The game in which Clark broke the all-time college scoring record against Ohio State on Sunday, Mar. 3 was seen by an average of 3.4 million viewers on Fox, marking the first time a women’s game broke the two million viewership barrier since 2010. Viewership for that game came in just behind the men’s game between Michigan State vs Arizona game on Thanksgiving, which Lewis said was driven by NFL viewership on the same day.
A week later, Iowa’s Big Ten Championship win over Nebraska breached the three million viewers mark as well, and the team has also seen viewership numbers crack over 1.5 million viewers multiple times throughout the regular season.
The success on television has also translated to higher ticket prices, as tickets to watch Clark at home and on the road have breached hundreds of dollars and drawn long lines outside stadiums. Isaacson, who is a professor at Northwestern, said she went to the game between the Hawkeyes and Northwestern Wildcats — which was the first sellout in school history for the team — and witnessed the effect of Clark in person.
“Standing in line interviewing people at the Northwestern game, seeing men who've never been to a women's game with their little girls watching and so excited, and seeing Caitlin and her engaging with little girls, it’s just been really fun,” Isaacson said.
But while Clark is certainly the biggest success driver, her game isn’t the only thing pulling up the women’s side. The three-point revolution, which started in the NBA with the introduction of deeper analytics as well as the rise of stars like Steph Curry, has been a positive for the Women’s game.
“They backed up to the three-point line and it’s opening up the game,” Isaacson said.
One of the major criticisms from a lot of women’s hoops detractors has been how the game does not compare in terms of quality to the men. However, shooting has become a great equalizer, displayed recently during the 2024 NBA All-Star Weekend last month when the WNBA’s Sabrina Ionescu nearly defeated Curry — who is widely considered the greatest shooter ever — in a three-point contest.
Clark has become the embodiment of the three-point revolution for the women. Her shooting displays have demanded the respect of anyone who has doubted women’s basketball in the past because being a man simply doesn’t grant someone the ability to shoot long-distance bombs the way she can.
Basketball pundit Bill Simmons admitted on a Feb. 28 episode of “The Bill Simmons Podcast” that he used to not want to watch women’s basketball because he didn’t enjoy watching the product, but finds himself following the women’s game this year more than the men’s side in large part due to Clark.
“I think she has the chance to be the most fun basketball player, male or female, when she gets to the pros,” Simmons said. “If she’s going to make the same 30-footers, routinely. It’s basically all the same Curry stuff just with a female … I would like watching her play in any format.”
But while Clark is driving up the numbers at the top, she’s not the only one carrying the greatness of the product. Lewis, Isaacson, Giorgio — and even Simmons, on his podcast — agreed that there are several other names and collegiate programs pulling in fans.
“It’s not just Iowa, it’s not just Caitlin Clark, it’s all of these teams,” Giorgio said. “Part of it is Angel Reese … coaches like Dawn Staley in South Carolina … You’ve got great stories left and right.”

The viewership showed that as well because the SEC Championship game between the LSU Tigers and University of South Carolina Gamecocks on Sunday, Mar. 10 averaged two million viewers.
Bridging the gap between the Men’s and Women’s March Madness viewership
The first reason women are catching up to the men is really star power. While the Women’s division has names like Clark and Reese, there just aren’t any names on the Men’s side this year that carry the same weight.
Garnett said on his show that he can’t name any men’s college basketball players, while on the women’s side, he could easily throw out the likes of Clark, Reese, UConn’s Paige Bueckers, and USC’s JuJu Watkins. Lewis felt the same.
Kevin Garnett energy towards WBB is unmatched. Sorry for the language but that’s how he talks. Just watch. pic.twitter.com/0yGBRGaF3O
— The9450 Podcast Network (@The9450) March 8, 2024
“The stars in the men's game, with one and done, I genuinely couldn't give you a single name of a single men’s player,” Lewis said.
A major reason for this is that the Women’s side has the continuity that the Men’s side does not. The rules of the NBA allow for players to play just one year in college — or even play a year professionally elsewhere — before entering the draft, while the WNBA requires players to be 22-years-old during the year of the draft to be eligible.
“You know the stars in the women's game because they stay longer,” Lewis said. “[In the men’s game], the programs are the stars … In the women's game, it's a lot more like the NBA where the players are the stars.”
Parity is also a massive factor on both sides. The women’s game used to be dominated by a few schools like UConn and Notre Dame. Nowadays, between LSU, Iowa, University of South Carolina, Stanford, and UConn, there are a handful of schools that have a shot to win the entire tournament. While this is more exciting for fans, the talent in the women's game isn’t deep enough, so too many upsets are unlikely. Many of the biggest draws are still expected to make deep runs.
But on the men’s side, there is a bigger shot that the smaller programs make it to the end — which is what was seen last year. UConn eventually won the whole thing, but schools without as big of a national fanbase in San Diego State, Florida Atlantic University, and the University Miami rounded out the Final Four.
“People want to see one Cinderella,” Lewis said. “They don't want to see two and three, they want one team that isn't supposed to be there.”
Is Women's March Madness ready to overtake the Men?
Social media might feel like it’s giving more traction to the Women’s game, but experts don’t necessarily expect that to show up in the viewership numbers just yet.
“There’s certainly a lot more buzz than there used to be,” Giorgio said. “It’s been growing every year for not just the past few years but for 10 years, but it’s hard to compare it versus Men’s.”
But the gap continues to get smaller and smaller between the two sides, and this year's tournament could bridge that gap even further.
One indicator is ticket prices. For the NCAA Tournament Final Four in April, “get-in” ticket prices are currently more expensive for the Women’s game than the Men’s game, according to TickPick. The ticketing site also projects that the Women’s Final Four and Championship game ticket prices will smash any previous records for the Women’s side should Clark and the Hawkeyes make a run to the end.

Getty Images/TheStreet
The caveat is that the Women’s Final Four is played in a stadium that has less than a third of the seating capacity of the Men’s Final Four. That’s why the average ticket prices are still more expensive for the men, although the gap is a lot smaller this year than in previous years.

But that caveat pretty much sums up where the women’s game currently stands versus the men’s: There is still a significant gap between the distribution and availability of the former.
While Iowa’s regular season games have garnered millions of viewers, the majority of the most-viewed games are still Men’s contests.
To illustrate the gap between the men’s and women’s game — last year’s Women’s Championship game that saw the LSU Tigers defeat the Hawkeyes was a record-breaking one for the women, drawing an average of 9.9 million viewers, more than double the viewership from the previous year.
One of the main reasons for that increase, as Lewis pointed out, is that last year’s Championship game was on ABC, which was the first time since 1995 that the Women’s Championship game was on broadcast television. The 1995 contest between UConn and Tennessee drew 7.4 million viewers.
The Men’s Championship actually had a record low in viewership last year garnering only 14.7 million viewers, driven in-part due to a lack of hype surrounding the schools that made it to the Final Four and Championship game. Viewership for the Men’s title game has been trending down in recent years — partly due to the effect the pandemic had on collective sports viewership — but the Men’s side had been easily breaching 20 million viewers for the game as recently as 2017.

Iowa's Big Ten Championship win on Sunday actually only averaged 6,000 fewer viewers than the iconic rivalry game between Duke and University of North Carolina Men’s Basketball the day prior. However, there is also the case that the Iowa game was played on broadcast TV (CBS) versus the Duke-UNC game airing on cable channel (ESPN).
So historical precedence makes it unlikely that we’ll see the women’s game match the men’s in terms of viewership as early as this year barring another massive viewership jump for the women and a lack of recovery for the Men’s side.
But ultimately, this shouldn’t be looked at as a down point for Women’s Basketball, according to Lewis. The Men’s side has built its viewership base for years, and the Women’s side is still growing. Even keeping pace with the Men’s viewership is already a great sign.
“The fact that these games have Caitlin Clark are even in the conversation with men's games, in terms of viewership is a huge deal,” Lewis said.
Related: Angel Reese makes bold statement for avoiding late game scuffle in championship game
recovery pandemic covid-19Government
The War Between Knowledge And Stupidity
The War Between Knowledge And Stupidity
Authored by Bert Olivier via The Brownstone Institute,
Bernard Stiegler was, until his premature…
Share this:


Authored by Bert Olivier via The Brownstone Institute,
Bernard Stiegler was, until his premature death, probably the most important philosopher of technology of the present. His work on technology has shown us that, far from being exclusively a danger to human existence, it is a pharmakon – a poison as well as a cure – and that, as long as we approach technology as a means to ‘critical intensification,’ it could assist us in promoting the causes of enlightenment and freedom.
It is no exaggeration to say that making believable information and credible analysis available to citizens at present is probably indispensable for resisting the behemoth of lies and betrayal confronting us. This has never been more necessary than it is today, given that we face what is probably the greatest crisis in the history of humanity, with nothing less than our freedom, let alone our lives, at stake.
To be able to secure this freedom against the inhuman forces threatening to shackle it today, one could do no better than to take heed of what Stiegler argues in States of Shock: Stupidity and Knowledge in the 21st Century (2015). Considering what he writes here it is hard to believe that it was not written today (p. 15):
The impression that humanity has fallen under the domination of unreason or madness [déraison] overwhelms our spirit, confronted as we are with systemic collapses, major technological accidents, medical or pharmaceutical scandals, shocking revelations, the unleashing of the drives, and acts of madness of every kind and in every social milieu – not to mention the extreme misery and poverty that now afflict citizens and neighbours both near and far.
While these words are certainly as applicable to our current situation as it was almost 10 years ago, Stiegler was in fact engaged in an interpretive analysis of the role of banks and other institutions – aided and abetted by certain academics – in the establishment of what he terms a ‘literally suicidal financial system’ (p. 1). (Anyone who doubts this can merely view the award-winning documentary film of 2010, Inside Job, by Charles Ferguson, which Stiegler also mentions on p.1.) He explains further as follows (p. 2):
Western universities are in the grip of a deep malaise, and a number of them have found themselves, through some of their faculty, giving consent to – and sometimes considerably compromised by – the implementation of a financial system that, with the establishment of hyper-consumerist, drive-based and ‘addictogenic’ society, leads to economic and political ruin on a global scale. If this has occurred, it is because their goals, their organizations and their means have been put entirely at the service of the destruction of sovereignty. That is, they have been placed in the service of the destruction of sovereignty as conceived by the philosophers of what we call the Enlightenment…
In short, Stiegler was writing about the way in which the world was being prepared, across the board – including the highest levels of education – for what has become far more conspicuous since the advent of the so-called ‘pandemic’ in 2020, namely an all-out attempt to cause the collapse of civilisation as we knew it, at all levels, with the thinly disguised goal in mind of installing a neo-fascist, technocratic, global regime which would exercise power through AI-controlled regimes of obedience. The latter would centre on ubiquitous facial recognition technology, digital identification, and CBDCs (which would replace money in the usual sense).
Given the fact that all of this is happening around us, albeit in a disguised fashion, it is astonishing that relatively few people are conscious of the unfolding catastrophe, let alone being critically engaged in disclosing it to others who still inhabit the land where ignorance is bliss. Not that this is easy. Some of my relatives are still resistant to the idea that the ‘democratic carpet’ is about to be pulled from under their feet. Is this merely a matter of ‘stupidity?’ Stiegler writes about stupidity (p.33):
…knowledge cannot be separated from stupidity. But in my view: (1) this is a pharmacological situation; (2) stupidity is the law of the pharmakon; and (3) the pharmakon is the law of knowledge, and hence a pharmacology for our age must think the pharmakon that I am also calling, today, the shadow.
In my previous post I wrote about the media as pharmaka (plural of pharmakon), showing how, on the one hand, there are (mainstream) media which function as ‘poison,’ while on the other there are (alternative) media that play the role of ‘cure.’ Here, by linking the pharmakon with stupidity, Stiegler alerts one to the (metaphorically speaking) ‘pharmacological’ situation, that knowledge is inseparable from stupidity: where there is knowledge, the possibility of stupidity always asserts itself, and vice versa. Or in terms of what he calls ‘the shadow,’ knowledge always casts a shadow, that of stupidity.
Anyone who doubts this may only cast their glance at those ‘stupid’ people who still believe that the Covid ‘vaccines’ are ‘safe and effective,’ or that wearing a mask would protect them against infection by ‘the virus.’ Or, more currently, think of those – the vast majority in America – who routinely fall for the Biden administration’s (lack of an) explanation of its reasons for allowing thousands of people to cross the southern – and more recently also the northern – border. Several alternative sources of news and analysis have lifted the veil on this, revealing that the influx is not only a way of destabilising the fabric of society, but possibly a preparation for civil war in the United States.
There is a different way of explaining this widespread ‘stupidity,’ of course – one that I have used before to explain why most philosophers have failed humanity miserably, by failing to notice the unfolding attempt at a global coup d’etat, or at least, assuming that they did notice it, to speak up against it. These ‘philosophers’ include all the other members of the philosophy department where I work, with the honourable exception of the departmental assistant, who is, to her credit, wide awake to what has been occurring in the world. They also include someone who used to be among my philosophical heroes, to wit, Slavoj Žižek, who fell for the hoax hook, line, and sinker.
In brief, this explanation of philosophers’ stupidity – and by extension that of other people – is twofold. First there is ‘repression’ in the psychoanalytic sense of the term (explained at length in both the papers linked in the previous paragraph), and secondly there is something I did not elaborate on in those papers, namely what is known as ‘cognitive dissonance.’ The latter phenomenon manifests itself in the unease that people exhibit when they are confronted by information and arguments that are not commensurate, or conflict, with what they believe, or which explicitly challenge those beliefs. The usual response is to find standard, or mainstream-approved responses to this disruptive information, brush it under the carpet, and life goes on as usual.
‘Cognitive dissonance’ is actually related to something more fundamental, which is not mentioned in the usual psychological accounts of this unsettling experience. Not many psychologists deign to adduce repression in their explanation of disruptive psychological conditions or problems encountered by their clients these days, and yet it is as relevant as when Freud first employed the concept to account for phenomena such as hysteria or neurosis, recognising, however, that it plays a role in normal psychology too. What is repression?
In The Language of Psychoanalysis (p. 390), Jean Laplanche and Jean-Bertrand Pontalis describe ‘repression’ as follows:
Strictly speaking, an operation whereby the subject attempts to repel, or to confine to the unconscious, representations (thoughts, images, memories) which are bound to an instinct. Repression occurs when to satisfy an instinct – though likely to be pleasurable in itself – would incur the risk of provoking unpleasure because of other requirements.
…It may be looked upon as a universal mental process to so far as it lies at the root of the constitution of the unconscious as a domain separate from the rest of the psyche.
In the case of the majority of philosophers, referred to earlier, who have studiously avoided engaging critically with others on the subject of the (non-)‘pandemic’ and related matters, it is more than likely that repression occurred to satisfy the instinct of self-preservation, regarded by Freud as being equally fundamental as the sexual instinct. Here, the representations (linked to self-preservation) that are confined to the unconscious through repression are those of death and suffering associated with the coronavirus that supposedly causes Covid-19, which are repressed because of being intolerable. The repression of (the satisfaction of) an instinct, mentioned in the second sentence of the first quoted paragraph, above, obviously applies to the sexual instinct, which is subject to certain societal prohibitions. Cognitive dissonance is therefore symptomatic of repression, which is primary.
Returning to Stiegler’s thesis concerning stupidity, it is noteworthy that the manifestations of such inanity are not merely noticeable among the upper echelons of society; worse – there seems to be, by and large, a correlation between those in the upper classes, with college degrees, and stupidity.
In other words, it is not related to intelligence per se. This is apparent, not only in light of the initially surprising phenomenon pertaining to philosophers’ failure to speak up in the face of the evidence, that humanity is under attack, discussed above in terms of repression.
Dr Reiner Fuellmich, one of the first individuals to realise that this was the case, and subsequently brought together a large group of international lawyers and scientists to testify in the ‘court of public opinion’ (see 29 min. 30 sec. into the video) on various aspects of the currently perpetrated ‘crime against humanity,’ has drawn attention to the difference between the taxi drivers he talks to about the globalists’ brazen attempt to enslave humanity, and his learned legal colleagues as far as awareness of this ongoing attempt is concerned. In contrast with the former, who are wide awake in this respect, the latter – ostensibly more intellectually qualified and ‘informed’ – individuals are blissfully unaware that their freedom is slipping away by the day, probably because of cognitive dissonance, and behind that, repression of this scarcely digestible truth.
This is stupidity, or the ‘shadow’ of knowledge, which is recognisable in the sustained effort by those afflicted with it, when confronted with the shocking truth of what is occurring worldwide, to ‘rationalise’ their denial by repeating spurious assurances issued by agencies such as the CDC, that the Covid ‘vaccines’ are ‘safe and effective,’ and that this is backed up by ‘the science.’
Here a lesson from discourse theory is called for. Whether one refers to natural science or to social science in the context of some particular scientific claim – for example, Einstein’s familiar theory of special relativity (e=mc2) under the umbrella of the former, or David Riesman’s sociological theory of ‘inner-’ as opposed to ‘other-directedness’ in social science – one never talks about ‘the science,’ and for good reason. Science is science. The moment one appeals to ‘the science,’ a discourse theorist would smell the proverbial rat.
Why? Because the definite article, ‘the,’ singles out a specific, probably dubious, version of science compared to science as such, which does not need being elevated to special status. In fact, when this is done through the use of ‘the,’ you can bet your bottom dollar it is no longer science in the humble, hard-working, ‘belonging-to-every-person’ sense. If one’s sceptical antennae do not immediately start buzzing when one of the commissars of the CDC starts pontificating about ‘the science,’ one is probably similarly smitten by the stupidity that’s in the air.
Earlier I mentioned the sociologist David Riesman and his distinction between ‘inner-directed’ and ‘other-directed’ people. It takes no genius to realise that, to navigate one’s course through life relatively unscathed by peddlers of corruption, it is preferable to take one’s bearings from ‘inner direction’ by a set of values which promotes honesty and eschews mendacity, than from the ‘direction by others.’ Under present circumstances such other-directedness applies to the maze of lies and misinformation emanating from various government agencies as well as from certain peer groups, which today mostly comprise the vociferously self-righteous purveyors of the mainstream version of events. Inner-directness in the above sense, when constantly renewed, could be an effective guardian against stupidity.
Recall that Stiegler warned against the ‘deep malaise’ at contemporary universities in the context of what he called an ‘addictogenic’ society – that is, a society that engenders addictions of various kinds. Judging by the popularity of the video platform TikTok at schools and colleges, its use had already reached addiction levels by 2019, which raises the question, whether it should be appropriated by teachers as a ‘teaching tool,’ or whether it should, as some people think, be outlawed completely in the classroom.
Recall that, as an instance of video technology, TikTok is an exemplary embodiment of the pharmakon, and that, as Stiegler has emphasised, stupidity is the law of the pharmakon, which is, in turn, the law of knowledge. This is a somewhat confusing way of saying that knowledge and stupidity cannot be separated; where knowledge is encountered, its other, stupidity, lurks in the shadows.
Reflecting on the last sentence, above, it is not difficult to realise that, parallel to Freud’s insight concerning Eros and Thanatos, it is humanly impossible for knowledge to overcome stupidity once and for all. At certain times the one will appear to be dominant, while on different occasions the reverse will apply. Judging by the fight between knowledge and stupidity today, the latter ostensibly still has the upper hand, but as more people are awakening to the titanic struggle between the two, knowledge is in the ascendant. It is up to us to tip the scales in its favour – as long as we realise that it is a never-ending battle.


The War Between Knowledge And Stupidity


Key shipping company files for Chapter 11 bankruptcy


Women’s basketball is gaining ground, but is March Madness ready to rival the men’s game?


Sylvester researchers, collaborators call for greater investment in bereavement care


“I Can’t Even Save”: Americans Are Getting Absolutely Crushed Under Enormous Debt Load


Illegal Immigrants Leave US Hospitals With Billions In Unpaid Bills


Problems After COVID-19 Vaccination More Prevalent Among Naturally Immune: Study


Gen Z, The Most Pessimistic Generation In History, May Decide The Election


Looking Back At COVID’s Authoritarian Regimes


‘Excess Mortality Skyrocketed’: Tucker Carlson and Dr. Pierre Kory Unpack ‘Criminal’ COVID Response
-

 Uncategorized3 weeks ago
All Of The Elements Are In Place For An Economic Crisis Of Staggering Proportions
-

 International1 week ago
EyePoint poaches medical chief from Apellis; Sandoz CFO, longtime BioNTech exec to retire
-

 Uncategorized4 weeks ago
California Counties Could Be Forced To Pay $300 Million To Cover COVID-Era Program
-

 Uncategorized3 weeks ago
Apparel Retailer Express Moving Toward Bankruptcy
-

 Uncategorized1 month ago
Industrial Production Decreased 0.1% in January
-

 Spread & Containment3 days ago
IFM’s Hat Trick and Reflections On Option-To-Buy M&A
-

 International1 week ago
Walmart launches clever answer to Target’s new membership program
-

 Uncategorized4 weeks ago
RFK Jr: The Wuhan Cover-Up & The Rise Of The Biowarfare-Industrial Complex