Connect with us

Uncategorized

UH energy competition focuses on innovation, commercialization and sustainability

The world is full of good ideas, but only some of them become viable and real. Credit: Please give photo credit to University of Houston. The world is…

Published

on

The world is full of good ideas, but only some of them become viable and real.

Credit: Please give photo credit to University of Houston.

The world is full of good ideas, but only some of them become viable and real.

“You don’t see the full impact of a good idea until someone figures out a way to convert it to a usable product or service that has value, brings it to market and makes money off of it – this is what makes it a sustainable business,” said S. Radhakrishnan, a retired University of Houston business professor and coordinator of UH Energy’s Innovation Commercialization Competition. “To have a successful energy transition, we need many innovative ideas to be commercialized.”

Keeping this in mind, Radhakrishnan worked hard to grow the second annual Energy Innovation Commercialization Competition – from five teams last year to 18 competing teams this year. The competition was open to graduate students from different disciplines working on a broad range of energy-related research across the UH System.

After judges whittled the entries down to five finalists, the teams pitched their findings to a final panel of volunteer judges representing Houston’s dynamic energy industry. The final presentations covered everything from carbon capture, carbon sequestration and lithium extraction from geothermal operations.  

Two winners were selected:

ECHO: UH-Chevron Energy Transition Energy Innovation Challenge Winner.

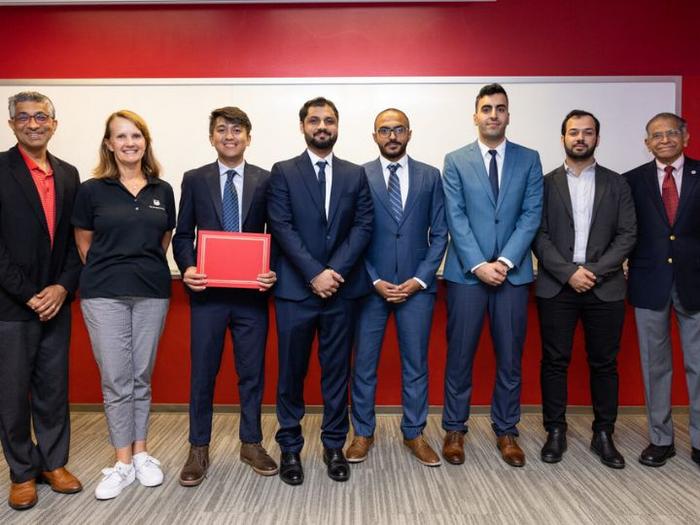
The ECHO team, made up of four UH environmental engineering doctoral students – Prince Aleta, Ahmad Hassan, Mohsen Afshari and Abdelrahman Refale and advised by Mim Rahimi, assistant professor of environmental engineering at the UH Cullen College of Engineering, won the first UH Energy Innovation Commercialization Competition. The team pitched a novel technology called ECHO, which is short for Electrochemical CO2 Harvester from the Ocean. It employs a membrane-less electrochemical process fueled by renewable energy to harness the ocean’s natural carbon dioxide absorption capacity to capture carbon dioxide efficiently and sustainably. This innovation seamlessly integrates with existing seawater intake infrastructure, offering a proactive approach to reducing carbon dioxide emissions from marine industries. 

GeOME Analytics: Overall Energy Winner – UH Energy Innovation Challenge Winner

GeOME Analytics, led by Preethi Gunaratne, Moores Professor of Biology and Biochemistry at the UH College of Natural Sciences and Mathematics, is a UH startup. The team pitched a field-portable genomics-based approach to reservoir drainage diagnostics for the oil and gas industry. GeOME Analytics has established a field-tested platform that extracts and integrates personalized DNA biomarkers from multiple pads to provide metrics for upstream asset development. GeOME uses the technology to monitor fields during the full production cycles to predict drainage heights, percentage contributions, as well as well-to-well and pad-to-pad communication. Gunaratne, director of UH Sequencing and Gene Editing Core, is the co-founder, president and more at GeOME. Other team members include Marcus Phillips, vice president; postdoctoral researchers Partha Bhagavanthula and Nuwan Acharige; and UH graduate students – Micah Castillo, Dishan Adhikari and Shiyanth Thevasagayampillai.

“We have been excited about this technology, because from the very beginning we felt it had a lot of potential,” said Prince Aleta, a civil and environmental engineering doctoral student and member of the ECHO team. “It’s a very serious issue as far as the need to capture carbon to achieve our climate goals, so we really pushed for it.”

For Ahmad Hassan, a fellow doctoral student and team member, the competition was eye-opening – not only from a business sense but also as a confidence boost.
 
“As we’re from the STEM field, we normally work in lab environments, and I hear people say that what we’re working on has less commercial value and that it would take ages for them to commercialize,” Hassan said. “This gave us the confidence and motivation to move forward.”

He hopes the team’s experience and success inspires other students.

UH Vice President for Energy and Innovation Ramanan Krishnamoorti said this competition not only influences the future of energy, but also redefines the benchmark for brilliance at UH.

“At the University of Houston, we are preparing future leaders and innovators by enabling them to transform the global energy ecosystem with ideas and technologies that are not only cutting-edge and innovative but also valuable to society,” Krishnamoorti said. “We must vividly demonstrate the transformative power of their actions and the power of learning by doing. This competition does that.”

The ECHO team won a $25,000 award from Chevron that will help continue their quest toward commercializing their research.

“The technology that was on display was fascinating,” said Liz Schwarze, vice president of global exploration for Chevron Corp. and sponsor of this year’s competition. “I’m optimistic we can continue to grow this program, because it’s all about creating a culture where we can pursue our scientific and engineering dreams while partnering with business and entrepreneurship along the way to spinoff value to our community faster.”
The other finalists: 

  • Team LiQuidium – Pranjal Sheth, Parisa Taheri, Erin Picton; advised by civil and environmental engineering professor Devin Shaffer. Their presentation focused on lithium extraction from geothermal brines.
  • Aldrogen – Massiagbe Diabate and Bharat Bohara; advised by electrical and computer engineering professor Harish Krishnamoorthy and engineering technology professor Jian Shi. Their pitch centered on an A.I.-powered solution to improving grid resiliency while reducing emissions.
  • MacAlgae – Mahsa Alian; advised by biotechnology professor Venkatesh Balan and mechanical engineering professor Zhu Weihang. This project displayed an environmentally conscious method of mycelium production.

UH Energy, an umbrella for all University of Houston’s energy-related initiatives and programs, focuses on encouraging academic contributions for the energy transition in three distinct areas: research, innovation and education. Part of that effort involves fostering opportunities for students to contribute new solutions to address key issues in energy.

UH, a Carnegie-designated Tier One Research University, encourages students at all levels to engage in innovative and meaningful research. It is this relentless commitment to student success, cutting-edge research and real-world impact that is driving the University closer to realizing its vision of becoming a top 50 public university in the nation.


Read More

Continue Reading

Uncategorized

February Employment Situation

By Paul Gomme and Peter Rupert The establishment data from the BLS showed a 275,000 increase in payroll employment for February, outpacing the 230,000…

Published

on

By Paul Gomme and Peter Rupert

The establishment data from the BLS showed a 275,000 increase in payroll employment for February, outpacing the 230,000 average over the previous 12 months. The payroll data for January and December were revised down by a total of 167,000. The private sector added 223,000 new jobs, the largest gain since May of last year.

Temporary help services employment continues a steep decline after a sharp post-pandemic rise.

Average hours of work increased from 34.2 to 34.3. The increase, along with the 223,000 private employment increase led to a hefty increase in total hours of 5.6% at an annualized rate, also the largest increase since May of last year.

The establishment report, once again, beat “expectations;” the WSJ survey of economists was 198,000. Other than the downward revisions, mentioned above, another bit of negative news was a smallish increase in wage growth, from $34.52 to $34.57.

The household survey shows that the labor force increased 150,000, a drop in employment of 184,000 and an increase in the number of unemployed persons of 334,000. The labor force participation rate held steady at 62.5, the employment to population ratio decreased from 60.2 to 60.1 and the unemployment rate increased from 3.66 to 3.86. Remember that the unemployment rate is the number of unemployed relative to the labor force (the number employed plus the number unemployed). Consequently, the unemployment rate can go up if the number of unemployed rises holding fixed the labor force, or if the labor force shrinks holding the number unemployed unchanged. An increase in the unemployment rate is not necessarily a bad thing: it may reflect a strong labor market drawing “marginally attached” individuals from outside the labor force. Indeed, there was a 96,000 decline in those workers.

Earlier in the week, the BLS announced JOLTS (Job Openings and Labor Turnover Survey) data for January. There isn’t much to report here as the job openings changed little at 8.9 million, the number of hires and total separations were little changed at 5.7 million and 5.3 million, respectively.

As has been the case for the last couple of years, the number of job openings remains higher than the number of unemployed persons.

Also earlier in the week the BLS announced that productivity increased 3.2% in the 4th quarter with output rising 3.5% and hours of work rising 0.3%.

The bottom line is that the labor market continues its surprisingly (to some) strong performance, once again proving stronger than many had expected. This strength makes it difficult to justify any interest rate cuts soon, particularly given the recent inflation spike.

Read More

Continue Reading

Uncategorized

Mortgage rates fall as labor market normalizes

Jobless claims show an expanding economy. We will only be in a recession once jobless claims exceed 323,000 on a four-week moving average.

Published

on

Everyone was waiting to see if this week’s jobs report would send mortgage rates higher, which is what happened last month. Instead, the 10-year yield had a muted response after the headline number beat estimates, but we have negative job revisions from previous months. The Federal Reserve’s fear of wage growth spiraling out of control hasn’t materialized for over two years now and the unemployment rate ticked up to 3.9%. For now, we can say the labor market isn’t tight anymore, but it’s also not breaking.

The key labor data line in this expansion is the weekly jobless claims report. Jobless claims show an expanding economy that has not lost jobs yet. We will only be in a recession once jobless claims exceed 323,000 on a four-week moving average.

From the Fed: In the week ended March 2, initial claims for unemployment insurance benefits were flat, at 217,000. The four-week moving average declined slightly by 750, to 212,250


Below is an explanation of how we got here with the labor market, which all started during COVID-19.

1. I wrote the COVID-19 recovery model on April 7, 2020, and retired it on Dec. 9, 2020. By that time, the upfront recovery phase was done, and I needed to model out when we would get the jobs lost back.

2. Early in the labor market recovery, when we saw weaker job reports, I doubled and tripled down on my assertion that job openings would get to 10 million in this recovery. Job openings rose as high as to 12 million and are currently over 9 million. Even with the massive miss on a job report in May 2021, I didn’t waver.

Currently, the jobs openings, quit percentage and hires data are below pre-COVID-19 levels, which means the labor market isn’t as tight as it once was, and this is why the employment cost index has been slowing data to move along the quits percentage.  

2-US_Job_Quits_Rate-1-2

3. I wrote that we should get back all the jobs lost to COVID-19 by September of 2022. At the time this would be a speedy labor market recovery, and it happened on schedule, too

Total employment data

4. This is the key one for right now: If COVID-19 hadn’t happened, we would have between 157 million and 159 million jobs today, which would have been in line with the job growth rate in February 2020. Today, we are at 157,808,000. This is important because job growth should be cooling down now. We are more in line with where the labor market should be when averaging 140K-165K monthly. So for now, the fact that we aren’t trending between 140K-165K means we still have a bit more recovery kick left before we get down to those levels. 


From BLS: Total nonfarm payroll employment rose by 275,000 in February, and the unemployment rate increased to 3.9 percent, the U.S. Bureau of Labor Statistics reported today. Job gains occurred in health care, in government, in food services and drinking places, in social assistance, and in transportation and warehousing.

Here are the jobs that were created and lost in the previous month:

IMG_5092

In this jobs report, the unemployment rate for education levels looks like this:

  • Less than a high school diploma: 6.1%
  • High school graduate and no college: 4.2%
  • Some college or associate degree: 3.1%
  • Bachelor’s degree or higher: 2.2%
IMG_5093_320f22

Today’s report has continued the trend of the labor data beating my expectations, only because I am looking for the jobs data to slow down to a level of 140K-165K, which hasn’t happened yet. I wouldn’t categorize the labor market as being tight anymore because of the quits ratio and the hires data in the job openings report. This also shows itself in the employment cost index as well. These are key data lines for the Fed and the reason we are going to see three rate cuts this year.

Read More

Continue Reading

Uncategorized

Inside The Most Ridiculous Jobs Report In History: Record 1.2 Million Immigrant Jobs Added In One Month

Inside The Most Ridiculous Jobs Report In History: Record 1.2 Million Immigrant Jobs Added In One Month

Last month we though that the January…

Published

on

Inside The Most Ridiculous Jobs Report In History: Record 1.2 Million Immigrant Jobs Added In One Month

Last month we though that the January jobs report was the "most ridiculous in recent history" but, boy, were we wrong because this morning the Biden department of goalseeked propaganda (aka BLS) published the February jobs report, and holy crap was that something else. Even Goebbels would blush. 

What happened? Let's take a closer look.

On the surface, it was (almost) another blockbuster jobs report, certainly one which nobody expected, or rather just one bank out of 76 expected. Starting at the top, the BLS reported that in February the US unexpectedly added 275K jobs, with just one research analyst (from Dai-Ichi Research) expecting a higher number.

Some context: after last month's record 4-sigma beat, today's print was "only" 3 sigma higher than estimates. Needless to say, two multiple sigma beats in a row used to only happen in the USSR... and now in the US, apparently.

Before we go any further, a quick note on what last month we said was "the most ridiculous jobs report in recent history": it appears the BLS read our comments and decided to stop beclowing itself. It did that by slashing last month's ridiculous print by over a third, and revising what was originally reported as a massive 353K beat to just 229K,  a 124K revision, which was the biggest one-month negative revision in two years!

Of course, that does not mean that this month's jobs print won't be revised lower: it will be, and not just that month but every other month until the November election because that's the only tool left in the Biden admin's box: pretend the economic and jobs are strong, then revise them sharply lower the next month, something we pointed out first last summer and which has not failed to disappoint once.

To be fair, not every aspect of the jobs report was stellar (after all, the BLS had to give it some vague credibility). Take the unemployment rate, after flatlining between 3.4% and 3.8% for two years - and thus denying expectations from Sahm's Rule that a recession may have already started - in February the unemployment rate unexpectedly jumped to 3.9%, the highest since February 2022 (with Black unemployment spiking by 0.3% to 5.6%, an indicator which the Biden admin will quickly slam as widespread economic racism or something).

And then there were average hourly earnings, which after surging 0.6% MoM in January (since revised to 0.5%) and spooking markets that wage growth is so hot, the Fed will have no choice but to delay cuts, in February the number tumbled to just 0.1%, the lowest in two years...

... for one simple reason: last month's average wage surge had nothing to do with actual wages, and everything to do with the BLS estimate of hours worked (which is the denominator in the average wage calculation) which last month tumbled to just 34.1 (we were led to believe) the lowest since the covid pandemic...

... but has since been revised higher while the February print rose even more, to 34.3, hence why the latest average wage data was once again a product not of wages going up, but of how long Americans worked in any weekly period, in this case higher from 34.1 to 34.3, an increase which has a major impact on the average calculation.

While the above data points were examples of some latent weakness in the latest report, perhaps meant to give it a sheen of veracity, it was everything else in the report that was a problem starting with the BLS's latest choice of seasonal adjustments (after last month's wholesale revision), which have gone from merely laughable to full clownshow, as the following comparison between the monthly change in BLS and ADP payrolls shows. The trend is clear: the Biden admin numbers are now clearly rising even as the impartial ADP (which directly logs employment numbers at the company level and is far more accurate), shows an accelerating slowdown.

But it's more than just the Biden admin hanging its "success" on seasonal adjustments: when one digs deeper inside the jobs report, all sorts of ugly things emerge... such as the growing unprecedented divergence between the Establishment (payrolls) survey and much more accurate Household (actual employment) survey. To wit, while in January the BLS claims 275K payrolls were added, the Household survey found that the number of actually employed workers dropped for the third straight month (and 4 in the past 5), this time by 184K (from 161.152K to 160.968K).

This means that while the Payrolls series hits new all time highs every month since December 2020 (when according to the BLS the US had its last month of payrolls losses), the level of Employment has not budged in the past year. Worse, as shown in the chart below, such a gaping divergence has opened between the two series in the past 4 years, that the number of Employed workers would need to soar by 9 million (!) to catch up to what Payrolls claims is the employment situation.

There's more: shifting from a quantitative to a qualitative assessment, reveals just how ugly the composition of "new jobs" has been. Consider this: the BLS reports that in February 2024, the US had 132.9 million full-time jobs and 27.9 million part-time jobs. Well, that's great... until you look back one year and find that in February 2023 the US had 133.2 million full-time jobs, or more than it does one year later! And yes, all the job growth since then has been in part-time jobs, which have increased by 921K since February 2023 (from 27.020 million to 27.941 million).

Here is a summary of the labor composition in the past year: all the new jobs have been part-time jobs!

But wait there's even more, because now that the primary season is over and we enter the heart of election season and political talking points will be thrown around left and right, especially in the context of the immigration crisis created intentionally by the Biden administration which is hoping to import millions of new Democratic voters (maybe the US can hold the presidential election in Honduras or Guatemala, after all it is their citizens that will be illegally casting the key votes in November), what we find is that in February, the number of native-born workers tumbled again, sliding by a massive 560K to just 129.807 million. Add to this the December data, and we get a near-record 2.4 million plunge in native-born workers in just the past 3 months (only the covid crash was worse)!

The offset? A record 1.2 million foreign-born (read immigrants, both legal and illegal but mostly illegal) workers added in February!

Said otherwise, not only has all job creation in the past 6 years has been exclusively for foreign-born workers...

Source: St Louis Fed FRED Native Born and Foreign Born

... but there has been zero job-creation for native born workers since June 2018!

This is a huge issue - especially at a time of an illegal alien flood at the southwest border...

... and is about to become a huge political scandal, because once the inevitable recession finally hits, there will be millions of furious unemployed Americans demanding a more accurate explanation for what happened - i.e., the illegal immigration floodgates that were opened by the Biden admin.

Which is also why Biden's handlers will do everything in their power to insure there is no official recession before November... and why after the election is over, all economic hell will finally break loose. Until then, however, expect the jobs numbers to get even more ridiculous.

Tyler Durden Fri, 03/08/2024 - 13:30

Read More

Continue Reading

Trending