Uncategorized
Trade What You See; Profits are Waiting Beyond the Daily Grind
As the mainstream focuses on negative developments, such as the Fed’s latest utterings and the implosion of subsets of the commercial real estate (CRE)…
Share this:

As the mainstream focuses on negative developments, such as the Fed's latest utterings and the implosion of subsets of the commercial real estate (CRE) sector, there seems to be a stealthy migration of money into other select areas of the market. This is a great example of why focusing on the markets instead of the external noise is the best way to trade.
Trade What You See
There's an old saying among wise veteran traders: "trade what you see." And the current market is a perfect place in which this adage holds up.
As investors await the Fed's nearly certain rate increase on May 3rd, the daily options market-related gyrations in stocks continue to develop. Meanwhile, the four-prong post-COVID pandemic megatrend continues to evolve, as I discuss in detail in my latest Your Daily Five video. Said megatrend is composed of:
- The Great Migration – population shifts to suburbs, rural areas, and the sunbelt;
- The CRE Implosion from an oversupply of office space;
- Bullish Supply Dynamics for Homebuilders; and
- The Evolving End of Globalization.
As a result, the only solution is to be contrarian, to trade what you see, and to focus on investments from a longer-term viewpoint. Stated plainly, if a stock is not crashing and the underlying business is performing reasonably well, then it's a keeper until proven otherwise.
Even better, as I detail below, detecting trend changes early is very helpful.
The Evolution of the Commercial Real Estate Crash
There is more nuance than what meets the mainstream eye going on in the beleaguered CRE market.
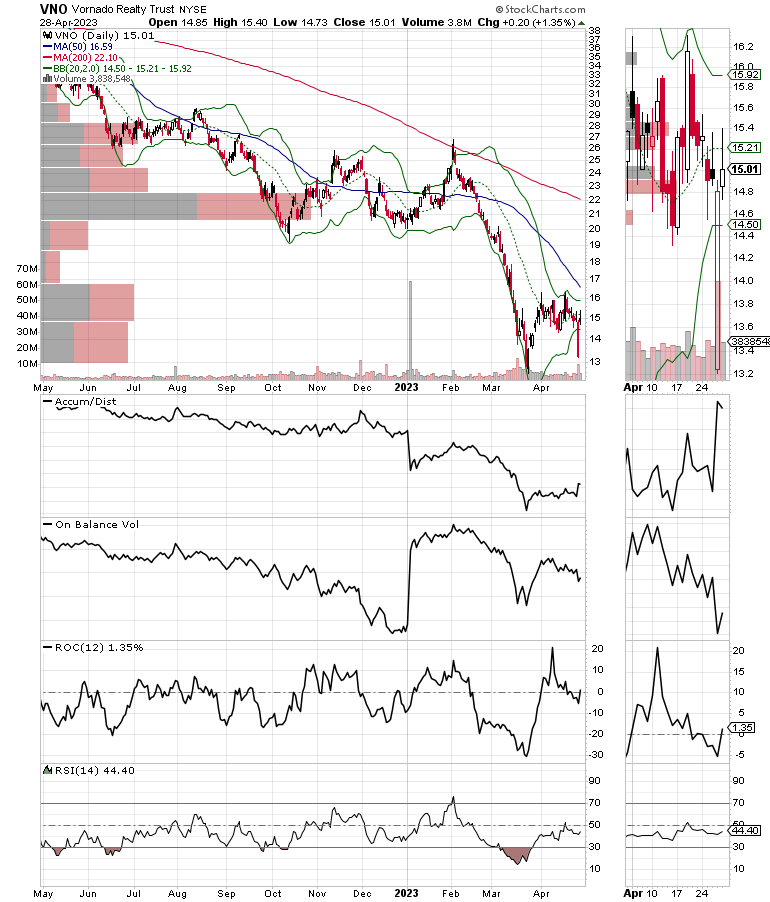
For example, the big news of the week was Vornado's (NYSE: VNO) dividend cut, which sent the shares lower as investors braced for worse news, such as the possibility of loan defaults. If that happens, few would be surprised.
The price chart's Accumulation Distribution (ADI) shows that short sellers have had a field day with the shares over the past twelve months, especially during the last quarter. On Balance Volume (OBV) also indicates more sellers than buyers have been the norm of late.
But things may be changing in other areas of the real estate business. And a closer look at VNO's shares shows that the one day mini-crash in the stock on 4/27/23 was followed by a bounce which, of course, was short-covering.
As I described in my recent Your Daily Five video, the evolution of the post-pandemic megatrend is evolving into a new and quite investable phase. That's because the market is slowly adapting to its circumstances as businesses adjust to the changing landscape. And as one section of the real estate investment trust (REIT) world is suffering, other areas are starting to show signs of life.
To be specific, REITs, which are heavily laden with office building properties that are having trouble paying their bills. Loan defaults are becoming quite common; foreclosures and bankruptcies are likely to rise. On the other hand, those REITs who derive their income from residential properties are faring better. The result is an unexpected improvement in the price chart for the iShares U.S. Real Estate ETF (IYR).
The price chart for IYR shows that the entire sector still has plenty of work to do. But amazingly, REITs may have bottomed out. All of which suggests that the stock market may be starting to quietly price in a pause in the Fed's interest-raising cycle after the almost-certain rate increase, which is expected on May 3.
IYR's Accumulation/Distribution indicator (ADI) suggests that short sellers may have lost their enthusiasm for the sector. On the other hand, On Balance Volume (OBV) is still bottoming out, which suggests that buyers have not overwhelmed sellers altogether.
Still, the ETF is trading tightly near the $84 area, where there is a large Volume by Price bar (VBP). If the price can move above this key price point, we are likely to see a challenge of the 200-day moving average.
A move above that would be bullish. I have just added two long REIT plays to my portfolio. Get the details with a free trial to my service here.
Bond Yields Turn Lower at 3.5%. Home Buyers Play Cat and Mouse with Mortgage Rates.
The bond market continues to price in a slowing of the economy, while homebuyers continue to play a nifty game of cat and mouse as they try to time the mortgage market. Homebuilder stocks continue to move higher.

Over the last few weeks, the Fed hinted that another rate increase was coming at its May 2-3 FOMC meeting. Initially, this bearish talk pushed the U.S. Ten Year Note (TNX) despite above the 3.5% yield area. This resulted in a rise of the 30-year mortgage to 6.4%, where it has remained for the last couple of weeks.
This upside reversal delivered a slowing in existing home sales. But the reversal in bond yields on the week ended on 4/28 is likely to lead to yet another reversal in mortgage rates. Moreover, savvy potential homebuyers are likely calling their bankers as I write in order to lock in rates before the official numbers are released next week.

Note the close relationship between TNX, mortgage rates, and the steady uptrend in the homebuilder sector (SPHB). Specifically, take a look at the rally in SPHB, which was spawned when the average mortgage rate topped out in late 2022 above 7%. The subsequent decline in mortgages has been a boon for homebuilders.
For an in-depth comprehensive outlook on the homebuilder sector, click here.
NYAD Seems to Have Nine-Lives. NDX Breaks Out.
The New York Stock Exchange Advance Decline line (NYAD) once again survived a potential breakdown as it continues to hug its 50-day moving average, while remaining well above its long-term dividing line between bull and bear trends, the 200-day moving average. It would be nice to see breadth improve, but the fact that it has not broken down altogether is very encouraging.

The S&P 500 (SPX) continues to hold between 4100 – 4200, but is getting closer to what could be a major breakout if it can get above the 4200 area. On Balance Volume (OBV) and Accumulation Distribution (ADI) remain very constructive for SPX.

For its part, the Nasdaq 100 Index (NDX) closed above 13,200 on 4/29/23, scoring a nifty breakout with OBV starting to turn up a bit more decisively. If NDX can stay above 13,200, the odds of a significant move higher are well above-average.

These are bullish developments, which suggests money is moving into technology stocks. When tech stocks rally, they often give the whole market a boost.
VIX Makes New Lows
The CBOE Volatility Index (VIX) again broke to a new low and is now well below 20, a sign that the bears are throwing in the towel. This remains bullish despite the intraday volatility in the options market.
When VIX rises, stocks tend to fall, as rising put volume is a sign that market makers are selling stock index futures in order to hedge their put sales to the public. A fall in VIX is bullish, as it means less put option buying, and it eventually leads to call buying, which causes market makers to hedge by buying stock index futures. This raises the odds of higher stock prices.
Liquidity is Stable. Upcoming Rate Hike Could Crimp.
The market's liquidity retreated as the Eurodollar Index (XED) remains a question mark, even though, for now, it remains stable, yet below 94.75 on Fed hike expectations. A move above 95 will be a bullish development. Usually, a stable or rising XED is very bullish for stocks. On the other hand, in the current environment, it's more of a sign that fear is rising and investors are raising cash.
To get the latest up-to-date information on options trading, check out Options Trading for Dummies, now in its 4th Edition—Get Your Copy Now! Now also available in Audible audiobook format!
 #1 New Release on Options Trading!
Good news! I've made my NYAD-Complexity - Chaos chart (featured on my YD5 videos) and a few other favorites public. You can find them here.
Joe Duarte
In The Money Options
Joe Duarte is a former money manager, an active trader, and a widely recognized independent stock market analyst since 1987. He is author of eight investment books, including the best-selling Trading Options for Dummies, rated a TOP Options Book for 2018 by Benzinga.com and now in its third edition, plus The Everything Investing in Your 20s and 30s Book and six other trading books.
The Everything Investing in Your 20s and 30s Book is available at Amazon and Barnes and Noble. It has also been recommended as a Washington Post Color of Money Book of the Month.
To receive Joe's exclusive stock, option and ETF recommendations, in your mailbox every week visit https://joeduarteinthemoneyoptions.com/secure/order_email.asp.
bankruptcies pandemic sp 500 nasdaq stocks fomc fed reit home sales mortgage rates real estate mortgages etfUncategorized
February Employment Situation
By Paul Gomme and Peter Rupert The establishment data from the BLS showed a 275,000 increase in payroll employment for February, outpacing the 230,000…
Share this:


By Paul Gomme and Peter Rupert
The establishment data from the BLS showed a 275,000 increase in payroll employment for February, outpacing the 230,000 average over the previous 12 months. The payroll data for January and December were revised down by a total of 167,000. The private sector added 223,000 new jobs, the largest gain since May of last year.

Temporary help services employment continues a steep decline after a sharp post-pandemic rise.


Average hours of work increased from 34.2 to 34.3. The increase, along with the 223,000 private employment increase led to a hefty increase in total hours of 5.6% at an annualized rate, also the largest increase since May of last year.

The establishment report, once again, beat “expectations;” the WSJ survey of economists was 198,000. Other than the downward revisions, mentioned above, another bit of negative news was a smallish increase in wage growth, from $34.52 to $34.57.

The household survey shows that the labor force increased 150,000, a drop in employment of 184,000 and an increase in the number of unemployed persons of 334,000. The labor force participation rate held steady at 62.5, the employment to population ratio decreased from 60.2 to 60.1 and the unemployment rate increased from 3.66 to 3.86. Remember that the unemployment rate is the number of unemployed relative to the labor force (the number employed plus the number unemployed). Consequently, the unemployment rate can go up if the number of unemployed rises holding fixed the labor force, or if the labor force shrinks holding the number unemployed unchanged. An increase in the unemployment rate is not necessarily a bad thing: it may reflect a strong labor market drawing “marginally attached” individuals from outside the labor force. Indeed, there was a 96,000 decline in those workers.


Earlier in the week, the BLS announced JOLTS (Job Openings and Labor Turnover Survey) data for January. There isn’t much to report here as the job openings changed little at 8.9 million, the number of hires and total separations were little changed at 5.7 million and 5.3 million, respectively.

As has been the case for the last couple of years, the number of job openings remains higher than the number of unemployed persons.

Also earlier in the week the BLS announced that productivity increased 3.2% in the 4th quarter with output rising 3.5% and hours of work rising 0.3%.

The bottom line is that the labor market continues its surprisingly (to some) strong performance, once again proving stronger than many had expected. This strength makes it difficult to justify any interest rate cuts soon, particularly given the recent inflation spike.
unemployment pandemic unemploymentUncategorized
Mortgage rates fall as labor market normalizes
Jobless claims show an expanding economy. We will only be in a recession once jobless claims exceed 323,000 on a four-week moving average.
Share this:


Everyone was waiting to see if this week’s jobs report would send mortgage rates higher, which is what happened last month. Instead, the 10-year yield had a muted response after the headline number beat estimates, but we have negative job revisions from previous months. The Federal Reserve’s fear of wage growth spiraling out of control hasn’t materialized for over two years now and the unemployment rate ticked up to 3.9%. For now, we can say the labor market isn’t tight anymore, but it’s also not breaking.
The key labor data line in this expansion is the weekly jobless claims report. Jobless claims show an expanding economy that has not lost jobs yet. We will only be in a recession once jobless claims exceed 323,000 on a four-week moving average.
From the Fed: In the week ended March 2, initial claims for unemployment insurance benefits were flat, at 217,000. The four-week moving average declined slightly by 750, to 212,250
Below is an explanation of how we got here with the labor market, which all started during COVID-19.
1. I wrote the COVID-19 recovery model on April 7, 2020, and retired it on Dec. 9, 2020. By that time, the upfront recovery phase was done, and I needed to model out when we would get the jobs lost back.
2. Early in the labor market recovery, when we saw weaker job reports, I doubled and tripled down on my assertion that job openings would get to 10 million in this recovery. Job openings rose as high as to 12 million and are currently over 9 million. Even with the massive miss on a job report in May 2021, I didn’t waver.
Currently, the jobs openings, quit percentage and hires data are below pre-COVID-19 levels, which means the labor market isn’t as tight as it once was, and this is why the employment cost index has been slowing data to move along the quits percentage.

3. I wrote that we should get back all the jobs lost to COVID-19 by September of 2022. At the time this would be a speedy labor market recovery, and it happened on schedule, too
Total employment data
4. This is the key one for right now: If COVID-19 hadn’t happened, we would have between 157 million and 159 million jobs today, which would have been in line with the job growth rate in February 2020. Today, we are at 157,808,000. This is important because job growth should be cooling down now. We are more in line with where the labor market should be when averaging 140K-165K monthly. So for now, the fact that we aren’t trending between 140K-165K means we still have a bit more recovery kick left before we get down to those levels.

From BLS: Total nonfarm payroll employment rose by 275,000 in February, and the unemployment rate increased to 3.9 percent, the U.S. Bureau of Labor Statistics reported today. Job gains occurred in health care, in government, in food services and drinking places, in social assistance, and in transportation and warehousing.
Here are the jobs that were created and lost in the previous month:

In this jobs report, the unemployment rate for education levels looks like this:
- Less than a high school diploma: 6.1%
- High school graduate and no college: 4.2%
- Some college or associate degree: 3.1%
- Bachelor’s degree or higher: 2.2%

Today’s report has continued the trend of the labor data beating my expectations, only because I am looking for the jobs data to slow down to a level of 140K-165K, which hasn’t happened yet. I wouldn’t categorize the labor market as being tight anymore because of the quits ratio and the hires data in the job openings report. This also shows itself in the employment cost index as well. These are key data lines for the Fed and the reason we are going to see three rate cuts this year.
recession unemployment covid-19 fed federal reserve mortgage rates recession recovery unemploymentUncategorized
Inside The Most Ridiculous Jobs Report In History: Record 1.2 Million Immigrant Jobs Added In One Month
Inside The Most Ridiculous Jobs Report In History: Record 1.2 Million Immigrant Jobs Added In One Month
Last month we though that the January…
Share this:


Last month we though that the January jobs report was the "most ridiculous in recent history" but, boy, were we wrong because this morning the Biden department of goalseeked propaganda (aka BLS) published the February jobs report, and holy crap was that something else. Even Goebbels would blush.
What happened? Let's take a closer look.
On the surface, it was (almost) another blockbuster jobs report, certainly one which nobody expected, or rather just one bank out of 76 expected. Starting at the top, the BLS reported that in February the US unexpectedly added 275K jobs, with just one research analyst (from Dai-Ichi Research) expecting a higher number.
Some context: after last month's record 4-sigma beat, today's print was "only" 3 sigma higher than estimates. Needless to say, two multiple sigma beats in a row used to only happen in the USSR... and now in the US, apparently.

Before we go any further, a quick note on what last month we said was "the most ridiculous jobs report in recent history": it appears the BLS read our comments and decided to stop beclowing itself. It did that by slashing last month's ridiculous print by over a third, and revising what was originally reported as a massive 353K beat to just 229K, a 124K revision, which was the biggest one-month negative revision in two years!

Of course, that does not mean that this month's jobs print won't be revised lower: it will be, and not just that month but every other month until the November election because that's the only tool left in the Biden admin's box: pretend the economic and jobs are strong, then revise them sharply lower the next month, something we pointed out first last summer and which has not failed to disappoint once.
In the past month the Biden department of goalseeking stuff higher before revising it lower, has revised the following data sharply lower:
— zerohedge (@zerohedge) August 30, 2023
- Jobs
- JOLTS
- New Home sales
- Housing Starts and Permits
- Industrial Production
- PCE and core PCE
To be fair, not every aspect of the jobs report was stellar (after all, the BLS had to give it some vague credibility). Take the unemployment rate, after flatlining between 3.4% and 3.8% for two years - and thus denying expectations from Sahm's Rule that a recession may have already started - in February the unemployment rate unexpectedly jumped to 3.9%, the highest since February 2022 (with Black unemployment spiking by 0.3% to 5.6%, an indicator which the Biden admin will quickly slam as widespread economic racism or something).

And then there were average hourly earnings, which after surging 0.6% MoM in January (since revised to 0.5%) and spooking markets that wage growth is so hot, the Fed will have no choice but to delay cuts, in February the number tumbled to just 0.1%, the lowest in two years...

... for one simple reason: last month's average wage surge had nothing to do with actual wages, and everything to do with the BLS estimate of hours worked (which is the denominator in the average wage calculation) which last month tumbled to just 34.1 (we were led to believe) the lowest since the covid pandemic...

... but has since been revised higher while the February print rose even more, to 34.3, hence why the latest average wage data was once again a product not of wages going up, but of how long Americans worked in any weekly period, in this case higher from 34.1 to 34.3, an increase which has a major impact on the average calculation.

While the above data points were examples of some latent weakness in the latest report, perhaps meant to give it a sheen of veracity, it was everything else in the report that was a problem starting with the BLS's latest choice of seasonal adjustments (after last month's wholesale revision), which have gone from merely laughable to full clownshow, as the following comparison between the monthly change in BLS and ADP payrolls shows. The trend is clear: the Biden admin numbers are now clearly rising even as the impartial ADP (which directly logs employment numbers at the company level and is far more accurate), shows an accelerating slowdown.

But it's more than just the Biden admin hanging its "success" on seasonal adjustments: when one digs deeper inside the jobs report, all sorts of ugly things emerge... such as the growing unprecedented divergence between the Establishment (payrolls) survey and much more accurate Household (actual employment) survey. To wit, while in January the BLS claims 275K payrolls were added, the Household survey found that the number of actually employed workers dropped for the third straight month (and 4 in the past 5), this time by 184K (from 161.152K to 160.968K).

This means that while the Payrolls series hits new all time highs every month since December 2020 (when according to the BLS the US had its last month of payrolls losses), the level of Employment has not budged in the past year. Worse, as shown in the chart below, such a gaping divergence has opened between the two series in the past 4 years, that the number of Employed workers would need to soar by 9 million (!) to catch up to what Payrolls claims is the employment situation.

There's more: shifting from a quantitative to a qualitative assessment, reveals just how ugly the composition of "new jobs" has been. Consider this: the BLS reports that in February 2024, the US had 132.9 million full-time jobs and 27.9 million part-time jobs. Well, that's great... until you look back one year and find that in February 2023 the US had 133.2 million full-time jobs, or more than it does one year later! And yes, all the job growth since then has been in part-time jobs, which have increased by 921K since February 2023 (from 27.020 million to 27.941 million).

Here is a summary of the labor composition in the past year: all the new jobs have been part-time jobs!

But wait there's even more, because now that the primary season is over and we enter the heart of election season and political talking points will be thrown around left and right, especially in the context of the immigration crisis created intentionally by the Biden administration which is hoping to import millions of new Democratic voters (maybe the US can hold the presidential election in Honduras or Guatemala, after all it is their citizens that will be illegally casting the key votes in November), what we find is that in February, the number of native-born workers tumbled again, sliding by a massive 560K to just 129.807 million. Add to this the December data, and we get a near-record 2.4 million plunge in native-born workers in just the past 3 months (only the covid crash was worse)!

The offset? A record 1.2 million foreign-born (read immigrants, both legal and illegal but mostly illegal) workers added in February!

Said otherwise, not only has all job creation in the past 6 years has been exclusively for foreign-born workers...

... but there has been zero job-creation for native born workers since June 2018!

This is a huge issue - especially at a time of an illegal alien flood at the southwest border...

... and is about to become a huge political scandal, because once the inevitable recession finally hits, there will be millions of furious unemployed Americans demanding a more accurate explanation for what happened - i.e., the illegal immigration floodgates that were opened by the Biden admin.
Which is also why Biden's handlers will do everything in their power to insure there is no official recession before November... and why after the election is over, all economic hell will finally break loose. Until then, however, expect the jobs numbers to get even more ridiculous.


-

 Uncategorized2 weeks ago
All Of The Elements Are In Place For An Economic Crisis Of Staggering Proportions
-

 Uncategorized1 month ago
Cathie Wood sells a major tech stock (again)
-

 Uncategorized3 weeks ago
California Counties Could Be Forced To Pay $300 Million To Cover COVID-Era Program
-

 Uncategorized2 weeks ago
Apparel Retailer Express Moving Toward Bankruptcy
-

 Uncategorized3 weeks ago
Industrial Production Decreased 0.1% in January
-

 International2 days ago
Walmart launches clever answer to Target’s new membership program
-

 International2 days ago
EyePoint poaches medical chief from Apellis; Sandoz CFO, longtime BioNTech exec to retire
-

 Uncategorized3 weeks ago
RFK Jr: The Wuhan Cover-Up & The Rise Of The Biowarfare-Industrial Complex