Uncategorized
Tokenized Real World Assets (RWA): Where are they now?
There is nothing in the world that is more scrutinized than money. How could it not be when money relays information on the value of…everything? And…
Share this:

There is nothing in the world that is more scrutinized than money. How could it not be when money relays information on the value of…everything? And all economic activity arises from that record-keeping, if it is conducted accurately.
When Bitcoin launched in 2009, it opened a new door, a new perspective on how that information is managed and transferred. Or, more precisely, blockchain technology did. While Satoshi Nakamoto envisioned Bitcoin as self-contained and sovereign even from governments and central banks, blockchain is a neutral tool.
One that can spur another FinTech wave – tokenization of real-world assets (RWAs). These types of tokens have all the hallmarks of blockchain assets – transparency, efficiency and self-custody – backed by real-world assets.
Internet > Blockchain > Tokenization
Blockchain technology was critical in establishing the trust needed for Bitcoin to evolve into a digital asset worth half a trillion dollars. By leveraging cryptography with chained data blocks, wherein each new block is dependent on the previous one, Bitcoin is the pioneering proof-of-concept that digital records can be made immutable.
And if real-world value can be brought into the digital world securely, we are at the doorstep of a new era. The era of the tokenization of real-world assets (RWAs). If something is legally definable as an asset, that logic can be tokenized into a tradable asset. For this reason, the RWA scope is limitless, ranging from real estate, art and securities to debt instruments, luxury goods and fund-raising equities.
RWA tokenization is groundbreaking in that it opens 24/7 trading doors to a global market, previously reserved for exclusive institutions. On top of that, even non-fungible assets like machinery or commodities could be made fungible with fractional ownership. Above all else, RWA tokenization reduces the friction of capital flows by removing, or drastically reducing, intermediaries.
Yet, regarding something as important as value, “groundbreaking” innovation often takes a back seat to caution. Moreover, it is unclear that intermediaries could be removed in all instances, which would mute the entire point of tokenized RWAs. With that in mind, how do we view the current state of RWA tokenization and its future?
Measuring the Momentum of Monetary Innovation
Blockchain technology is both new and revolutionary. One approach to gauge its adoption rate is to view investor interest. However, this often results in hype bubbles that don’t indicate its longevity. By the same token, bubbles are another indicator if framed properly.
Fourteen years after Bitcoin emerged, 4.2% of the global population, over 420 million, engage with blockchain technology by holding crypto assets. Is this percentage good or bad? How do we anchor it in a reference point to measure the RWA tokenization rate?
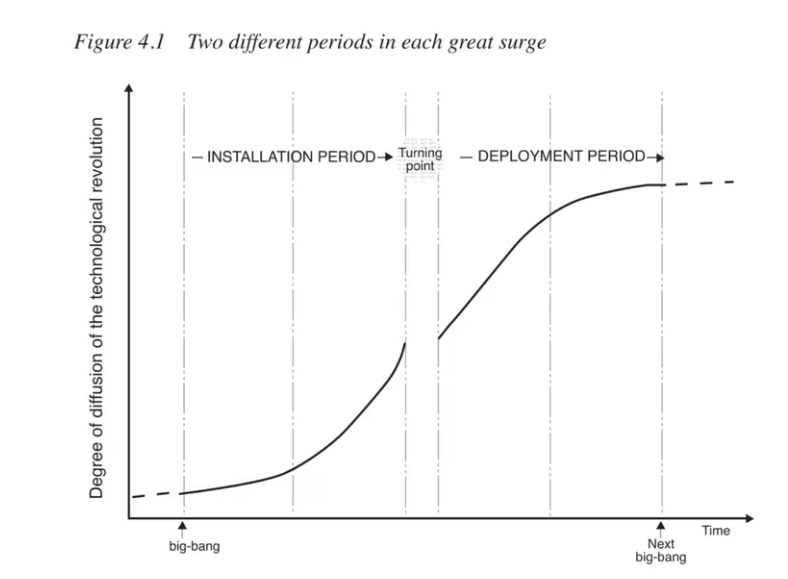
Economist Carlota Perez developed a framework to gauge the long-term dynamics of technological disruption. This “Perezian framework” revolves around the adoption phases of a cycle:
- Irruption – New tech emergence that disrupts existing industries.
- Installation – The economy and society restructures around the new tech, accompanied by new business models and regulatory frameworks.
- Bubble – Frenzy stage during installation in which investors become overly optimistic, accompanied by speculation and financial bubbles leading to crisis (bubble bursts) and stagnation.
- Synergy – The post-bubble burst recovery, wherein the surviving investors adopt the new tech more efficiently.
In the golden phase, maturity, the new tech is fully integrated into the social and economic fabric. This typically lasts several decades until the point of diminishing returns or until the next irruption.
As one reads through these phases, one can immediately recall the dot-com bubble in the late 1990s, wherein the core “irruption” was the internet itself, as a prerequisite for Bitcoin and tokenization.
By October 2002, the Nasdaq Composite, representing internet-centered companies, plunged 740% from its peak in March 2000. If we apply the Perezian framework, we have already gone from one irruption (the internet) to the next (blockchain).
Further, considering the relentless string of bankruptcies in 2022, from Terra and Celsius to FTX, we have reached the bubble burst stage. This is also apparent from a withdrawal of VC capital. According to PitchBook data, the first half of 2023 saw only 814 crypto deals go down, compared to 1,862 in 2022.
Reminiscent of the dot-com bubble burst, this capital drought translates to only $325 million in investments in crypto startups in Q2 2023 vs. $3.5 billion in the peak of Q1 2021. In other words, RWA tokenization is leaving behind the bubble phase to the synergy phase.
RWA Tokens: Resilience from Decentralization
As previously noted, tokenized RWAs only constitute “irruption” if it is possible to reliably claim an asset without an intermediary. Case in point, let’s say a farmer buys a token to expand operations. This particular tokenized RWA would represent farming equipment like a tractor.
This token is available on a certain platform. The farmer would pay less for the token/tractor because he wouldn’t have to deal with an intermediary such as a dealership. But what happens if that platform goes bust for some reason?
Without the platform that issued the token, how would the farmer redeem the token or claim ownership of the tractor in the future when he intends to sell it?
The solution comes in the form of smart contracts that are hosted on a large blockchain network, such as Ethereum. One may recall that the US Treasury sanctioned currency mixer Tornado Cash. Yet, even with the sanction, the underlying smart contract continued to be hosted, although without the web interface provided by Infura/Alchemy.
Then, it was only a matter of circumventing the block with Interplanetary File Storage. This is the kind of decentralized finance (DeFi) resilience investors expect when buying hard assets as tokens. As long as the blockchain network is live, secured by thousands of nodes across the globe, redeemability is independent of trust on any Web3 platform.
In other words, tokenized RWAs serve as redeemable smart contracts, irreversible to cancellation. We have already seen it with non-fungible tokens (NFTs) which can define the conditions of ownership/royalties, including fractional ownership. RWA tokens will further expand smart contract logic to cover disputes by decentralized dispute resolvers.
The Current Landscape of Tokenized RWAs
As fiat currency tokenizers, stablecoins have been pushing the RWA market the , while cryptocurrencies can monetize specific projects or serve as scarce commodities. For instance, Bitcoin mimics digital gold. On the other hand, NFTs tokenize general property rights for ebooks, albums and artworks. General RWA tokenization is the natural step forward.
The first wave will deal with assets that don’t require additional infrastructure, such as the Internet of Things (IoT). After all, hard assets would have to integrate real-time tracking in order for their status (location/price) to be broadcasted to blockchain networks.
The earliest form of this technology is present in parcel tracking. For this reason, more abstract RWAs will have priority. Larry Fink, the CEO of the world’s largest asset manager, BlackRock, had hinted that these would be familiar stocks, bonds, and other financial instruments.
Blackrock is the world’s largest asset manager with $10 trillion in AUM.
Blackrock CEO Larry Fink:
“I believe the next generation for markets… for securities, will be tokenization of securities.” pic.twitter.com/f3MmASXywi
— The Tokenist (@thetokenist) January 20, 2023
Startups Tzero and Securitze have established themselves as veteran tokenizers. Likewise, Goldman Sachs’s Digital Asset Platform (DAP) went online in January. Major US banks and Big Tech companies have joined to build tokenized products on a permission blockchain network called Canton.
Digital Asset developed the Canton Network, with Goldman Sachs as the main DA investor. Surprisingly, even outside financial institutions joined in. The European Investment Bank (EIB) had already issued a second euro-denominated digital bond on Canton.
On permissionless networks, tokenized bonds constitute a $630.2 million market, at an average yield of 5.25%. Notably, German tech giant Siemens used Polygon to issue its first corporate digital bond worth €60 million, with a maturity of one year.

One RWA dApp, as an outgrowth of the popular lending dApp AAVE, holds a $7 million market size. Suffice to say, all of these are way under one-billion figures. This is why the range for the global RWA market is so speculative right now. Boston Consulting Group forecasts on-chain RWA activity to reach between $4 trillion to $16 trillion by 2030.
The rise in retail trader communication as seen through Discord servers focused on stock trading has the potential to forge a path into tokenized RWAs too. According to CySEC, nearly 22% of retail investors source their trading ideas from social media platforms. Furthermore, these communities serve as a breeding ground for innovative ideas, so it’s not hard to see tokenized RWAs getting traction there as well – in this new ‘home’ of the retail trader.
In the near future, as a percentage of global GDP, the tokenized market should reach 2.5% by 2025, mainly in home equity and bonds. The real adoption should manifest with more diverse “other tokenizable assets” in late 2020s.
Alongside blockchain and crypto assets, understanding traditional financial instruments like options trading is very important as they still continue to play a role in market dynamics. Their coexistence and potential synergies with tokenized assets could become a fascinating area of study and investment as this new era of financial diversification unfolds.

RWAs’ End-Goal: Turing-Complete Economy
Due to the investment drought left over by the crypto winter, termination of the banks embracing cryptocurrency, and the Fed’s hiking cycle that made capital more expensive, we are still in the pioneering stage of the global RWA market.
Nonetheless, the world’s premiere network that combines academic, social, political and economic capital, the World Economic Forum (WEF), is fully onboard with tokenization. According to prof.Jason Potts from RMIT University, the end-goal of RWA tokenization is to “replicate real-world social infrastructure in a digital world.”
Under the Agenda 2030, prof. Potts envisions a new kind of commerce that seamlessly fuses physical and digital economy into a “computable economy”. That is the last cog of the tokenized puzzle. If all the world’s assets are tokenized, and accessible on a public ledger, this would enable a “turing-complete economy”.
Mirroring the Turing machine theory, such an economy could model any possible economic system because there would be total accounting of assets. In that scenario, the entire economic system could be simulated. And if something can be simulated, it can be directed to follow optimal outcomes.
This is a natural outgrowth of the WEF’s stakeholder capitalism concept, which branches out from the narrow shareholder interest to all stakeholders in wider communities.
Conclusion
Ownership representation has come a long way from stone tablets. It turns out, the method of representation matters greatly. When the internet came along, people were amazed they could communicate permissionlessly with anyone worldwide.
Another amazement is on the way, in the form of tokenized real-world assets (RWAs). Just as one taps into a social network, it will be possible to access global ownership ledger. Although divided between permissioned and permissionless, a tokenized market will bring a new era of liquidity.
In that arena, both buyers and sellers can acquire and sell assets easily, transparently and with less capital friction typically generated by intermediaries. In the end-game of tokenization, we might even see a shift to a new economic paradigm as new monetary systems are simulated and enacted.
The post Tokenized Real World Assets (RWA): Where are they now? appeared first on CryptoSlate.
bonds nasdaq equities stocks cryptocurrency bitcoin ethereum blockchain crypto real estate euro crypto commodities goldUncategorized
NY Fed Finds Medium, Long-Term Inflation Expectations Jump Amid Surge In Stock Market Optimism
NY Fed Finds Medium, Long-Term Inflation Expectations Jump Amid Surge In Stock Market Optimism
One month after the inflation outlook tracked…
Share this:


One month after the inflation outlook tracked by the NY Fed Consumer Survey extended their late 2023 slide, with 3Y inflation expectations in January sliding to a record low 2.4% (from 2.6% in December), even as 1 and 5Y inflation forecasts remained flat, moments ago the NY Fed reported that in February there was a sharp rebound in longer-term inflation expectations, rising to 2.7% from 2.4% at the three-year ahead horizon, and jumping to 2.9% from 2.5% at the five-year ahead horizon, while the 1Y inflation outlook was flat for the 3rd month in a row, stuck at 3.0%.
The increases in both the three-year ahead and five-year ahead measures were most pronounced for respondents with at most high school degrees (in other words, the "really smart folks" are expecting deflation soon). The survey’s measure of disagreement across respondents (the difference between the 75th and 25th percentile of inflation expectations) decreased at all horizons, while the median inflation uncertainty—or the uncertainty expressed regarding future inflation outcomes—declined at the one- and three-year ahead horizons and remained unchanged at the five-year ahead horizon.
Going down the survey, we find that the median year-ahead expected price changes increased by 0.1 percentage point to 4.3% for gas; decreased by 1.8 percentage points to 6.8% for the cost of medical care (its lowest reading since September 2020); decreased by 0.1 percentage point to 5.8% for the cost of a college education; and surprisingly decreased by 0.3 percentage point for rent to 6.1% (its lowest reading since December 2020), and remained flat for food at 4.9%.

We find the rent expectations surprising because it is happening just asking rents are rising across the country.

At the same time as consumers erroneously saw sharply lower rents, median home price growth expectations remained unchanged for the fifth consecutive month at 3.0%.
Turning to the labor market, the survey found that the average perceived likelihood of voluntary and involuntary job separations increased, while the perceived likelihood of finding a job (in the event of a job loss) declined. "The mean probability of leaving one’s job voluntarily in the next 12 months also increased, by 1.8 percentage points to 19.5%."

Mean unemployment expectations - or the mean probability that the U.S. unemployment rate will be higher one year from now - decreased by 1.1 percentage points to 36.1%, the lowest reading since February 2022. Additionally, the median one-year-ahead expected earnings growth was unchanged at 2.8%, remaining slightly below its 12-month trailing average of 2.9%.
Turning to household finance, we find the following:
- The median expected growth in household income remained unchanged at 3.1%. The series has been moving within a narrow range of 2.9% to 3.3% since January 2023, and remains above the February 2020 pre-pandemic level of 2.7%.
- Median household spending growth expectations increased by 0.2 percentage point to 5.2%. The increase was driven by respondents with a high school degree or less.
- Median year-ahead expected growth in government debt increased to 9.3% from 8.9%.
- The mean perceived probability that the average interest rate on saving accounts will be higher in 12 months increased by 0.6 percentage point to 26.1%, remaining below its 12-month trailing average of 30%.
- Perceptions about households’ current financial situations deteriorated somewhat with fewer respondents reporting being better off than a year ago. Year-ahead expectations also deteriorated marginally with a smaller share of respondents expecting to be better off and a slightly larger share of respondents expecting to be worse off a year from now.
- The mean perceived probability that U.S. stock prices will be higher 12 months from now increased by 1.4 percentage point to 38.9%.
- At the same time, perceptions and expectations about credit access turned less optimistic: "Perceptions of credit access compared to a year ago deteriorated with a larger share of respondents reporting tighter conditions and a smaller share reporting looser conditions compared to a year ago."

Also, a smaller percentage of consumers, 11.45% vs 12.14% in prior month, expect to not be able to make minimum debt payment over the next three months

Last, and perhaps most humorous, is the now traditional cognitive dissonance one observes with these polls, because at a time when long-term inflation expectations jumped, which clearly suggests that financial conditions will need to be tightened, the number of respondents expecting higher stock prices one year from today jumped to the highest since November 2021... which incidentally is just when the market topped out during the last cycle before suffering a painful bear market.

Uncategorized
Homes listed for sale in early June sell for $7,700 more
New Zillow research suggests the spring home shopping season may see a second wave this summer if mortgage rates fall
The post Homes listed for sale in…
Share this:


- A Zillow analysis of 2023 home sales finds homes listed in the first two weeks of June sold for 2.3% more.
- The best time to list a home for sale is a month later than it was in 2019, likely driven by mortgage rates.
- The best time to list can be as early as the second half of February in San Francisco, and as late as the first half of July in New York and Philadelphia.
Spring home sellers looking to maximize their sale price may want to wait it out and list their home for sale in the first half of June. A new Zillow® analysis of 2023 sales found that homes listed in the first two weeks of June sold for 2.3% more, a $7,700 boost on a typical U.S. home.
The best time to list consistently had been early May in the years leading up to the pandemic. The shift to June suggests mortgage rates are strongly influencing demand on top of the usual seasonality that brings buyers to the market in the spring. This home-shopping season is poised to follow a similar pattern as that in 2023, with the potential for a second wave if the Federal Reserve lowers interest rates midyear or later.
The 2.3% sale price premium registered last June followed the first spring in more than 15 years with mortgage rates over 6% on a 30-year fixed-rate loan. The high rates put home buyers on the back foot, and as rates continued upward through May, they were still reassessing and less likely to bid boldly. In June, however, rates pulled back a little from 6.79% to 6.67%, which likely presented an opportunity for determined buyers heading into summer. More buyers understood their market position and could afford to transact, boosting competition and sale prices.
The old logic was that sellers could earn a premium by listing in late spring, when search activity hit its peak. Now, with persistently low inventory, mortgage rate fluctuations make their own seasonality. First-time home buyers who are on the edge of qualifying for a home loan may dip in and out of the market, depending on what’s happening with rates. It is almost certain the Federal Reserve will push back any interest-rate cuts to mid-2024 at the earliest. If mortgage rates follow, that could bring another surge of buyers later this year.
Mortgage rates have been impacting affordability and sale prices since they began rising rapidly two years ago. In 2022, sellers nationwide saw the highest sale premium when they listed their home in late March, right before rates barreled past 5% and continued climbing.
Zillow’s research finds the best time to list can vary widely by metropolitan area. In 2023, it was as early as the second half of February in San Francisco, and as late as the first half of July in New York. Thirty of the top 35 largest metro areas saw for-sale listings command the highest sale prices between May and early July last year.
Zillow also found a wide range in the sale price premiums associated with homes listed during those peak periods. At the hottest time of the year in San Jose, homes sold for 5.5% more, a $88,000 boost on a typical home. Meanwhile, homes in San Antonio sold for 1.9% more during that same time period.
| Metropolitan Area | Best Time to List | Price Premium | Dollar Boost |
| United States | First half of June | 2.3% | $7,700 |
| New York, NY | First half of July | 2.4% | $15,500 |
| Los Angeles, CA | First half of May | 4.1% | $39,300 |
| Chicago, IL | First half of June | 2.8% | $8,800 |
| Dallas, TX | First half of June | 2.5% | $9,200 |
| Houston, TX | Second half of April | 2.0% | $6,200 |
| Washington, DC | Second half of June | 2.2% | $12,700 |
| Philadelphia, PA | First half of July | 2.4% | $8,200 |
| Miami, FL | First half of June | 2.3% | $12,900 |
| Atlanta, GA | Second half of June | 2.3% | $8,700 |
| Boston, MA | Second half of May | 3.5% | $23,600 |
| Phoenix, AZ | First half of June | 3.2% | $14,700 |
| San Francisco, CA | Second half of February | 4.2% | $50,300 |
| Riverside, CA | First half of May | 2.7% | $15,600 |
| Detroit, MI | First half of July | 3.3% | $7,900 |
| Seattle, WA | First half of June | 4.3% | $31,500 |
| Minneapolis, MN | Second half of May | 3.7% | $13,400 |
| San Diego, CA | Second half of April | 3.1% | $29,600 |
| Tampa, FL | Second half of June | 2.1% | $8,000 |
| Denver, CO | Second half of May | 2.9% | $16,900 |
| Baltimore, MD | First half of July | 2.2% | $8,200 |
| St. Louis, MO | First half of June | 2.9% | $7,000 |
| Orlando, FL | First half of June | 2.2% | $8,700 |
| Charlotte, NC | Second half of May | 3.0% | $11,000 |
| San Antonio, TX | First half of June | 1.9% | $5,400 |
| Portland, OR | Second half of April | 2.6% | $14,300 |
| Sacramento, CA | First half of June | 3.2% | $17,900 |
| Pittsburgh, PA | Second half of June | 2.3% | $4,700 |
| Cincinnati, OH | Second half of April | 2.7% | $7,500 |
| Austin, TX | Second half of May | 2.8% | $12,600 |
| Las Vegas, NV | First half of June | 3.4% | $14,600 |
| Kansas City, MO | Second half of May | 2.5% | $7,300 |
| Columbus, OH | Second half of June | 3.3% | $10,400 |
| Indianapolis, IN | First half of July | 3.0% | $8,100 |
| Cleveland, OH | First half of July | 3.4% | $7,400 |
| San Jose, CA | First half of June | 5.5% | $88,400 |
The post Homes listed for sale in early June sell for $7,700 more appeared first on Zillow Research.
federal reserve pandemic home sales mortgage rates interest ratesUncategorized
February Employment Situation
By Paul Gomme and Peter Rupert The establishment data from the BLS showed a 275,000 increase in payroll employment for February, outpacing the 230,000…
Share this:


By Paul Gomme and Peter Rupert
The establishment data from the BLS showed a 275,000 increase in payroll employment for February, outpacing the 230,000 average over the previous 12 months. The payroll data for January and December were revised down by a total of 167,000. The private sector added 223,000 new jobs, the largest gain since May of last year.

Temporary help services employment continues a steep decline after a sharp post-pandemic rise.


Average hours of work increased from 34.2 to 34.3. The increase, along with the 223,000 private employment increase led to a hefty increase in total hours of 5.6% at an annualized rate, also the largest increase since May of last year.

The establishment report, once again, beat “expectations;” the WSJ survey of economists was 198,000. Other than the downward revisions, mentioned above, another bit of negative news was a smallish increase in wage growth, from $34.52 to $34.57.

The household survey shows that the labor force increased 150,000, a drop in employment of 184,000 and an increase in the number of unemployed persons of 334,000. The labor force participation rate held steady at 62.5, the employment to population ratio decreased from 60.2 to 60.1 and the unemployment rate increased from 3.66 to 3.86. Remember that the unemployment rate is the number of unemployed relative to the labor force (the number employed plus the number unemployed). Consequently, the unemployment rate can go up if the number of unemployed rises holding fixed the labor force, or if the labor force shrinks holding the number unemployed unchanged. An increase in the unemployment rate is not necessarily a bad thing: it may reflect a strong labor market drawing “marginally attached” individuals from outside the labor force. Indeed, there was a 96,000 decline in those workers.


Earlier in the week, the BLS announced JOLTS (Job Openings and Labor Turnover Survey) data for January. There isn’t much to report here as the job openings changed little at 8.9 million, the number of hires and total separations were little changed at 5.7 million and 5.3 million, respectively.

As has been the case for the last couple of years, the number of job openings remains higher than the number of unemployed persons.

Also earlier in the week the BLS announced that productivity increased 3.2% in the 4th quarter with output rising 3.5% and hours of work rising 0.3%.

The bottom line is that the labor market continues its surprisingly (to some) strong performance, once again proving stronger than many had expected. This strength makes it difficult to justify any interest rate cuts soon, particularly given the recent inflation spike.
unemployment pandemic unemployment


-

 Uncategorized3 weeks ago
All Of The Elements Are In Place For An Economic Crisis Of Staggering Proportions
-

 Uncategorized1 month ago
Cathie Wood sells a major tech stock (again)
-

 Uncategorized3 weeks ago
California Counties Could Be Forced To Pay $300 Million To Cover COVID-Era Program
-

 Uncategorized2 weeks ago
Apparel Retailer Express Moving Toward Bankruptcy
-

 Uncategorized4 weeks ago
Industrial Production Decreased 0.1% in January
-

 International3 days ago
EyePoint poaches medical chief from Apellis; Sandoz CFO, longtime BioNTech exec to retire
-

 International3 days ago
Walmart launches clever answer to Target’s new membership program
-

 Uncategorized3 weeks ago
RFK Jr: The Wuhan Cover-Up & The Rise Of The Biowarfare-Industrial Complex