Uncategorized
The Real Story Is Real Yields
The Real Story Is Real Yields
By Peter Tchir of Academy Securities
While we are engaged in discussions on “sticky” inflation and long/variable…
Share this:


By Peter Tchir of Academy Securities
While we are engaged in discussions on “sticky” inflation and long/variable lags, etc., the “real” story is likely real yields.
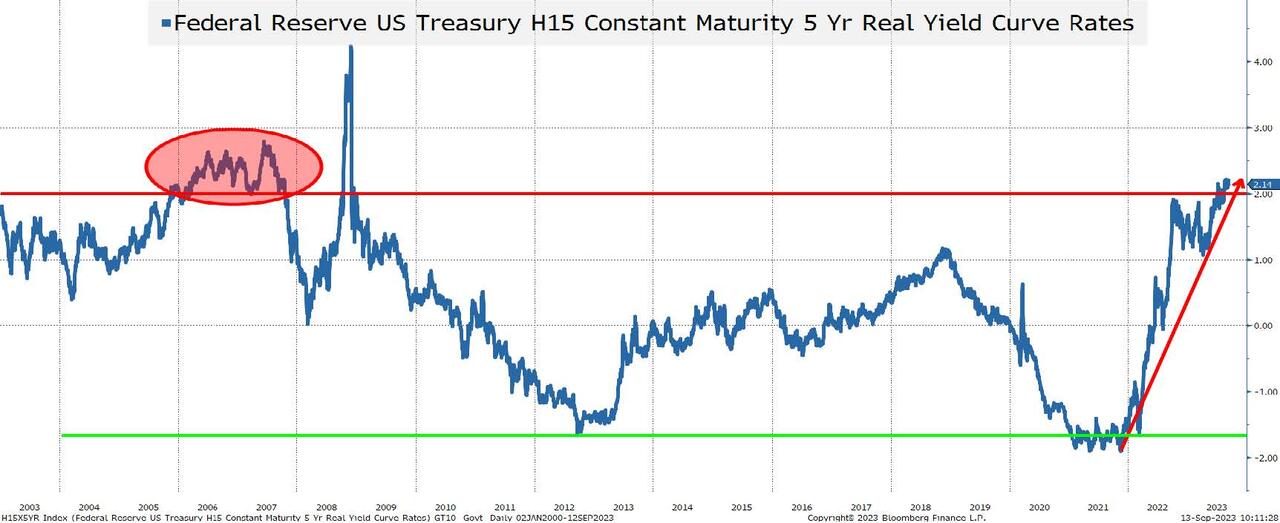
For reference, I’ve used the Federal Reserve Real Yields. There are various other “real yield” calculations out there, but they all tell similar stories. I chose the 5-year partly because it was the most dramatic (with inverted yield curves, the 10-year real yield is lower), and also because 5 years seems like a reasonable timeframe to think about.
The last time the 5-year real yield was above 2% for an extended period of time was in 2006 and early 2007. We all know what happened after that.
While a 2% real yield is great for savers, it may place an increasingly difficult burden on borrowers and growth. New projects need to meet a considerably higher hurdle rate to warrant funding those projects.
Inflation Expectations Seem “Reasonable”
I don’t like to think about real yields “in isolation.” We already know nominal yields are between 4.25% and 5% depending on where you are on the curve. But I want to keep an eye on inflation expectations (mainly because the Fed pays attention to this data).
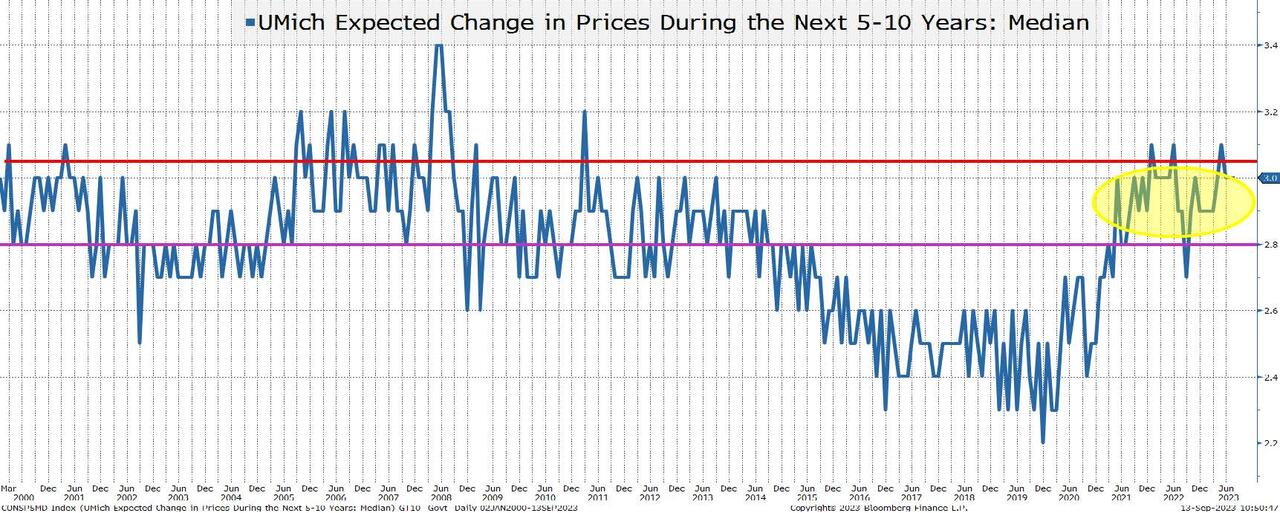
The average for this metric is 2.8%. Yes, we are at 3%, but that is barely above the average. In almost 25 years, this measure has NEVER hit 2%.
We can debate until we are blue in the face about whether 2% is a realistic target or not. Powell says that it is their target, but I suspect that anything sub 3% on inflation allows him to be “patient” on hiking.
In any case, high real yields are becoming a potential issue for the economy and that is not being accompanied by a big shift in future inflation expectations.
5-Year, 5-Year Forward Breakeven Yield
Let’s be honest, I only use this because saying anything as complicated as “5-year, 5-year forward breakeven yield” must make me sound smart. If I think really hard about it, I can understand what it actually means, and I know that others (including the Fed) are keeping an eye on this.
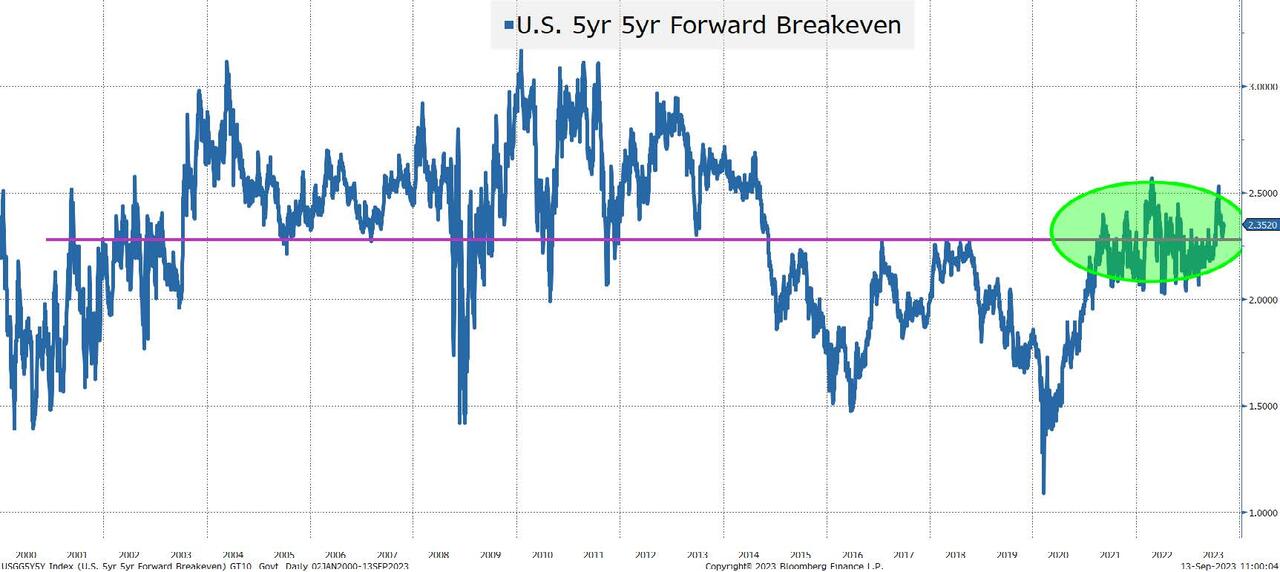
We are hovering right around the long-term average, which seems like a decent place to be. We’ve been bouncing around this level for months now. I’m not exactly sure about the significance of this (it is low on my “radar” screen) and it doesn’t seem to be setting off any alarm bells about inflation, rates, or the shape of the curve.
From my perspective, this fits my current view of the Fed quite well:
- High hurdle to hike.
- Incredibly high hurdle to cut.
But I’m digressing from the real yield discussion and the potential impact on the economy.
Borrowing Costs
We all know that credit spreads have done well (at least for investment grade and high yield bonds). This is less so for leveraged loans, but even there we see a decent bid and if we get a short squeeze rally in credit, it will start with the lev loan/CLO market.
But what about smaller issuers or those who we don’t see every day (or possibly ever)? We already have a stock market that focuses on the “Magnificent Seven,” but have we thought enough about what is occurring as you move to smaller companies, especially on the borrowing side?
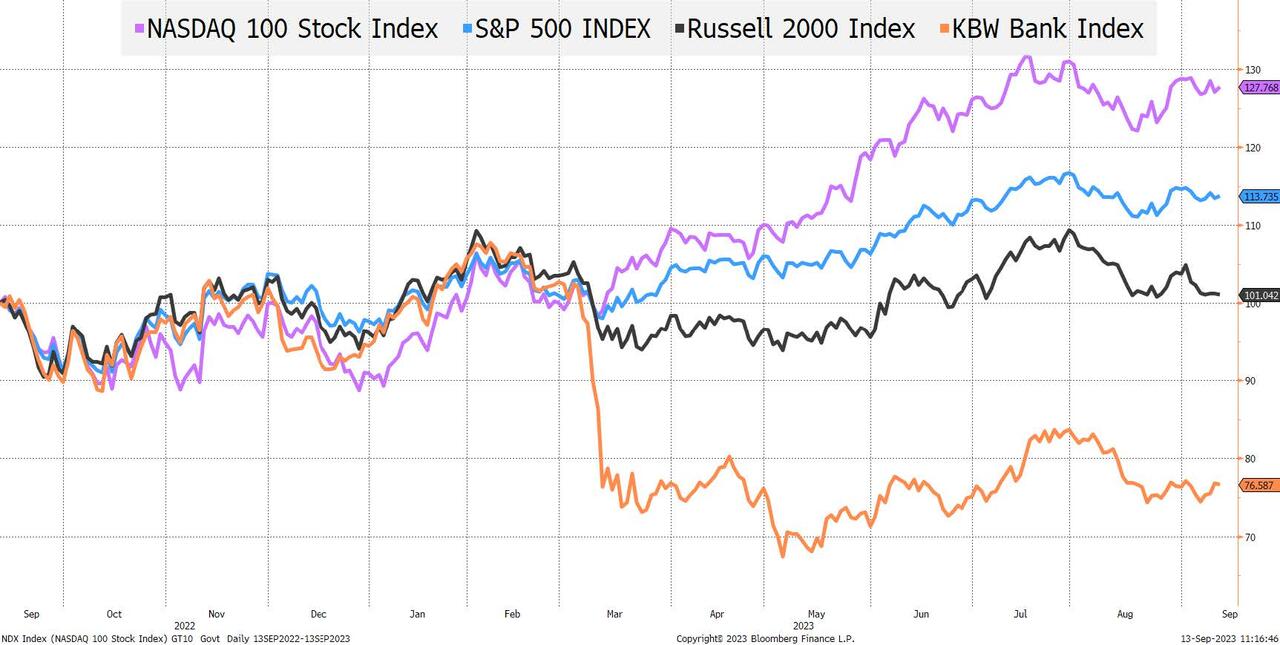
We’ve discussed these relative performance charts multiple times this year, but now I want to think about them from a different angle. What do we think is happening to companies smaller than those included in the Russell 2000 (i.e., small private companies)?
The two relevant indices are:
- The Russell 2000. Basically, flat this year, but underperforming the Nasdaq 100 by 27% and the S&P 500 by 12%. How much would even smaller companies be underperforming by? If the Russell 2000 companies can only break even, what does it say about the state of smaller companies as a whole? I presume nothing good.
- The KBW Bank Index is also important as it reflects the performance of banks, which are in turn the preferred supplier of credit for smaller companies. While large companies rely on banks, it is more often than not for revolvers that are unlikely to be drawn. For smaller companies, bank loans are a primary source of borrowing. How do they get those loans when the banks themselves are under pressure? Bank deposits are back to declining (and are shifting from smaller banks into larger banks).
I don’t know what the borrowing opportunities are for smaller companies, but I suspect that they aren’t great given the data that we have and where it seems to be pointing. One counterargument I’ve heard is that the Russell 2000 has many banks and that is part of the underperformance, but that doesn’t explain the “Magnificent Seven” and the divergences between equal weighted and market cap weighted indices.
Small Businesses
Academy’s client base is predominantly large corporations. It is great that these companies are chugging along (I’m currently bullish stocks and credit spreads). Having said that, it is best when the economy is firing on all cylinders!
In this report we started with facts (real yields are historically high), but we have waded into conjecture (small companies are under pressure).
My friend, Joe Brusuelas, who I think has a great take on the small and mid-sized company economy, published this Commentary in Barron’s. In this report he points out that according to their survey of “middle market businesses,” about 35% of them are going to the shadow market and getting rates averaging 13.7%.
IG yields are around 5.75% and HY yields are around 8.5%. 13.7% seems to be in the realm of CCC borrowers.
I take this seriously, partly because it is important to the economy, but also because it tends to be important to politicians.
One thing that the troubles surrounding Silicon Valley Bank (for example) showed me is how connected politicians are to their local banks and businesses. We saw lots of politicians discuss the messages that they were getting from the banks in their districts. While the Fed learned from the GFC to act early and aggressively and to never let problems spread within the banking system, the level of political support helped them act as well.
So, when I start hearing that those most connected to small businesses are advocating for a pause, I suspect that there is a big and powerful movement behind it.
Basically, new to my list, is the likelihood that there is a powerful lobby in the works to send a clear message to D.C. that the rate hikes are hurting these small businesses. While the Fed is apolitical, the arguments seem economic which should sway the Fed. From a market standpoint, if politicians and the media start focusing on some of this risk, I think that we will price in fewer hikes, which should help yields and the broader market.
CRE Too
One client in particular has argued profusely (and I completely agree with them) that the Fed pays extreme attention to CRE. The argument is that the Fed can ignore problems in the high yield market because it is a niche market. As big as it is, it is understood to be risky and is small relative to U.S. GDP.
Regarding IG, they can tolerate larger moves in spreads because these companies are good and have a lot of runway and the ability to manage any spread widening. In addition, similar to COVID, if it gets bad enough the government will intervene, but they don’t need to worry unless the spread widening and dislocations become severe.
CRE is a different animal. It is a simply massive market. It is also generally viewed as safe (one condition that I watch closely for contagion or bubble risk) and in many cases, the loans are held in the banking system (another thing that I watch closely for contagion risk).
While CRE will not be “bailed out” by the Fed or D.C., they have absolutely zero incentive to push it over the edge. We’ve made it this far in the fight with inflation and haven’t toppled CRE (most indices have bounced significantly since their late April lows, but are far from the highs before the Fed started hiking into a WFH environment).
It would seem prudent for the Fed to give this sector an opportunity to work itself out, i.e., to refinance, restructure, and to take losses where needed (but not push it too far).
Bottom Line
While a lot of the data we get may point to inflation (and I continue to expect economic data to show slowing), there is a lot more for the Fed to worry about behind the scenes. CRE might seem obvious, but a lot is private and not marked to market, so the Fed has to feel its way around. Small businesses (and their borrowing) are another example of an area where we don’t get a report the first Friday of every month, but it is potentially equally important to the Fed.
If anything, I’m tempted to change my view on the Fed to one where it takes an incredibly high hurdle to hike or to cut.
Somehow, I started with “real yields” and wound up with “middle market businesses and commercial real estate,” but it is all part of the same story and one that the Fed needs to watch closely.
Uncategorized
NY Fed Finds Medium, Long-Term Inflation Expectations Jump Amid Surge In Stock Market Optimism
NY Fed Finds Medium, Long-Term Inflation Expectations Jump Amid Surge In Stock Market Optimism
One month after the inflation outlook tracked…
Share this:


One month after the inflation outlook tracked by the NY Fed Consumer Survey extended their late 2023 slide, with 3Y inflation expectations in January sliding to a record low 2.4% (from 2.6% in December), even as 1 and 5Y inflation forecasts remained flat, moments ago the NY Fed reported that in February there was a sharp rebound in longer-term inflation expectations, rising to 2.7% from 2.4% at the three-year ahead horizon, and jumping to 2.9% from 2.5% at the five-year ahead horizon, while the 1Y inflation outlook was flat for the 3rd month in a row, stuck at 3.0%.
The increases in both the three-year ahead and five-year ahead measures were most pronounced for respondents with at most high school degrees (in other words, the "really smart folks" are expecting deflation soon). The survey’s measure of disagreement across respondents (the difference between the 75th and 25th percentile of inflation expectations) decreased at all horizons, while the median inflation uncertainty—or the uncertainty expressed regarding future inflation outcomes—declined at the one- and three-year ahead horizons and remained unchanged at the five-year ahead horizon.
Going down the survey, we find that the median year-ahead expected price changes increased by 0.1 percentage point to 4.3% for gas; decreased by 1.8 percentage points to 6.8% for the cost of medical care (its lowest reading since September 2020); decreased by 0.1 percentage point to 5.8% for the cost of a college education; and surprisingly decreased by 0.3 percentage point for rent to 6.1% (its lowest reading since December 2020), and remained flat for food at 4.9%.

We find the rent expectations surprising because it is happening just asking rents are rising across the country.

At the same time as consumers erroneously saw sharply lower rents, median home price growth expectations remained unchanged for the fifth consecutive month at 3.0%.
Turning to the labor market, the survey found that the average perceived likelihood of voluntary and involuntary job separations increased, while the perceived likelihood of finding a job (in the event of a job loss) declined. "The mean probability of leaving one’s job voluntarily in the next 12 months also increased, by 1.8 percentage points to 19.5%."

Mean unemployment expectations - or the mean probability that the U.S. unemployment rate will be higher one year from now - decreased by 1.1 percentage points to 36.1%, the lowest reading since February 2022. Additionally, the median one-year-ahead expected earnings growth was unchanged at 2.8%, remaining slightly below its 12-month trailing average of 2.9%.
Turning to household finance, we find the following:
- The median expected growth in household income remained unchanged at 3.1%. The series has been moving within a narrow range of 2.9% to 3.3% since January 2023, and remains above the February 2020 pre-pandemic level of 2.7%.
- Median household spending growth expectations increased by 0.2 percentage point to 5.2%. The increase was driven by respondents with a high school degree or less.
- Median year-ahead expected growth in government debt increased to 9.3% from 8.9%.
- The mean perceived probability that the average interest rate on saving accounts will be higher in 12 months increased by 0.6 percentage point to 26.1%, remaining below its 12-month trailing average of 30%.
- Perceptions about households’ current financial situations deteriorated somewhat with fewer respondents reporting being better off than a year ago. Year-ahead expectations also deteriorated marginally with a smaller share of respondents expecting to be better off and a slightly larger share of respondents expecting to be worse off a year from now.
- The mean perceived probability that U.S. stock prices will be higher 12 months from now increased by 1.4 percentage point to 38.9%.
- At the same time, perceptions and expectations about credit access turned less optimistic: "Perceptions of credit access compared to a year ago deteriorated with a larger share of respondents reporting tighter conditions and a smaller share reporting looser conditions compared to a year ago."

Also, a smaller percentage of consumers, 11.45% vs 12.14% in prior month, expect to not be able to make minimum debt payment over the next three months

Last, and perhaps most humorous, is the now traditional cognitive dissonance one observes with these polls, because at a time when long-term inflation expectations jumped, which clearly suggests that financial conditions will need to be tightened, the number of respondents expecting higher stock prices one year from today jumped to the highest since November 2021... which incidentally is just when the market topped out during the last cycle before suffering a painful bear market.

Uncategorized
Homes listed for sale in early June sell for $7,700 more
New Zillow research suggests the spring home shopping season may see a second wave this summer if mortgage rates fall
The post Homes listed for sale in…
Share this:


- A Zillow analysis of 2023 home sales finds homes listed in the first two weeks of June sold for 2.3% more.
- The best time to list a home for sale is a month later than it was in 2019, likely driven by mortgage rates.
- The best time to list can be as early as the second half of February in San Francisco, and as late as the first half of July in New York and Philadelphia.
Spring home sellers looking to maximize their sale price may want to wait it out and list their home for sale in the first half of June. A new Zillow® analysis of 2023 sales found that homes listed in the first two weeks of June sold for 2.3% more, a $7,700 boost on a typical U.S. home.
The best time to list consistently had been early May in the years leading up to the pandemic. The shift to June suggests mortgage rates are strongly influencing demand on top of the usual seasonality that brings buyers to the market in the spring. This home-shopping season is poised to follow a similar pattern as that in 2023, with the potential for a second wave if the Federal Reserve lowers interest rates midyear or later.
The 2.3% sale price premium registered last June followed the first spring in more than 15 years with mortgage rates over 6% on a 30-year fixed-rate loan. The high rates put home buyers on the back foot, and as rates continued upward through May, they were still reassessing and less likely to bid boldly. In June, however, rates pulled back a little from 6.79% to 6.67%, which likely presented an opportunity for determined buyers heading into summer. More buyers understood their market position and could afford to transact, boosting competition and sale prices.
The old logic was that sellers could earn a premium by listing in late spring, when search activity hit its peak. Now, with persistently low inventory, mortgage rate fluctuations make their own seasonality. First-time home buyers who are on the edge of qualifying for a home loan may dip in and out of the market, depending on what’s happening with rates. It is almost certain the Federal Reserve will push back any interest-rate cuts to mid-2024 at the earliest. If mortgage rates follow, that could bring another surge of buyers later this year.
Mortgage rates have been impacting affordability and sale prices since they began rising rapidly two years ago. In 2022, sellers nationwide saw the highest sale premium when they listed their home in late March, right before rates barreled past 5% and continued climbing.
Zillow’s research finds the best time to list can vary widely by metropolitan area. In 2023, it was as early as the second half of February in San Francisco, and as late as the first half of July in New York. Thirty of the top 35 largest metro areas saw for-sale listings command the highest sale prices between May and early July last year.
Zillow also found a wide range in the sale price premiums associated with homes listed during those peak periods. At the hottest time of the year in San Jose, homes sold for 5.5% more, a $88,000 boost on a typical home. Meanwhile, homes in San Antonio sold for 1.9% more during that same time period.
| Metropolitan Area | Best Time to List | Price Premium | Dollar Boost |
| United States | First half of June | 2.3% | $7,700 |
| New York, NY | First half of July | 2.4% | $15,500 |
| Los Angeles, CA | First half of May | 4.1% | $39,300 |
| Chicago, IL | First half of June | 2.8% | $8,800 |
| Dallas, TX | First half of June | 2.5% | $9,200 |
| Houston, TX | Second half of April | 2.0% | $6,200 |
| Washington, DC | Second half of June | 2.2% | $12,700 |
| Philadelphia, PA | First half of July | 2.4% | $8,200 |
| Miami, FL | First half of June | 2.3% | $12,900 |
| Atlanta, GA | Second half of June | 2.3% | $8,700 |
| Boston, MA | Second half of May | 3.5% | $23,600 |
| Phoenix, AZ | First half of June | 3.2% | $14,700 |
| San Francisco, CA | Second half of February | 4.2% | $50,300 |
| Riverside, CA | First half of May | 2.7% | $15,600 |
| Detroit, MI | First half of July | 3.3% | $7,900 |
| Seattle, WA | First half of June | 4.3% | $31,500 |
| Minneapolis, MN | Second half of May | 3.7% | $13,400 |
| San Diego, CA | Second half of April | 3.1% | $29,600 |
| Tampa, FL | Second half of June | 2.1% | $8,000 |
| Denver, CO | Second half of May | 2.9% | $16,900 |
| Baltimore, MD | First half of July | 2.2% | $8,200 |
| St. Louis, MO | First half of June | 2.9% | $7,000 |
| Orlando, FL | First half of June | 2.2% | $8,700 |
| Charlotte, NC | Second half of May | 3.0% | $11,000 |
| San Antonio, TX | First half of June | 1.9% | $5,400 |
| Portland, OR | Second half of April | 2.6% | $14,300 |
| Sacramento, CA | First half of June | 3.2% | $17,900 |
| Pittsburgh, PA | Second half of June | 2.3% | $4,700 |
| Cincinnati, OH | Second half of April | 2.7% | $7,500 |
| Austin, TX | Second half of May | 2.8% | $12,600 |
| Las Vegas, NV | First half of June | 3.4% | $14,600 |
| Kansas City, MO | Second half of May | 2.5% | $7,300 |
| Columbus, OH | Second half of June | 3.3% | $10,400 |
| Indianapolis, IN | First half of July | 3.0% | $8,100 |
| Cleveland, OH | First half of July | 3.4% | $7,400 |
| San Jose, CA | First half of June | 5.5% | $88,400 |
The post Homes listed for sale in early June sell for $7,700 more appeared first on Zillow Research.
federal reserve pandemic home sales mortgage rates interest ratesUncategorized
February Employment Situation
By Paul Gomme and Peter Rupert The establishment data from the BLS showed a 275,000 increase in payroll employment for February, outpacing the 230,000…
Share this:


By Paul Gomme and Peter Rupert
The establishment data from the BLS showed a 275,000 increase in payroll employment for February, outpacing the 230,000 average over the previous 12 months. The payroll data for January and December were revised down by a total of 167,000. The private sector added 223,000 new jobs, the largest gain since May of last year.

Temporary help services employment continues a steep decline after a sharp post-pandemic rise.


Average hours of work increased from 34.2 to 34.3. The increase, along with the 223,000 private employment increase led to a hefty increase in total hours of 5.6% at an annualized rate, also the largest increase since May of last year.

The establishment report, once again, beat “expectations;” the WSJ survey of economists was 198,000. Other than the downward revisions, mentioned above, another bit of negative news was a smallish increase in wage growth, from $34.52 to $34.57.

The household survey shows that the labor force increased 150,000, a drop in employment of 184,000 and an increase in the number of unemployed persons of 334,000. The labor force participation rate held steady at 62.5, the employment to population ratio decreased from 60.2 to 60.1 and the unemployment rate increased from 3.66 to 3.86. Remember that the unemployment rate is the number of unemployed relative to the labor force (the number employed plus the number unemployed). Consequently, the unemployment rate can go up if the number of unemployed rises holding fixed the labor force, or if the labor force shrinks holding the number unemployed unchanged. An increase in the unemployment rate is not necessarily a bad thing: it may reflect a strong labor market drawing “marginally attached” individuals from outside the labor force. Indeed, there was a 96,000 decline in those workers.


Earlier in the week, the BLS announced JOLTS (Job Openings and Labor Turnover Survey) data for January. There isn’t much to report here as the job openings changed little at 8.9 million, the number of hires and total separations were little changed at 5.7 million and 5.3 million, respectively.

As has been the case for the last couple of years, the number of job openings remains higher than the number of unemployed persons.

Also earlier in the week the BLS announced that productivity increased 3.2% in the 4th quarter with output rising 3.5% and hours of work rising 0.3%.

The bottom line is that the labor market continues its surprisingly (to some) strong performance, once again proving stronger than many had expected. This strength makes it difficult to justify any interest rate cuts soon, particularly given the recent inflation spike.
unemployment pandemic unemployment


-

 Uncategorized3 weeks ago
All Of The Elements Are In Place For An Economic Crisis Of Staggering Proportions
-

 Uncategorized1 month ago
Cathie Wood sells a major tech stock (again)
-

 Uncategorized3 weeks ago
California Counties Could Be Forced To Pay $300 Million To Cover COVID-Era Program
-

 Uncategorized2 weeks ago
Apparel Retailer Express Moving Toward Bankruptcy
-

 International3 days ago
EyePoint poaches medical chief from Apellis; Sandoz CFO, longtime BioNTech exec to retire
-

 Uncategorized4 weeks ago
Industrial Production Decreased 0.1% in January
-

 International3 days ago
Walmart launches clever answer to Target’s new membership program
-

 Uncategorized3 weeks ago
RFK Jr: The Wuhan Cover-Up & The Rise Of The Biowarfare-Industrial Complex