Uncategorized
The Fed’s Big Problem, There Are Two Economies But Only One Interest Rate
The Fed’s Big Problem, There Are Two Economies But Only One Interest Rate
Authored by Mike Shedlock via MishTalk.com,
On average, the economy…
Share this:

Authored by Mike Shedlock via MishTalk.com,
On average, the economy looks OK. But averages are misleading. Several large groups of people are struggling. They all have one thing in common.
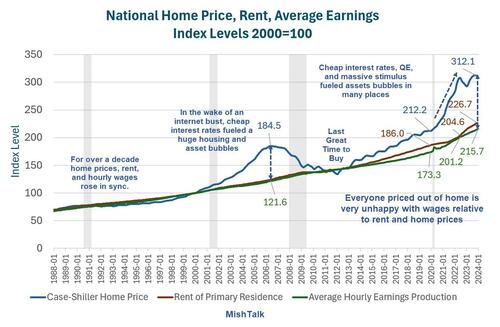
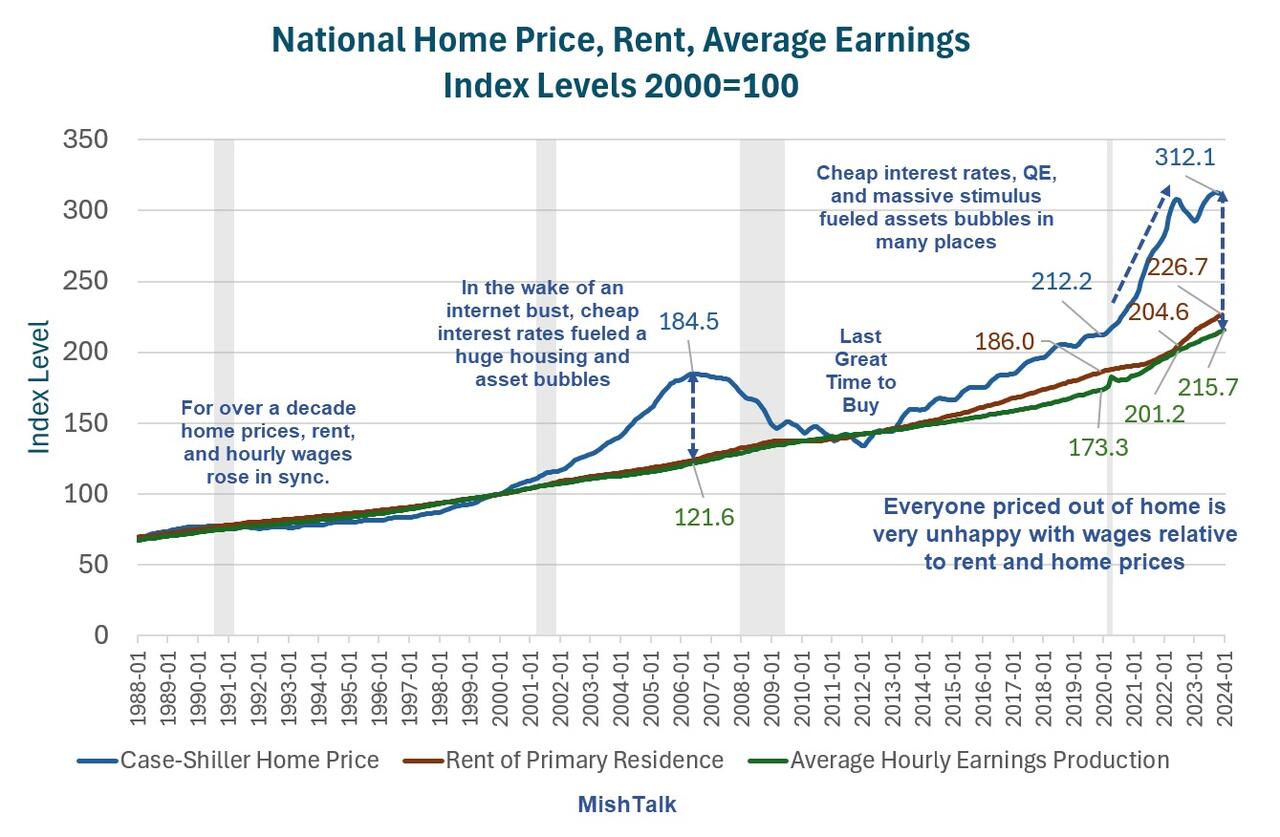
Case-Shiller home price index, CPI rent index, and the index of hourly earnings for production and nonsupervisory workers.
Who’s Unhappy?
Those looking to buy a home but cannot afford the record high prices, are not faring well in this economy.
The last great time to buy a home was in 2012. Over the next eight years, home prices moved further and further away from wages.
When the Covid pandemic hit in 2020, we had record QE, record fiscal stimulus, mortgage rates hit record lows, and inflation hit the highest levels in 40 years.
In response, home prices soared out of sight. Worse yet, the price of rent rose at least 0.4 percent for 28 straight months.
Rent of Primary Residence vs OER
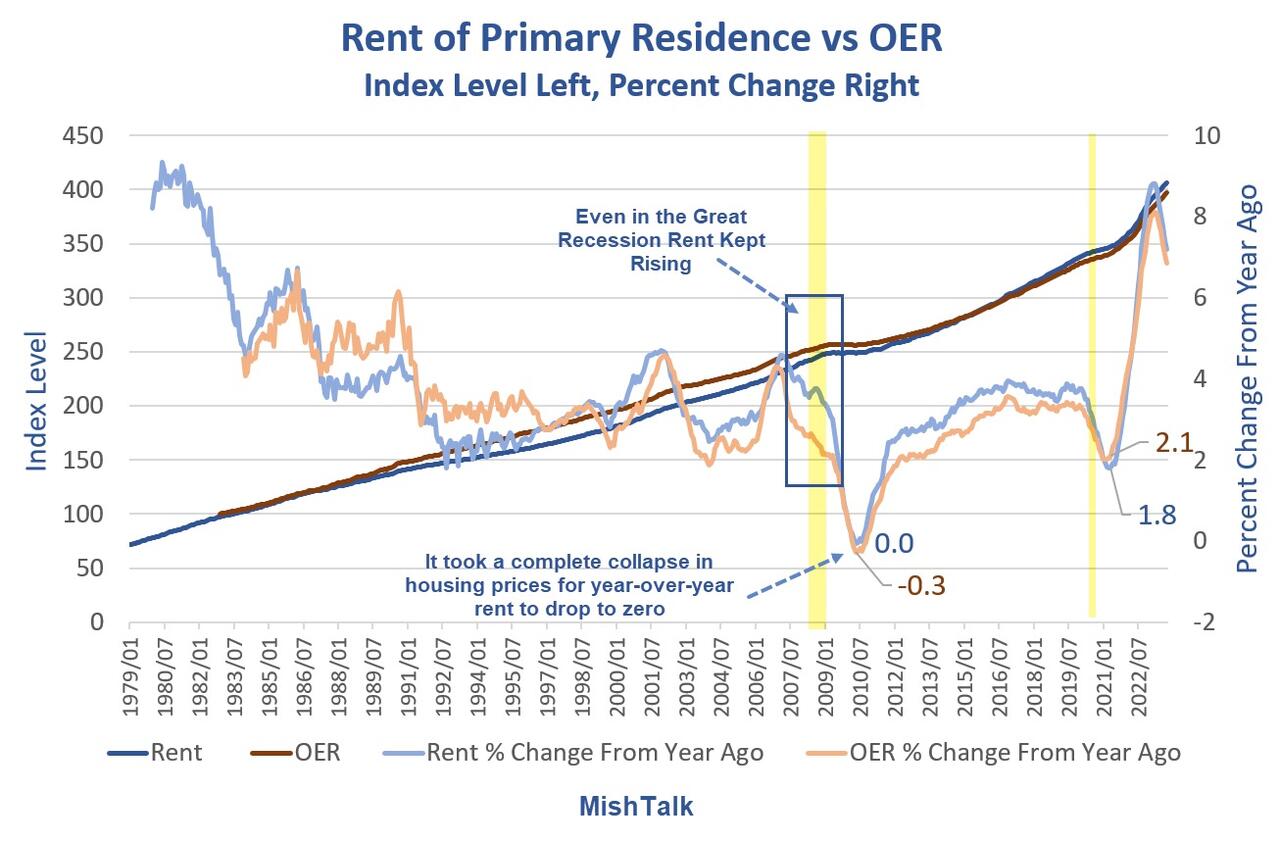
Data from the BLS, chart by Mish
Rent vs OER Chart Notes
-
OER stands for Owners’ Equivalent Rent. It is the price one would pay to rent their own house, unfurnished without rent.
-
Rent of primary residence is just what one would expect. It is measured price of rent, unfurnished, without utilities.
Mass Confusion Over OER
Contrary to widespread myth, OER is a measured price with very minor imputations that do not matter. OER is designed to track rent prices and it does. It is a measured price.
Much of the confusion comes from a misquoted BLS statement on OER, emphasis mine.
The expenditure weight in the CPI market basket for OER is based on the following question that the Consumer Expenditure Survey asks of consumers who own their primary residence: “If someone were to rent your home today, how much do you think it would rent for monthly, unfurnished and without utilities?”
Note that these responses are not used in estimating price change for the shelter categories, only the weight.
People quote that question as if that is how the BLS measures prices. It doesn’t. Prices, except for minor, irrelevant imputations, are based on actual measured rents.
No One Pays OER
The problem with OER is the weight not the measure. No one actually pays OER. Rather, people pay mortgages.
Yet, OER it is the single largest component of the CPI with a weight of 26.769 percent. Rent has a weight of 7.671 percent.
Many people conclude that the CPI is overstated because no one pays OER. The problem with this idea is home prices are at record highs and home prices are not in the CPI at all.
Homes are not in the CPI because economists consider them a capital expense not a personal expense.
But so what? Inflation matters not just consumer inflation. The Fed has made a big mess of things by ignoring obvious housing bubbles.
30-year mortgage Rates
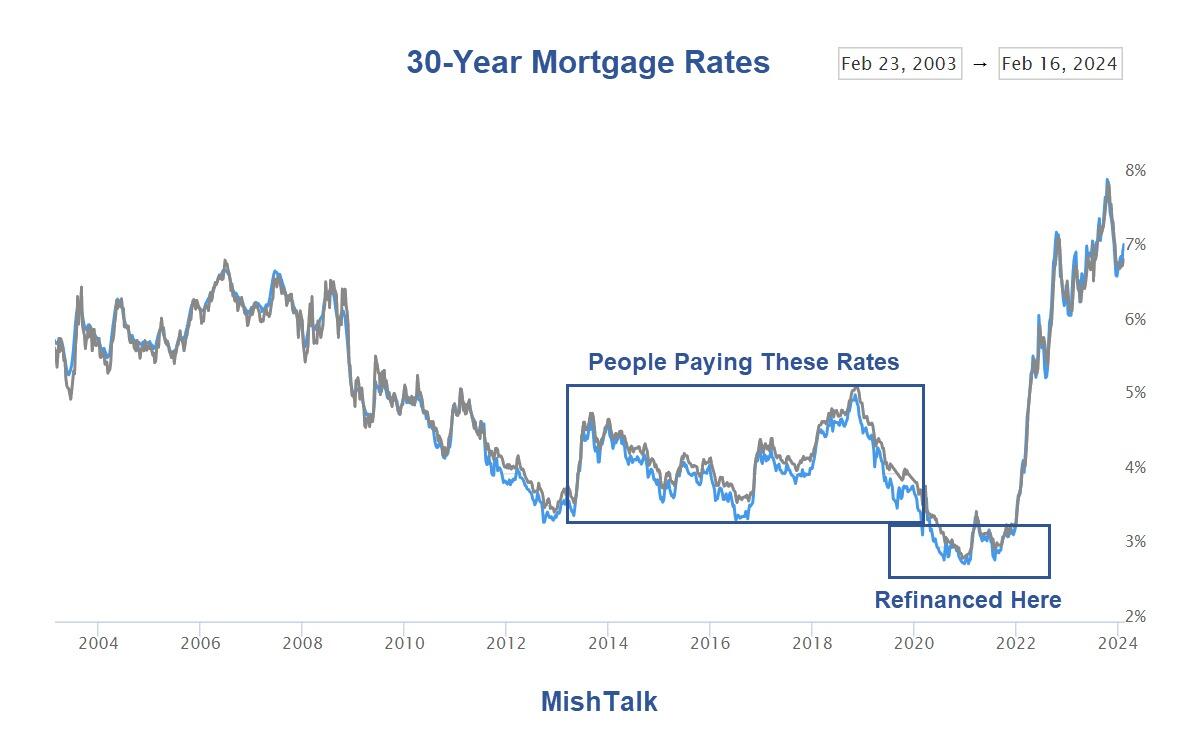
Mortgage rates courtesy of Mortgage News Daily, annotations by Mish
When the Fed slashed interest rates to zero, mortgage rates fell below 3.0% for an extended period allowing everyone to refinance at 3.0 percent or below. Most did.
OER rose from 332 to 403 between January of 2020 and January of 2024. That’s a gain of 21.4 percent.
Rent rose from 338 to 412. That’s a gain of 21.9 percent.
Whereas the renter is struggling, the homeowner refinanced lower putting extra money in his pocket every month.
Home owners also benefitted from rising wages, rising value of their home and a stable, not rising mortgage payment.
Winners and Losers
-
The homeowners are generally doing OK. The home ownership rate is 65.7 percent.
-
The 34.3 percent who rent are generally not doing OK.
The study did not break things down by home owners vs renters, but I suspect most of the use is by renters.
According to the latest CPI report, rent was up at least 0.4 percent for the 29th straight month. Shelter, a broader category, rose 0.6 percent. Food rose 0.4 percent.
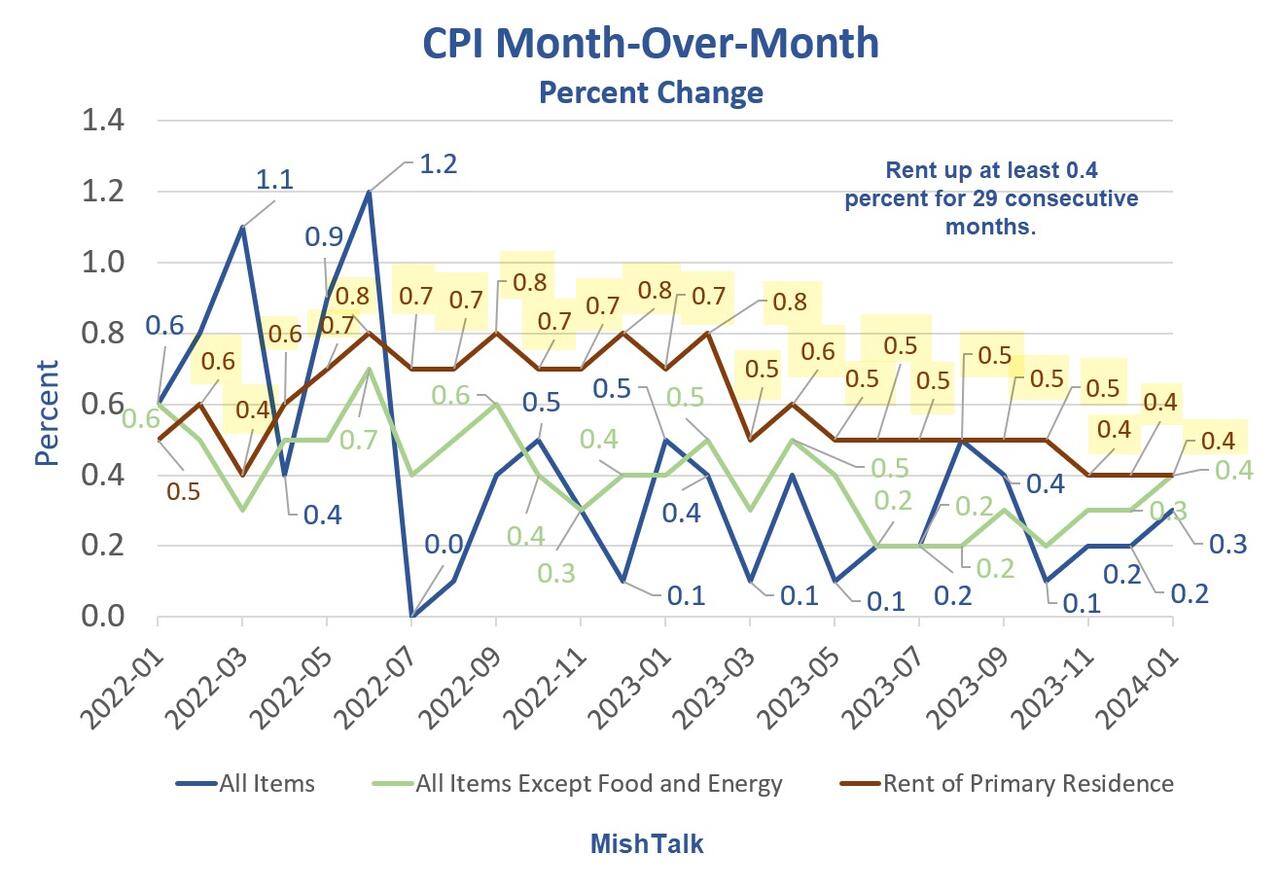
CPI data from the BLS, chart by Mish
Whereas home owners have a fixed payment, likely refinanced lower than their initial mortgage, renters faces huge increases, not every month, but once a year, big bang.
For discussion please see Another Hotter Than Expected CPI Led by Shelter, Up Another 0.6 Percent
The stress is easy to spot by demographics.
Credit Card and Auto Delinquencies Soar
![]()
Credit card debt surged to a record high in the fourth quarter. Even more troubling is a steep climb in 90 day or longer delinquencies.
Record High Credit Card Debt
Credit card debt rose to a new record high of $1.13 trillion, up $50 billion in the quarter. Even more troubling is the surge in serious delinquencies, defined as 90 days or more past due.
For nearly all age groups, serious delinquencies are the highest since 2011 at best.
Auto Loan Delinquencies
![]()
Serious delinquencies on auto loans have jumped from under 3 percent in mid-2021 to to 5 percent at the end of 2023 for age group 18-29.
Age group 30-39 is also troubling. Serious delinquencies for age groups 18-29 and 30-39 are at the highest levels since 2010.
For further discussion please see Credit Card and Auto Delinquencies Soar, Especially Age Group 18 to 39
Generational Homeownership Rates
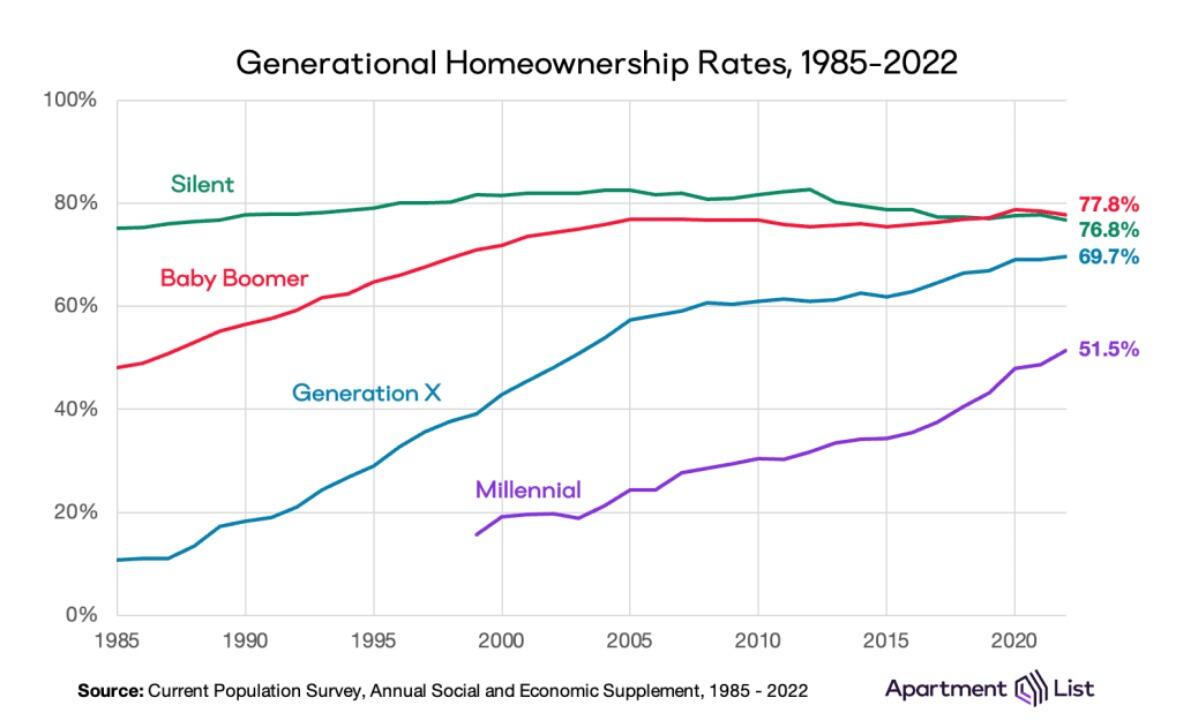
Home ownership rates courtesy of Apartment List
The above chart is from the Apartment List’s 2023 Millennial Homeownership Report
Those struggling with rent are more likely to Millennials and Zoomers than Generation X, Baby Boomers, or members of the Silent Generation.
The same age groups struggling with credit card and auto delinquencies.
On Average Everything is Great
Average it up as Fed and all the clueless economic and political writers do, and things look great.
This is why we have seen countless stories attempting to explain why people should be happy.
Krugman Blames Partisanship
With the recent rise in consumer sentiment, time to revisit this excellent Briefing Book paper. On reflection, I'd do it a bit differently; same basic conclusion, but I think partisan asymmetry explains even more of the remaining low numbers 1/ https://t.co/4lqm7X4472
— Paul Krugman (@paulkrugman) February 17, 2024
OK, there is a fair amount of partisanship in the polls.
However, Biden isn’t struggling from partisanship alone. If that was the reason, Biden would not be polling so miserably with Democrats in general, blacks, and younger voters.
In addition to Biden’s Age and Senility, this allegedly booming economy left behind the renters and everyone under the age of 40 struggling to make ends meet.
Powell Pleads Patience
In Jerome Powell’s Interview with 60 Minutes, the Fed Chairman Tells 60 Minutes US Fiscal Path is Unsustainable
Powell: When high inflation really threatens to become persistent, we use our tools to bring down inflation. It’s very important for that young couple — and particularly for younger couples starting out who may not have great financial means, that we succeed in this effort.
60 Minutes: You’re asking the American people for patience?
Powell: Yes. And I think people have been patient and have been through a pretty difficult time. And I think now we’re coming through that time and starting to feel a little bit better about things.
Powell, Krugman, and most of the economic writers, even at the Wall Street Journal have not managed to figure out over a third of the nation is struggling.
Many Are Addicted to “Buy Now, Pay Later” Plans
Buy Now Pay Later, BNPL, plans are increasingly popular. It’s another sign of consumer credit stress.
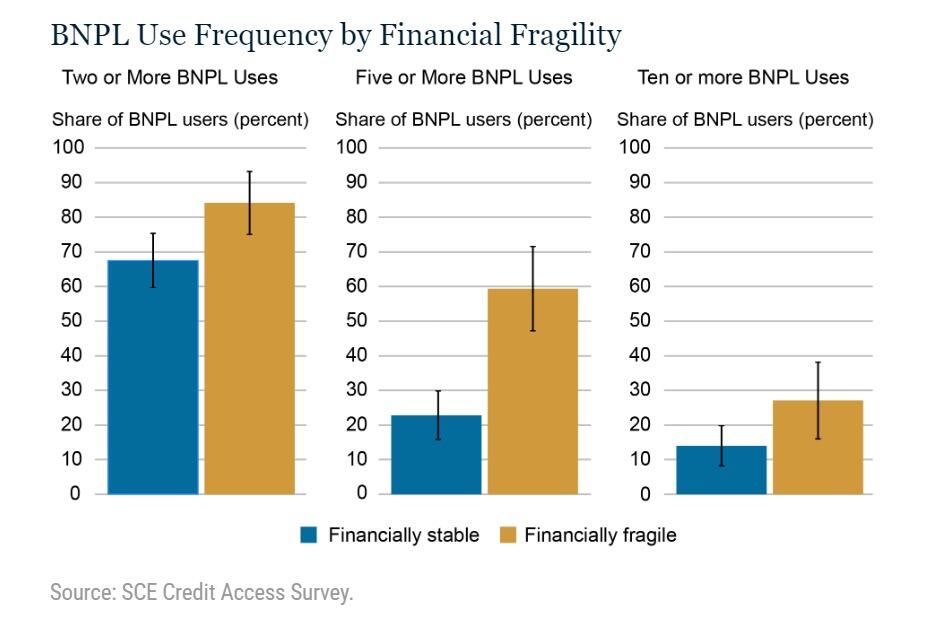
For discussion, please see Many Are Addicted to “Buy Now, Pay Later” Plans, It’s a Big Trap
The study did not break things down by home owners vs renters, but I strongly suspect most of the BNPL use is by renters.
What About Jobs?
Jobs Soar but Full Time Employment Is Barely Changed Since May 2022
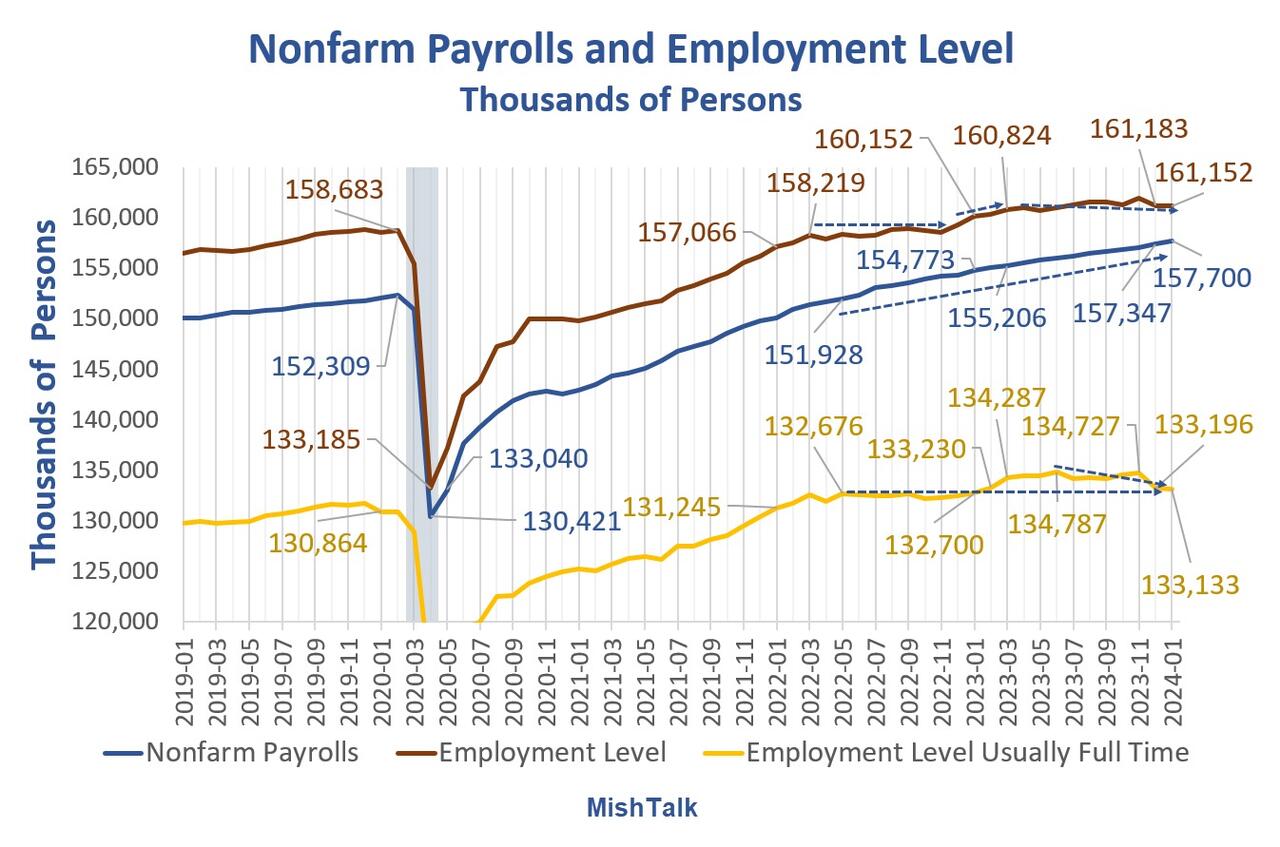
Nonfarm payrolls and employment levels from the BLS, chart by Mish.
-
February 5, 2024: Big Explosion of Government and Social Assistance Jobs in 2023 to Help Migrants
-
February 16, 2024: Over 100% of the Increase in Employment Since 2020 is Foreign Born
-
February 2, 2024: Jobs Soar but Full Time Employment Is Barely Changed Since May 2022
But hey, that’s OK because on average, the economy is great. Or do we really mean, on average the stock market is great, and the average homeowner is fine?
Hello Mr. Powell
There are two economies (the homeowners/asset holders and everyone else). However, there is only one interest rate. Patience please says Powell.
Lowering rates risks risks fueling the housing bubble and the most expensive stock market in history.
Hello Mr. Powell, it’s your move.
Uncategorized
NY Fed Finds Medium, Long-Term Inflation Expectations Jump Amid Surge In Stock Market Optimism
NY Fed Finds Medium, Long-Term Inflation Expectations Jump Amid Surge In Stock Market Optimism
One month after the inflation outlook tracked…
Share this:


One month after the inflation outlook tracked by the NY Fed Consumer Survey extended their late 2023 slide, with 3Y inflation expectations in January sliding to a record low 2.4% (from 2.6% in December), even as 1 and 5Y inflation forecasts remained flat, moments ago the NY Fed reported that in February there was a sharp rebound in longer-term inflation expectations, rising to 2.7% from 2.4% at the three-year ahead horizon, and jumping to 2.9% from 2.5% at the five-year ahead horizon, while the 1Y inflation outlook was flat for the 3rd month in a row, stuck at 3.0%.
The increases in both the three-year ahead and five-year ahead measures were most pronounced for respondents with at most high school degrees (in other words, the "really smart folks" are expecting deflation soon). The survey’s measure of disagreement across respondents (the difference between the 75th and 25th percentile of inflation expectations) decreased at all horizons, while the median inflation uncertainty—or the uncertainty expressed regarding future inflation outcomes—declined at the one- and three-year ahead horizons and remained unchanged at the five-year ahead horizon.
Going down the survey, we find that the median year-ahead expected price changes increased by 0.1 percentage point to 4.3% for gas; decreased by 1.8 percentage points to 6.8% for the cost of medical care (its lowest reading since September 2020); decreased by 0.1 percentage point to 5.8% for the cost of a college education; and surprisingly decreased by 0.3 percentage point for rent to 6.1% (its lowest reading since December 2020), and remained flat for food at 4.9%.

We find the rent expectations surprising because it is happening just asking rents are rising across the country.

At the same time as consumers erroneously saw sharply lower rents, median home price growth expectations remained unchanged for the fifth consecutive month at 3.0%.
Turning to the labor market, the survey found that the average perceived likelihood of voluntary and involuntary job separations increased, while the perceived likelihood of finding a job (in the event of a job loss) declined. "The mean probability of leaving one’s job voluntarily in the next 12 months also increased, by 1.8 percentage points to 19.5%."

Mean unemployment expectations - or the mean probability that the U.S. unemployment rate will be higher one year from now - decreased by 1.1 percentage points to 36.1%, the lowest reading since February 2022. Additionally, the median one-year-ahead expected earnings growth was unchanged at 2.8%, remaining slightly below its 12-month trailing average of 2.9%.
Turning to household finance, we find the following:
- The median expected growth in household income remained unchanged at 3.1%. The series has been moving within a narrow range of 2.9% to 3.3% since January 2023, and remains above the February 2020 pre-pandemic level of 2.7%.
- Median household spending growth expectations increased by 0.2 percentage point to 5.2%. The increase was driven by respondents with a high school degree or less.
- Median year-ahead expected growth in government debt increased to 9.3% from 8.9%.
- The mean perceived probability that the average interest rate on saving accounts will be higher in 12 months increased by 0.6 percentage point to 26.1%, remaining below its 12-month trailing average of 30%.
- Perceptions about households’ current financial situations deteriorated somewhat with fewer respondents reporting being better off than a year ago. Year-ahead expectations also deteriorated marginally with a smaller share of respondents expecting to be better off and a slightly larger share of respondents expecting to be worse off a year from now.
- The mean perceived probability that U.S. stock prices will be higher 12 months from now increased by 1.4 percentage point to 38.9%.
- At the same time, perceptions and expectations about credit access turned less optimistic: "Perceptions of credit access compared to a year ago deteriorated with a larger share of respondents reporting tighter conditions and a smaller share reporting looser conditions compared to a year ago."

Also, a smaller percentage of consumers, 11.45% vs 12.14% in prior month, expect to not be able to make minimum debt payment over the next three months

Last, and perhaps most humorous, is the now traditional cognitive dissonance one observes with these polls, because at a time when long-term inflation expectations jumped, which clearly suggests that financial conditions will need to be tightened, the number of respondents expecting higher stock prices one year from today jumped to the highest since November 2021... which incidentally is just when the market topped out during the last cycle before suffering a painful bear market.

Uncategorized
Homes listed for sale in early June sell for $7,700 more
New Zillow research suggests the spring home shopping season may see a second wave this summer if mortgage rates fall
The post Homes listed for sale in…
Share this:


- A Zillow analysis of 2023 home sales finds homes listed in the first two weeks of June sold for 2.3% more.
- The best time to list a home for sale is a month later than it was in 2019, likely driven by mortgage rates.
- The best time to list can be as early as the second half of February in San Francisco, and as late as the first half of July in New York and Philadelphia.
Spring home sellers looking to maximize their sale price may want to wait it out and list their home for sale in the first half of June. A new Zillow® analysis of 2023 sales found that homes listed in the first two weeks of June sold for 2.3% more, a $7,700 boost on a typical U.S. home.
The best time to list consistently had been early May in the years leading up to the pandemic. The shift to June suggests mortgage rates are strongly influencing demand on top of the usual seasonality that brings buyers to the market in the spring. This home-shopping season is poised to follow a similar pattern as that in 2023, with the potential for a second wave if the Federal Reserve lowers interest rates midyear or later.
The 2.3% sale price premium registered last June followed the first spring in more than 15 years with mortgage rates over 6% on a 30-year fixed-rate loan. The high rates put home buyers on the back foot, and as rates continued upward through May, they were still reassessing and less likely to bid boldly. In June, however, rates pulled back a little from 6.79% to 6.67%, which likely presented an opportunity for determined buyers heading into summer. More buyers understood their market position and could afford to transact, boosting competition and sale prices.
The old logic was that sellers could earn a premium by listing in late spring, when search activity hit its peak. Now, with persistently low inventory, mortgage rate fluctuations make their own seasonality. First-time home buyers who are on the edge of qualifying for a home loan may dip in and out of the market, depending on what’s happening with rates. It is almost certain the Federal Reserve will push back any interest-rate cuts to mid-2024 at the earliest. If mortgage rates follow, that could bring another surge of buyers later this year.
Mortgage rates have been impacting affordability and sale prices since they began rising rapidly two years ago. In 2022, sellers nationwide saw the highest sale premium when they listed their home in late March, right before rates barreled past 5% and continued climbing.
Zillow’s research finds the best time to list can vary widely by metropolitan area. In 2023, it was as early as the second half of February in San Francisco, and as late as the first half of July in New York. Thirty of the top 35 largest metro areas saw for-sale listings command the highest sale prices between May and early July last year.
Zillow also found a wide range in the sale price premiums associated with homes listed during those peak periods. At the hottest time of the year in San Jose, homes sold for 5.5% more, a $88,000 boost on a typical home. Meanwhile, homes in San Antonio sold for 1.9% more during that same time period.
| Metropolitan Area | Best Time to List | Price Premium | Dollar Boost |
| United States | First half of June | 2.3% | $7,700 |
| New York, NY | First half of July | 2.4% | $15,500 |
| Los Angeles, CA | First half of May | 4.1% | $39,300 |
| Chicago, IL | First half of June | 2.8% | $8,800 |
| Dallas, TX | First half of June | 2.5% | $9,200 |
| Houston, TX | Second half of April | 2.0% | $6,200 |
| Washington, DC | Second half of June | 2.2% | $12,700 |
| Philadelphia, PA | First half of July | 2.4% | $8,200 |
| Miami, FL | First half of June | 2.3% | $12,900 |
| Atlanta, GA | Second half of June | 2.3% | $8,700 |
| Boston, MA | Second half of May | 3.5% | $23,600 |
| Phoenix, AZ | First half of June | 3.2% | $14,700 |
| San Francisco, CA | Second half of February | 4.2% | $50,300 |
| Riverside, CA | First half of May | 2.7% | $15,600 |
| Detroit, MI | First half of July | 3.3% | $7,900 |
| Seattle, WA | First half of June | 4.3% | $31,500 |
| Minneapolis, MN | Second half of May | 3.7% | $13,400 |
| San Diego, CA | Second half of April | 3.1% | $29,600 |
| Tampa, FL | Second half of June | 2.1% | $8,000 |
| Denver, CO | Second half of May | 2.9% | $16,900 |
| Baltimore, MD | First half of July | 2.2% | $8,200 |
| St. Louis, MO | First half of June | 2.9% | $7,000 |
| Orlando, FL | First half of June | 2.2% | $8,700 |
| Charlotte, NC | Second half of May | 3.0% | $11,000 |
| San Antonio, TX | First half of June | 1.9% | $5,400 |
| Portland, OR | Second half of April | 2.6% | $14,300 |
| Sacramento, CA | First half of June | 3.2% | $17,900 |
| Pittsburgh, PA | Second half of June | 2.3% | $4,700 |
| Cincinnati, OH | Second half of April | 2.7% | $7,500 |
| Austin, TX | Second half of May | 2.8% | $12,600 |
| Las Vegas, NV | First half of June | 3.4% | $14,600 |
| Kansas City, MO | Second half of May | 2.5% | $7,300 |
| Columbus, OH | Second half of June | 3.3% | $10,400 |
| Indianapolis, IN | First half of July | 3.0% | $8,100 |
| Cleveland, OH | First half of July | 3.4% | $7,400 |
| San Jose, CA | First half of June | 5.5% | $88,400 |
The post Homes listed for sale in early June sell for $7,700 more appeared first on Zillow Research.
federal reserve pandemic home sales mortgage rates interest ratesUncategorized
February Employment Situation
By Paul Gomme and Peter Rupert The establishment data from the BLS showed a 275,000 increase in payroll employment for February, outpacing the 230,000…
Share this:


By Paul Gomme and Peter Rupert
The establishment data from the BLS showed a 275,000 increase in payroll employment for February, outpacing the 230,000 average over the previous 12 months. The payroll data for January and December were revised down by a total of 167,000. The private sector added 223,000 new jobs, the largest gain since May of last year.

Temporary help services employment continues a steep decline after a sharp post-pandemic rise.


Average hours of work increased from 34.2 to 34.3. The increase, along with the 223,000 private employment increase led to a hefty increase in total hours of 5.6% at an annualized rate, also the largest increase since May of last year.

The establishment report, once again, beat “expectations;” the WSJ survey of economists was 198,000. Other than the downward revisions, mentioned above, another bit of negative news was a smallish increase in wage growth, from $34.52 to $34.57.

The household survey shows that the labor force increased 150,000, a drop in employment of 184,000 and an increase in the number of unemployed persons of 334,000. The labor force participation rate held steady at 62.5, the employment to population ratio decreased from 60.2 to 60.1 and the unemployment rate increased from 3.66 to 3.86. Remember that the unemployment rate is the number of unemployed relative to the labor force (the number employed plus the number unemployed). Consequently, the unemployment rate can go up if the number of unemployed rises holding fixed the labor force, or if the labor force shrinks holding the number unemployed unchanged. An increase in the unemployment rate is not necessarily a bad thing: it may reflect a strong labor market drawing “marginally attached” individuals from outside the labor force. Indeed, there was a 96,000 decline in those workers.


Earlier in the week, the BLS announced JOLTS (Job Openings and Labor Turnover Survey) data for January. There isn’t much to report here as the job openings changed little at 8.9 million, the number of hires and total separations were little changed at 5.7 million and 5.3 million, respectively.

As has been the case for the last couple of years, the number of job openings remains higher than the number of unemployed persons.

Also earlier in the week the BLS announced that productivity increased 3.2% in the 4th quarter with output rising 3.5% and hours of work rising 0.3%.

The bottom line is that the labor market continues its surprisingly (to some) strong performance, once again proving stronger than many had expected. This strength makes it difficult to justify any interest rate cuts soon, particularly given the recent inflation spike.
unemployment pandemic unemployment


-

 Uncategorized3 weeks ago
All Of The Elements Are In Place For An Economic Crisis Of Staggering Proportions
-

 Uncategorized1 month ago
Cathie Wood sells a major tech stock (again)
-

 Uncategorized3 weeks ago
California Counties Could Be Forced To Pay $300 Million To Cover COVID-Era Program
-

 Uncategorized2 weeks ago
Apparel Retailer Express Moving Toward Bankruptcy
-

 Uncategorized4 weeks ago
Industrial Production Decreased 0.1% in January
-

 International3 days ago
EyePoint poaches medical chief from Apellis; Sandoz CFO, longtime BioNTech exec to retire
-

 International3 days ago
Walmart launches clever answer to Target’s new membership program
-

 Uncategorized3 weeks ago
RFK Jr: The Wuhan Cover-Up & The Rise Of The Biowarfare-Industrial Complex