Uncategorized
The 1970s Inflation Rollercoaster – Part Two
Part One of this series highlights how the government’s fixation with full employment and the Fed’s belief in the faulty Phillips Curve model from 1965…
Share this:


Part One of this series highlights how the government’s fixation with full employment and the Fed’s belief in the faulty Phillips Curve model from 1965 to 1982 fueled multiple bouts of inflation. We also touched on that fateful day in 1971 when President Nixon removed the fiscal and monetary shackles, essentially giving the government and the Fed more power to alter the economy and stoke inflation.
We start Part Two with more on the Fed and the nation’s money supply in that era. While the Fed and government played a significant role in generating inflation fifty years ago, there were other factors.
Lastly, the Fed may have started and strengthened the inflation fire, but the same Fed under Paul Volcker also helped extinguish it. We will examine the change in mindset at the Fed in the mid- to late 1970s.
To repeat ourselves from Part One, inflation is a critical component in assessing future stock and bond performance. To better evaluate the odds that high inflation creeps up again, as it did in the 70s, we must understand what happened then and appreciate the similarities and differences from today.
More On the Fed and Milton Friedman
As we did in Part One, we let the Fed summarize its errors during the Authur Burns era at the Fed (1970-1978). The following section from The Burns Disinflation of 1974, was written by Thomas Lubik, Christian Matthes, and Tim Sablik of the Richmond Fed.
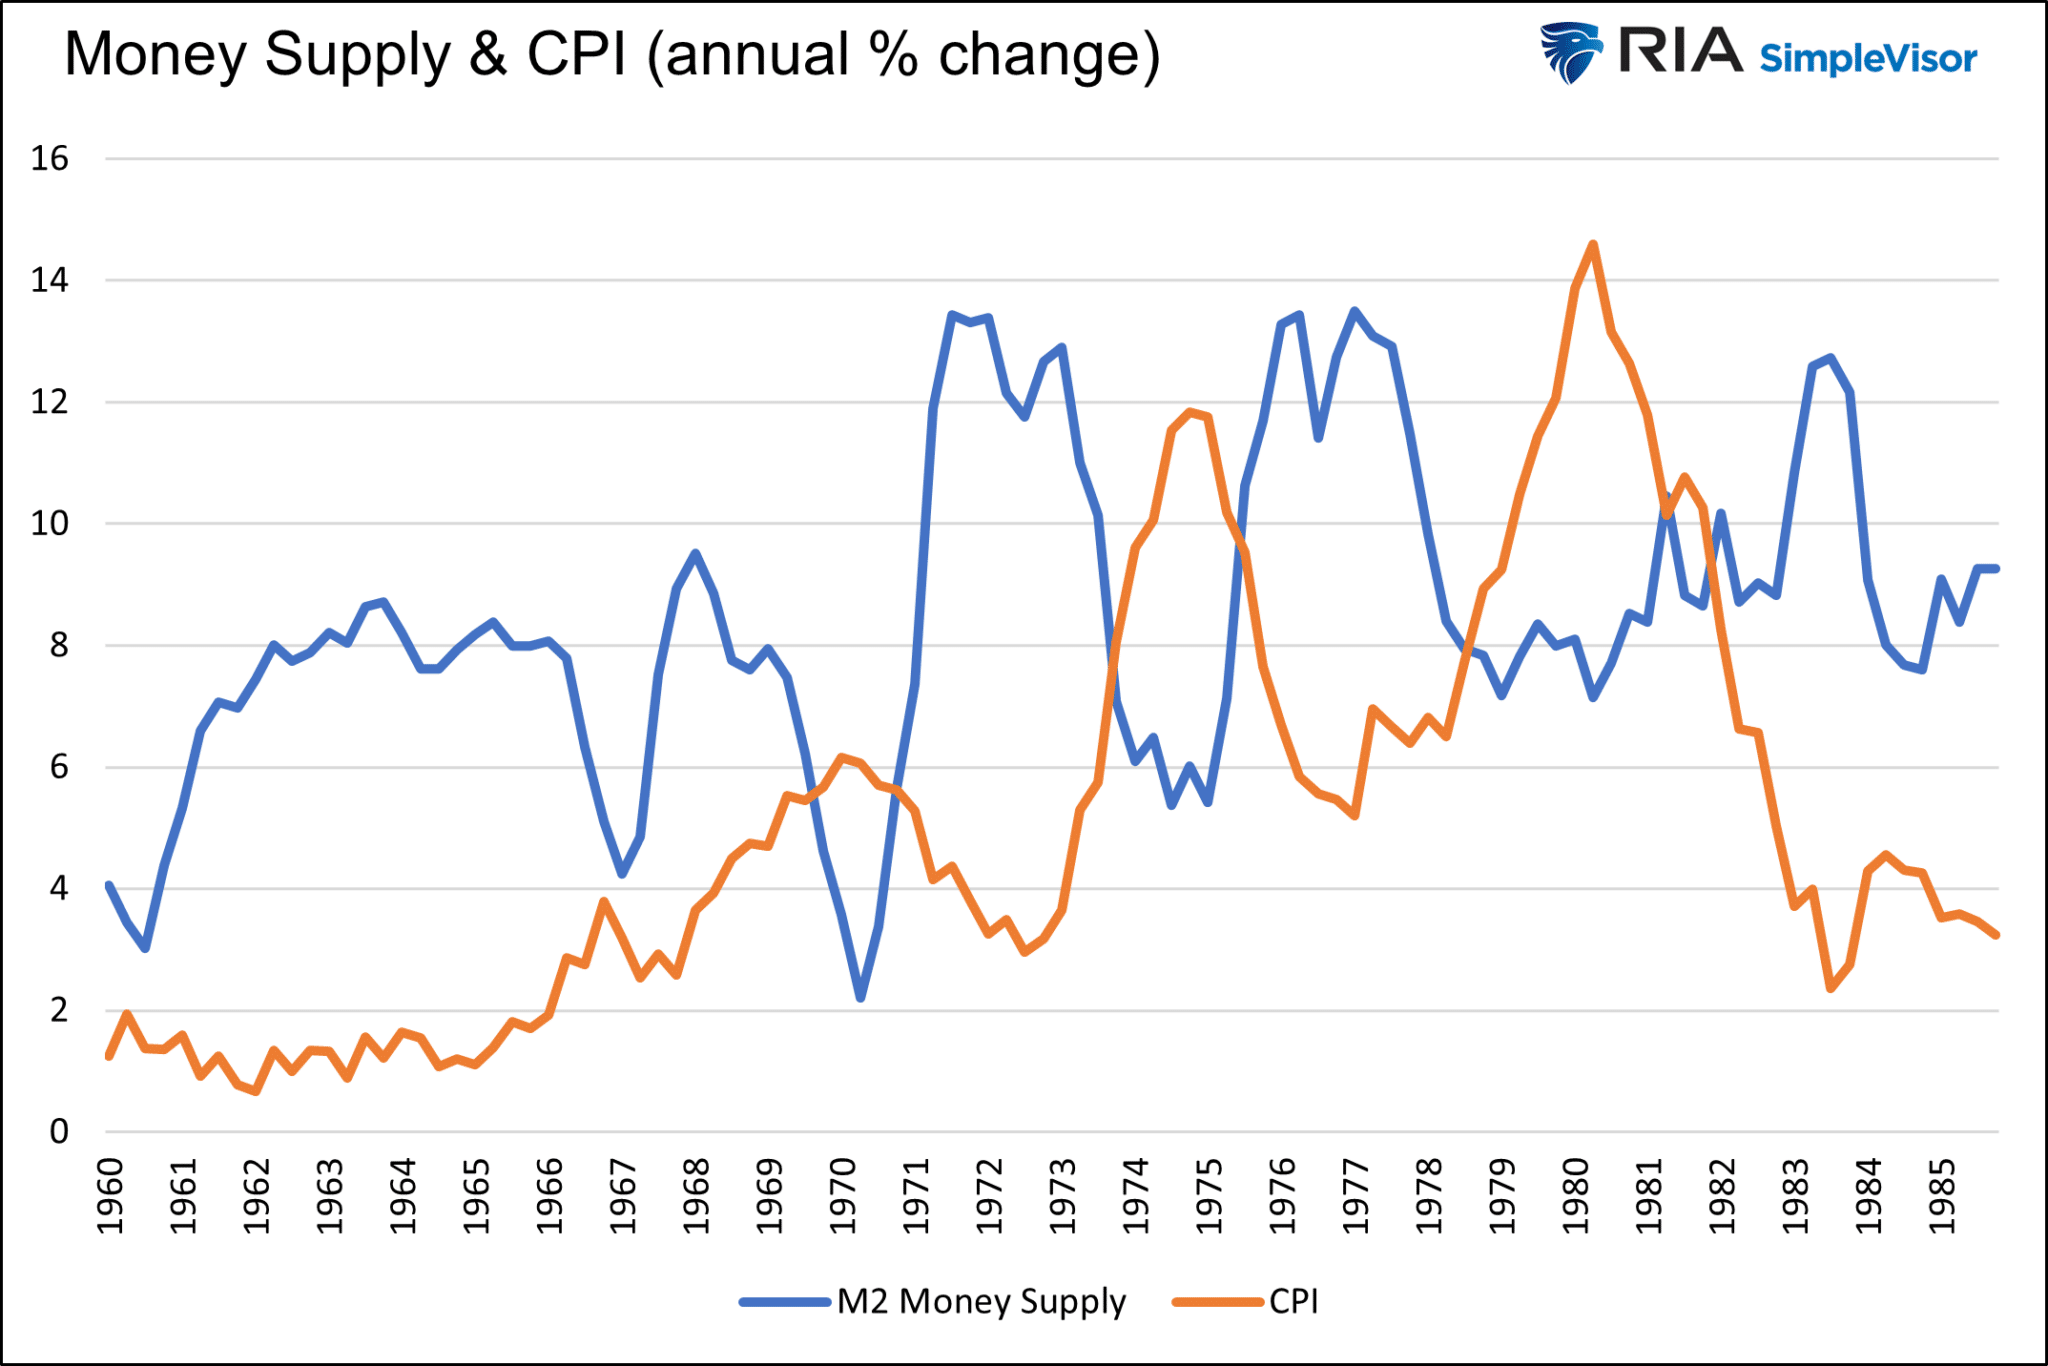
Milton Friedman famously said that “inflation is always and everywhere a monetary phenomenon.” It is hardly surprising, then, that economists have long viewed the Fed as central to understanding what caused the Great Inflation and what prompted the shift to the Great Moderation. Indeed, the conventional narrative is that the Fed, under Chairman Arthur Burns, pursued what has often been called “stop-go” monetary policy, meaning it targeted lower inflation but reversed course whenever employment looked weak and vice versa. This approach contributed to inflation’s volatility and encouraged expectations of higher future inflation because the Fed was seen as opportunistically pursuing short-term goals at the expense of longer-term stability.
The paragraph starts with a legendary quote from economist Milton Friedman. Friedman implies that inflation and money supply are tied at the hip. The graph below shows Friedman was onto something. Spurts in money supply growth preceded the three peaks of high inflation.
Contrary to Friedman’s popular theory, inflation is also a function of monetary velocity. Velocity measures how often money circulates throughout the economy. The inflationary effect is negligible if money is printed recklessly but not spent. Conversely, inflation will increase if the velocity of money increases despite a stagnant money supply.
The graph below compares the annual change in the money supply and its velocity. As you can see, they are most often negatively correlated. The graph may lead one to believe that inflation should have been benign in the 70s because money supply and velocity largely offset each other. But a little math shows that there were periods in which significant money supply growth outstripped declines in velocity and periods where both money and velocity grew at the same time. The second graph shows the net growth of money supply and velocity was positive through the 1960 to 1980 era and largely trended higher.


If high money supply growth was a critical culprit causing high inflation, as we and most others agree, the Fed is guilty of never taking its foot off the gas pedal.
Oil Price Shocks
Inflation was not solely due to fiscal and monetary folly. Two oil price shocks in the 1970s contributed significantly to inflation. Per the Washington Post:
The line of cars stretches for blocks. Pumps run dry. Newspapers warn of a great “gas crunch.” The president urges calm. Panicked motorists turn on one another.

In 1973, the price of crude oil doubled when the Organization of Arab Petroleum Exporting Countries (OAPEC) declared an oil embargo against the U.S. and other countries supporting Israel during the Yom Kippur War.
Six years later, in 1979, the Iranian Revolution disrupted the oil flow to America, resulting in an additional tripling of oil prices.

It wasn’t just the impact of higher oil prices on the government’s CPI calculations that contributed to higher inflation. As energy prices rose appreciably, businesses faced higher transportation and production costs. The prices of plastics, clothes, toothpaste, and many other goods made with oil escalated with oil prices.

The higher costs of production and transportation were passed on to consumers. As we share below, goods represented nearly half of personal consumption in the 1970s. Today, they only account for about a third of total consumption. Therefore, higher oil prices impacted inflation more than they would today.

Additionally, the U.S. depended more on imported oil from OPEC and other countries than it does now. Consider that in 1978, the U.S. imported 8,363,000 barrels of oil per day. The latest data point, albeit a year old, was 8,329,000 barrels per day. But today’s GDP is more than 10 times larger, and domestic consumption of petroleum products has doubled since 1960.
While domestic and global oil prices are a function of global supply and demand, the effect of an embargo today would be much less impactful than in the 70s.
Price-Wage Spiral
In the 1970s, workers demanded higher wages to offset the rising cost of living. Simultaneously, business owners, having to pay higher salaries, responded by increasing prices. The cycle resulted in a self-reinforcing loop, which further amplified inflationary pressures.
In 2022, Jerome Powell frequently harkened back to the 1970s, recalling how the circular relationship between prices and wages fed inflation. Such a feedback loop is called a price-wage spiral. Powell and the Fed were intent on returning inflation to its target before such a loop could intensify inflationary pressures.
Unlike today, unions were much more prevalent and stronger in the 1970s. Accordingly, they had much more success negotiating more lucrative wages and benefit increases for their members. In 1983, 20% of U.S. workers were union members. That is more than twice today’s membership.
Strike Two for Nixon- Wage And Price Controls
As we share in Part One, in August 1971, President Nixon took the U.S. off the gold standard, unleashing the government’s and Fed’s powers. At the same time, he imposed wage and price controls.
By freezing wages and prices, the government dislocated fundamental market mechanisms that usually allow the economy to adjust for changes in the supply and demand of goods. For instance, businesses facing increased costs could not push higher prices through to their customers. As a result, they reduced output, resulting in shortages in some cases. Additionally, the controls discouraged investment and innovation. Many businesses were hamstrung to respond to changing economic conditions.
While wage and price controls limited inflation temporarily, the longer-term impact of Nixon’s actions exacerbated inflationary pressures and weakened economic activity.
Paul Volcker To The Rescue
As the 1970s marched on, the Fed, economists, and politicians became painfully aware the Phillips Curve was faulty. It turns out that high unemployment and high inflation are not mutually exclusive. Additionally, managing the nation’s money supply has broad economic and inflation ramifications.
In 1978, government and Fed policy were recodified via the Full Employment and Balanced Growth Act. Unlike the Employment Act of 1946, this act required that fiscal and monetary policy focus on full employment and price stability. Additionally, it required the Fed to establish targets for the growth of the money supply.
Armed with new legislation and economic theories, Paul Volcker became the Chairman of the Fed in 1979. One of his first actions was to target bank reserve growth rather than Fed Funds. Bank reserves allow banks to create money. Therefore, managing reserve growth indirectly allowed the Fed to control the money supply better. The Fed Funds rate is much less effective at managing the money supply.
Restricted reserve growth coupled with high-interest rates gave banks little incentive to lend and, by default, create money. By the mid-1980s, Volcker and the Fed tamed the recurrent spikes of high inflation. From that point forward, the balanced approach toward managing employment and inflation while focusing on the money supply has generally kept inflation low and stable.
Summary Part Two
Parts One and Two highlight the complexity and pitfalls of government intervention. Bad policies and faulty theories led to the initial burst of inflation in the 1960s and subsequent higher inflation levels.
In rehashing that period 50 years ago compared to today, we see that the government and Fed are bound to make mistakes. However, as we will show in Part Three, recent experiences differ greatly from the 1970s. While grave fiscal and monetary mistakes were made during the Pandemic, their faults were realized, and actions were taken to reverse, not accentuate, inflation.
The post The 1970s Inflation Rollercoaster – Part Two appeared first on RIA.
unemployment default pandemic monetary policy fed gdp interest rates unemployment gold oilUncategorized
NY Fed Finds Medium, Long-Term Inflation Expectations Jump Amid Surge In Stock Market Optimism
NY Fed Finds Medium, Long-Term Inflation Expectations Jump Amid Surge In Stock Market Optimism
One month after the inflation outlook tracked…
Share this:


One month after the inflation outlook tracked by the NY Fed Consumer Survey extended their late 2023 slide, with 3Y inflation expectations in January sliding to a record low 2.4% (from 2.6% in December), even as 1 and 5Y inflation forecasts remained flat, moments ago the NY Fed reported that in February there was a sharp rebound in longer-term inflation expectations, rising to 2.7% from 2.4% at the three-year ahead horizon, and jumping to 2.9% from 2.5% at the five-year ahead horizon, while the 1Y inflation outlook was flat for the 3rd month in a row, stuck at 3.0%.
The increases in both the three-year ahead and five-year ahead measures were most pronounced for respondents with at most high school degrees (in other words, the "really smart folks" are expecting deflation soon). The survey’s measure of disagreement across respondents (the difference between the 75th and 25th percentile of inflation expectations) decreased at all horizons, while the median inflation uncertainty—or the uncertainty expressed regarding future inflation outcomes—declined at the one- and three-year ahead horizons and remained unchanged at the five-year ahead horizon.
Going down the survey, we find that the median year-ahead expected price changes increased by 0.1 percentage point to 4.3% for gas; decreased by 1.8 percentage points to 6.8% for the cost of medical care (its lowest reading since September 2020); decreased by 0.1 percentage point to 5.8% for the cost of a college education; and surprisingly decreased by 0.3 percentage point for rent to 6.1% (its lowest reading since December 2020), and remained flat for food at 4.9%.

We find the rent expectations surprising because it is happening just asking rents are rising across the country.

At the same time as consumers erroneously saw sharply lower rents, median home price growth expectations remained unchanged for the fifth consecutive month at 3.0%.
Turning to the labor market, the survey found that the average perceived likelihood of voluntary and involuntary job separations increased, while the perceived likelihood of finding a job (in the event of a job loss) declined. "The mean probability of leaving one’s job voluntarily in the next 12 months also increased, by 1.8 percentage points to 19.5%."

Mean unemployment expectations - or the mean probability that the U.S. unemployment rate will be higher one year from now - decreased by 1.1 percentage points to 36.1%, the lowest reading since February 2022. Additionally, the median one-year-ahead expected earnings growth was unchanged at 2.8%, remaining slightly below its 12-month trailing average of 2.9%.
Turning to household finance, we find the following:
- The median expected growth in household income remained unchanged at 3.1%. The series has been moving within a narrow range of 2.9% to 3.3% since January 2023, and remains above the February 2020 pre-pandemic level of 2.7%.
- Median household spending growth expectations increased by 0.2 percentage point to 5.2%. The increase was driven by respondents with a high school degree or less.
- Median year-ahead expected growth in government debt increased to 9.3% from 8.9%.
- The mean perceived probability that the average interest rate on saving accounts will be higher in 12 months increased by 0.6 percentage point to 26.1%, remaining below its 12-month trailing average of 30%.
- Perceptions about households’ current financial situations deteriorated somewhat with fewer respondents reporting being better off than a year ago. Year-ahead expectations also deteriorated marginally with a smaller share of respondents expecting to be better off and a slightly larger share of respondents expecting to be worse off a year from now.
- The mean perceived probability that U.S. stock prices will be higher 12 months from now increased by 1.4 percentage point to 38.9%.
- At the same time, perceptions and expectations about credit access turned less optimistic: "Perceptions of credit access compared to a year ago deteriorated with a larger share of respondents reporting tighter conditions and a smaller share reporting looser conditions compared to a year ago."

Also, a smaller percentage of consumers, 11.45% vs 12.14% in prior month, expect to not be able to make minimum debt payment over the next three months

Last, and perhaps most humorous, is the now traditional cognitive dissonance one observes with these polls, because at a time when long-term inflation expectations jumped, which clearly suggests that financial conditions will need to be tightened, the number of respondents expecting higher stock prices one year from today jumped to the highest since November 2021... which incidentally is just when the market topped out during the last cycle before suffering a painful bear market.

Uncategorized
Homes listed for sale in early June sell for $7,700 more
New Zillow research suggests the spring home shopping season may see a second wave this summer if mortgage rates fall
The post Homes listed for sale in…
Share this:


- A Zillow analysis of 2023 home sales finds homes listed in the first two weeks of June sold for 2.3% more.
- The best time to list a home for sale is a month later than it was in 2019, likely driven by mortgage rates.
- The best time to list can be as early as the second half of February in San Francisco, and as late as the first half of July in New York and Philadelphia.
Spring home sellers looking to maximize their sale price may want to wait it out and list their home for sale in the first half of June. A new Zillow® analysis of 2023 sales found that homes listed in the first two weeks of June sold for 2.3% more, a $7,700 boost on a typical U.S. home.
The best time to list consistently had been early May in the years leading up to the pandemic. The shift to June suggests mortgage rates are strongly influencing demand on top of the usual seasonality that brings buyers to the market in the spring. This home-shopping season is poised to follow a similar pattern as that in 2023, with the potential for a second wave if the Federal Reserve lowers interest rates midyear or later.
The 2.3% sale price premium registered last June followed the first spring in more than 15 years with mortgage rates over 6% on a 30-year fixed-rate loan. The high rates put home buyers on the back foot, and as rates continued upward through May, they were still reassessing and less likely to bid boldly. In June, however, rates pulled back a little from 6.79% to 6.67%, which likely presented an opportunity for determined buyers heading into summer. More buyers understood their market position and could afford to transact, boosting competition and sale prices.
The old logic was that sellers could earn a premium by listing in late spring, when search activity hit its peak. Now, with persistently low inventory, mortgage rate fluctuations make their own seasonality. First-time home buyers who are on the edge of qualifying for a home loan may dip in and out of the market, depending on what’s happening with rates. It is almost certain the Federal Reserve will push back any interest-rate cuts to mid-2024 at the earliest. If mortgage rates follow, that could bring another surge of buyers later this year.
Mortgage rates have been impacting affordability and sale prices since they began rising rapidly two years ago. In 2022, sellers nationwide saw the highest sale premium when they listed their home in late March, right before rates barreled past 5% and continued climbing.
Zillow’s research finds the best time to list can vary widely by metropolitan area. In 2023, it was as early as the second half of February in San Francisco, and as late as the first half of July in New York. Thirty of the top 35 largest metro areas saw for-sale listings command the highest sale prices between May and early July last year.
Zillow also found a wide range in the sale price premiums associated with homes listed during those peak periods. At the hottest time of the year in San Jose, homes sold for 5.5% more, a $88,000 boost on a typical home. Meanwhile, homes in San Antonio sold for 1.9% more during that same time period.
| Metropolitan Area | Best Time to List | Price Premium | Dollar Boost |
| United States | First half of June | 2.3% | $7,700 |
| New York, NY | First half of July | 2.4% | $15,500 |
| Los Angeles, CA | First half of May | 4.1% | $39,300 |
| Chicago, IL | First half of June | 2.8% | $8,800 |
| Dallas, TX | First half of June | 2.5% | $9,200 |
| Houston, TX | Second half of April | 2.0% | $6,200 |
| Washington, DC | Second half of June | 2.2% | $12,700 |
| Philadelphia, PA | First half of July | 2.4% | $8,200 |
| Miami, FL | First half of June | 2.3% | $12,900 |
| Atlanta, GA | Second half of June | 2.3% | $8,700 |
| Boston, MA | Second half of May | 3.5% | $23,600 |
| Phoenix, AZ | First half of June | 3.2% | $14,700 |
| San Francisco, CA | Second half of February | 4.2% | $50,300 |
| Riverside, CA | First half of May | 2.7% | $15,600 |
| Detroit, MI | First half of July | 3.3% | $7,900 |
| Seattle, WA | First half of June | 4.3% | $31,500 |
| Minneapolis, MN | Second half of May | 3.7% | $13,400 |
| San Diego, CA | Second half of April | 3.1% | $29,600 |
| Tampa, FL | Second half of June | 2.1% | $8,000 |
| Denver, CO | Second half of May | 2.9% | $16,900 |
| Baltimore, MD | First half of July | 2.2% | $8,200 |
| St. Louis, MO | First half of June | 2.9% | $7,000 |
| Orlando, FL | First half of June | 2.2% | $8,700 |
| Charlotte, NC | Second half of May | 3.0% | $11,000 |
| San Antonio, TX | First half of June | 1.9% | $5,400 |
| Portland, OR | Second half of April | 2.6% | $14,300 |
| Sacramento, CA | First half of June | 3.2% | $17,900 |
| Pittsburgh, PA | Second half of June | 2.3% | $4,700 |
| Cincinnati, OH | Second half of April | 2.7% | $7,500 |
| Austin, TX | Second half of May | 2.8% | $12,600 |
| Las Vegas, NV | First half of June | 3.4% | $14,600 |
| Kansas City, MO | Second half of May | 2.5% | $7,300 |
| Columbus, OH | Second half of June | 3.3% | $10,400 |
| Indianapolis, IN | First half of July | 3.0% | $8,100 |
| Cleveland, OH | First half of July | 3.4% | $7,400 |
| San Jose, CA | First half of June | 5.5% | $88,400 |
The post Homes listed for sale in early June sell for $7,700 more appeared first on Zillow Research.
federal reserve pandemic home sales mortgage rates interest ratesUncategorized
February Employment Situation
By Paul Gomme and Peter Rupert The establishment data from the BLS showed a 275,000 increase in payroll employment for February, outpacing the 230,000…
Share this:


By Paul Gomme and Peter Rupert
The establishment data from the BLS showed a 275,000 increase in payroll employment for February, outpacing the 230,000 average over the previous 12 months. The payroll data for January and December were revised down by a total of 167,000. The private sector added 223,000 new jobs, the largest gain since May of last year.

Temporary help services employment continues a steep decline after a sharp post-pandemic rise.


Average hours of work increased from 34.2 to 34.3. The increase, along with the 223,000 private employment increase led to a hefty increase in total hours of 5.6% at an annualized rate, also the largest increase since May of last year.

The establishment report, once again, beat “expectations;” the WSJ survey of economists was 198,000. Other than the downward revisions, mentioned above, another bit of negative news was a smallish increase in wage growth, from $34.52 to $34.57.

The household survey shows that the labor force increased 150,000, a drop in employment of 184,000 and an increase in the number of unemployed persons of 334,000. The labor force participation rate held steady at 62.5, the employment to population ratio decreased from 60.2 to 60.1 and the unemployment rate increased from 3.66 to 3.86. Remember that the unemployment rate is the number of unemployed relative to the labor force (the number employed plus the number unemployed). Consequently, the unemployment rate can go up if the number of unemployed rises holding fixed the labor force, or if the labor force shrinks holding the number unemployed unchanged. An increase in the unemployment rate is not necessarily a bad thing: it may reflect a strong labor market drawing “marginally attached” individuals from outside the labor force. Indeed, there was a 96,000 decline in those workers.


Earlier in the week, the BLS announced JOLTS (Job Openings and Labor Turnover Survey) data for January. There isn’t much to report here as the job openings changed little at 8.9 million, the number of hires and total separations were little changed at 5.7 million and 5.3 million, respectively.

As has been the case for the last couple of years, the number of job openings remains higher than the number of unemployed persons.

Also earlier in the week the BLS announced that productivity increased 3.2% in the 4th quarter with output rising 3.5% and hours of work rising 0.3%.

The bottom line is that the labor market continues its surprisingly (to some) strong performance, once again proving stronger than many had expected. This strength makes it difficult to justify any interest rate cuts soon, particularly given the recent inflation spike.
unemployment pandemic unemployment


-

 Uncategorized3 weeks ago
All Of The Elements Are In Place For An Economic Crisis Of Staggering Proportions
-

 Uncategorized1 month ago
Cathie Wood sells a major tech stock (again)
-

 Uncategorized3 weeks ago
California Counties Could Be Forced To Pay $300 Million To Cover COVID-Era Program
-

 Uncategorized2 weeks ago
Apparel Retailer Express Moving Toward Bankruptcy
-

 Uncategorized4 weeks ago
Industrial Production Decreased 0.1% in January
-

 International3 days ago
EyePoint poaches medical chief from Apellis; Sandoz CFO, longtime BioNTech exec to retire
-

 International3 days ago
Walmart launches clever answer to Target’s new membership program
-

 Uncategorized3 weeks ago
RFK Jr: The Wuhan Cover-Up & The Rise Of The Biowarfare-Industrial Complex