Uncategorized
Student Loans
Ah, the college experience! There’s a lot of growing up that happens in those four years—finding out who you are, learning to be even more independent,…
Share this:

Ah, the college experience! There’s a lot of growing up that happens in those four years—finding out who you are, learning to be even more independent, and for some, learning to do their own laundry. But one thing is certain. No matter when you go to school or where, it’s going to be expensive.
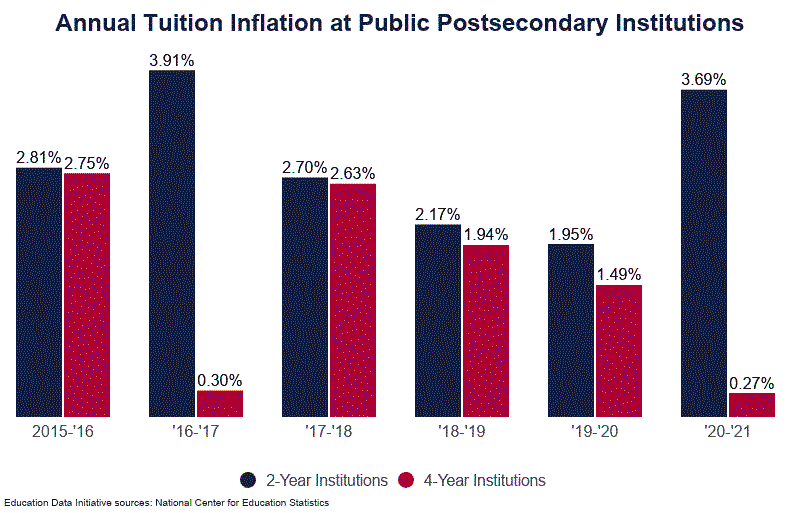
What drives the cost of college tuition? Inflation. Just as it pushes up the price of things we buy, it has the same effect on what you pay to go to school. Education Data Initiative has been gathering college tuition information for decades. Here’s what it found:
- The average annual cost of tuition at a public 4-year college is 37 times higher than tuition in 1963
- College tuition inflation averaged 4.64% annually from 2010 to 2020
- The cost of tuition at 4-year institutions increased 31.4% from 2010 to 2020
- After adjusting for currency inflation, college tuition has increased 747.8% since 1963
- The most extreme decade for tuition inflation was the 1980s, when tuition prices went up 121.4%
So, how do students pay for the ever-increasing cost of higher education? Sometimes mom and dad help, but few parents have enough to pay for it all. 85% of college students receive financial aid from grants, scholarships and college endowment funds. But most students have to borrow money to pay for school and the bulk of those loans are from the federal government.
In 2023
- 8 million Americans had federal student loan debt.
- 5% of students completing an under-graduate degree had federal student loans.
- 2% of those of those completing graduate school had federal student loans.
- 13% of students use some private source funding, such as banks, credits unions, credit cards and home equity for student loans.

Even though most student loans come from the federal government, they are still loans, they are still a financial commitment, and if not handled properly, they can have a long-term negative impact on credit scores.
How Student Loans Work
Student loans are a type of installment loan just like a car loan. You borrow a certain amount of money. You pay it back in regular installments and you pay interest on the amount of money you borrowed.
When students and their families apply for loans from the federal government, they begin by filling out the Free Application for Federal Student Aid (FAFSA). If approved, the U.S. Government becomes your lender.
Private financial institutions also offer student loans. Usually, the terms are not as favorable as the federal loan option which offers lower fixed interest rates, deferred payments as long as you’re enrolled as a student, and in certain situations, loan forgiveness.
Types of Student Loans
Direct Subsidized Loans are available to students who can demonstrate financial need. The government pays the interest on these loans during a predetermined grace period, usually while the student is still enrolled or recently graduated from college. During this time, borrowers are not required to make payments on the loans.
Direct Unsubsidized Loans are available to all students regardless of need. With these loans, the student is generally responsible for paying interest throughout the life of the loan. As with subsidized loans, borrowers are generally not required to make payments while they are still in school.
Direct PLUS loans are loans made available to the parents of dependent students and to students pursuing graduate or professional degrees. These loans typically have higher interest rates and fees than other types of federal student loans.
The Affect of a Student Loan on Credit Scores
Don’t be surprised if a lender, federal government or private, does a hard inquiry of your credit to see if they’ll take on the risk of lending you money. Hard inquiries tell a lender how often you’ve applied for credit, and your loan capacity or credit utilization ratio. The formula divides the amount of revolving credit you have by the total amount of your available credit. For example:
If you have a revolving credit balance of $1,000 and your credit limit is $2,000, you have a credit utilization ratio of 50%. ($1,000 / $2,000 = 50%)
If you have a revolving credit balance of $1,000 and a credit limit of $5,000, your credit utilization ratio is 20%. ($1,000 / $5,000 = 20%)
The lower the percentage the better credit risk you are. Credit utilization makes up 30% of your credit score.
Hard inquiries temporarily reduce your credit score for approximately 12 months.
Direct Subsidized Loans and Direct Unsubsidized loans are offered to students no matter what their credit history looks like. Lenders do not do hard inquiries on either of these types of loans, so there’s no hit on your credit score.
Direct PLUS loans, on the other hand, do require lending institutions to perform a hard inquiry and your credit score will be temporarily lowered.
That’s the negative. But there could be a positive effect. Having a student loan has the potential of improving your credit score by diversifying your credit mix. Lenders look at the different types of credit on your report—installment, revolving or unsecured. According to lenders, managing several types of debt at the same time shows that you’re a responsible borrower.
But the biggest factor affecting your credit score is how well you pay back what you owe. If you make the required student loan payments on time and don’t default, student loans can help establish or build your credit history. Payment history makes up 35% of your credit score.
Missing a Payment
If you miss a payment, you have 90 days before the loan is considered delinquent. After that time, missed payments appear on your credit reports and your credit scores may drop.
If you continue to miss payments, you run the risk of the loan going into default, which can further decrease your credit scores by a lot. You could also lose access to certain debt relief options, and you might be required to pay steep collection fees or have your wages garnished.
Bad Repayment History
If you are delinquent on your payments or stop paying all together, it will show up on your credit report. And it’s going to be there for a long time. For as much as seven years, any lender you try to get credit from will see that black mark on your credit report and may be reluctant to loan you money. That could be a car loan or a credit card. But it’s not just lenders that may be wary. Others who check credit reports are employers who are considering hiring you, landlords considering whether to rent to you, and insurance companies, who may charge you a higher premium because of your credit history.
Parts of a Credit Score
Good credit or bad credit, you need to be aware of the items a lender looks for when they check your credit and how much of an impact it can have on your score.
- Payment history—35%
- How much you owe—30%
- Length of credit history—15%
- How much new credit you have—10%. New credit is defined as
- New accounts
- Recent credit inquiries
- The age of your most recently opened credit account
- Credit mix—10%

Courtesy: MyFICO
Having Trouble Making Payments
If you’re struggling to pay back student loans, take action before your credit score takes a beating. Check into the possibility of lower monthly payments through an income-driven repayment plan (IDR). All IDRs share some similarities. Each caps payments between 10% and 20% of your discretionary income and forgives your remaining loan balance after 20-25 years of payments. The four plans are:
If you’re not able to make the monthly payments because of certain serious hardships, you may be able to defer the federal student loan repayment.
- Various circumstances may qualify you for deferment, including cancer treatment, economic hardship, re-enrolling in school, military service, rehabilitation training and unemployment. You will not have to make monthly payments during the deferment period, and interest typically does not accrue, though this can vary based on the type of loan you have. Be sure you know how interest is handled with your loan.
- With forbearance, you almost always have to pay the interest that accrues while you are not making monthly payments. The circumstances that qualify you for this temporary relief can include financial difficulties, medical expenses, a change in employment, AmeriCorps service, National Guard duty, some teaching services and enrollment in a medical or dental internship or residency.
Student Loan Repayment Best Practices
- Make payments during your grace period.Making payments on your loan — even during the grace period — will reduce the total amount you’ll have to pay in interest.
- Pay more than the minimum.If you can afford it, pay more than the minimum monthly payment to reduce your interest cost over time.
- Consider enrolling in autopay.Your loans may offer the option of making monthly payments automatically, which helps ensure you’re paying on time. In some cases, automatic payments can also reduce your interest rate.
- Be aware of your repayment options.If you can’t make a payment, contact your lender immediately. Make sure you know the debt relief programs that might be available to you, such as IDR plans or loan forgiveness.
For most people headed to college, a student loan is a big part of getting a quality education and preparing for your chosen profession. But before entering into a student loan agreement, know the terms and conditions of your loan, the repayment requirements, and the impact on your credit score.
unemployment default grants treatment interest ratesUncategorized
February Employment Situation
By Paul Gomme and Peter Rupert The establishment data from the BLS showed a 275,000 increase in payroll employment for February, outpacing the 230,000…
Share this:


By Paul Gomme and Peter Rupert
The establishment data from the BLS showed a 275,000 increase in payroll employment for February, outpacing the 230,000 average over the previous 12 months. The payroll data for January and December were revised down by a total of 167,000. The private sector added 223,000 new jobs, the largest gain since May of last year.

Temporary help services employment continues a steep decline after a sharp post-pandemic rise.


Average hours of work increased from 34.2 to 34.3. The increase, along with the 223,000 private employment increase led to a hefty increase in total hours of 5.6% at an annualized rate, also the largest increase since May of last year.

The establishment report, once again, beat “expectations;” the WSJ survey of economists was 198,000. Other than the downward revisions, mentioned above, another bit of negative news was a smallish increase in wage growth, from $34.52 to $34.57.

The household survey shows that the labor force increased 150,000, a drop in employment of 184,000 and an increase in the number of unemployed persons of 334,000. The labor force participation rate held steady at 62.5, the employment to population ratio decreased from 60.2 to 60.1 and the unemployment rate increased from 3.66 to 3.86. Remember that the unemployment rate is the number of unemployed relative to the labor force (the number employed plus the number unemployed). Consequently, the unemployment rate can go up if the number of unemployed rises holding fixed the labor force, or if the labor force shrinks holding the number unemployed unchanged. An increase in the unemployment rate is not necessarily a bad thing: it may reflect a strong labor market drawing “marginally attached” individuals from outside the labor force. Indeed, there was a 96,000 decline in those workers.


Earlier in the week, the BLS announced JOLTS (Job Openings and Labor Turnover Survey) data for January. There isn’t much to report here as the job openings changed little at 8.9 million, the number of hires and total separations were little changed at 5.7 million and 5.3 million, respectively.

As has been the case for the last couple of years, the number of job openings remains higher than the number of unemployed persons.

Also earlier in the week the BLS announced that productivity increased 3.2% in the 4th quarter with output rising 3.5% and hours of work rising 0.3%.

The bottom line is that the labor market continues its surprisingly (to some) strong performance, once again proving stronger than many had expected. This strength makes it difficult to justify any interest rate cuts soon, particularly given the recent inflation spike.
unemployment pandemic unemploymentUncategorized
Mortgage rates fall as labor market normalizes
Jobless claims show an expanding economy. We will only be in a recession once jobless claims exceed 323,000 on a four-week moving average.
Share this:


Everyone was waiting to see if this week’s jobs report would send mortgage rates higher, which is what happened last month. Instead, the 10-year yield had a muted response after the headline number beat estimates, but we have negative job revisions from previous months. The Federal Reserve’s fear of wage growth spiraling out of control hasn’t materialized for over two years now and the unemployment rate ticked up to 3.9%. For now, we can say the labor market isn’t tight anymore, but it’s also not breaking.
The key labor data line in this expansion is the weekly jobless claims report. Jobless claims show an expanding economy that has not lost jobs yet. We will only be in a recession once jobless claims exceed 323,000 on a four-week moving average.
From the Fed: In the week ended March 2, initial claims for unemployment insurance benefits were flat, at 217,000. The four-week moving average declined slightly by 750, to 212,250
Below is an explanation of how we got here with the labor market, which all started during COVID-19.
1. I wrote the COVID-19 recovery model on April 7, 2020, and retired it on Dec. 9, 2020. By that time, the upfront recovery phase was done, and I needed to model out when we would get the jobs lost back.
2. Early in the labor market recovery, when we saw weaker job reports, I doubled and tripled down on my assertion that job openings would get to 10 million in this recovery. Job openings rose as high as to 12 million and are currently over 9 million. Even with the massive miss on a job report in May 2021, I didn’t waver.
Currently, the jobs openings, quit percentage and hires data are below pre-COVID-19 levels, which means the labor market isn’t as tight as it once was, and this is why the employment cost index has been slowing data to move along the quits percentage.

3. I wrote that we should get back all the jobs lost to COVID-19 by September of 2022. At the time this would be a speedy labor market recovery, and it happened on schedule, too
Total employment data
4. This is the key one for right now: If COVID-19 hadn’t happened, we would have between 157 million and 159 million jobs today, which would have been in line with the job growth rate in February 2020. Today, we are at 157,808,000. This is important because job growth should be cooling down now. We are more in line with where the labor market should be when averaging 140K-165K monthly. So for now, the fact that we aren’t trending between 140K-165K means we still have a bit more recovery kick left before we get down to those levels.

From BLS: Total nonfarm payroll employment rose by 275,000 in February, and the unemployment rate increased to 3.9 percent, the U.S. Bureau of Labor Statistics reported today. Job gains occurred in health care, in government, in food services and drinking places, in social assistance, and in transportation and warehousing.
Here are the jobs that were created and lost in the previous month:

In this jobs report, the unemployment rate for education levels looks like this:
- Less than a high school diploma: 6.1%
- High school graduate and no college: 4.2%
- Some college or associate degree: 3.1%
- Bachelor’s degree or higher: 2.2%

Today’s report has continued the trend of the labor data beating my expectations, only because I am looking for the jobs data to slow down to a level of 140K-165K, which hasn’t happened yet. I wouldn’t categorize the labor market as being tight anymore because of the quits ratio and the hires data in the job openings report. This also shows itself in the employment cost index as well. These are key data lines for the Fed and the reason we are going to see three rate cuts this year.
recession unemployment covid-19 fed federal reserve mortgage rates recession recovery unemploymentUncategorized
Inside The Most Ridiculous Jobs Report In History: Record 1.2 Million Immigrant Jobs Added In One Month
Inside The Most Ridiculous Jobs Report In History: Record 1.2 Million Immigrant Jobs Added In One Month
Last month we though that the January…
Share this:


Last month we though that the January jobs report was the "most ridiculous in recent history" but, boy, were we wrong because this morning the Biden department of goalseeked propaganda (aka BLS) published the February jobs report, and holy crap was that something else. Even Goebbels would blush.
What happened? Let's take a closer look.
On the surface, it was (almost) another blockbuster jobs report, certainly one which nobody expected, or rather just one bank out of 76 expected. Starting at the top, the BLS reported that in February the US unexpectedly added 275K jobs, with just one research analyst (from Dai-Ichi Research) expecting a higher number.
Some context: after last month's record 4-sigma beat, today's print was "only" 3 sigma higher than estimates. Needless to say, two multiple sigma beats in a row used to only happen in the USSR... and now in the US, apparently.

Before we go any further, a quick note on what last month we said was "the most ridiculous jobs report in recent history": it appears the BLS read our comments and decided to stop beclowing itself. It did that by slashing last month's ridiculous print by over a third, and revising what was originally reported as a massive 353K beat to just 229K, a 124K revision, which was the biggest one-month negative revision in two years!

Of course, that does not mean that this month's jobs print won't be revised lower: it will be, and not just that month but every other month until the November election because that's the only tool left in the Biden admin's box: pretend the economic and jobs are strong, then revise them sharply lower the next month, something we pointed out first last summer and which has not failed to disappoint once.
In the past month the Biden department of goalseeking stuff higher before revising it lower, has revised the following data sharply lower:
— zerohedge (@zerohedge) August 30, 2023
- Jobs
- JOLTS
- New Home sales
- Housing Starts and Permits
- Industrial Production
- PCE and core PCE
To be fair, not every aspect of the jobs report was stellar (after all, the BLS had to give it some vague credibility). Take the unemployment rate, after flatlining between 3.4% and 3.8% for two years - and thus denying expectations from Sahm's Rule that a recession may have already started - in February the unemployment rate unexpectedly jumped to 3.9%, the highest since February 2022 (with Black unemployment spiking by 0.3% to 5.6%, an indicator which the Biden admin will quickly slam as widespread economic racism or something).

And then there were average hourly earnings, which after surging 0.6% MoM in January (since revised to 0.5%) and spooking markets that wage growth is so hot, the Fed will have no choice but to delay cuts, in February the number tumbled to just 0.1%, the lowest in two years...

... for one simple reason: last month's average wage surge had nothing to do with actual wages, and everything to do with the BLS estimate of hours worked (which is the denominator in the average wage calculation) which last month tumbled to just 34.1 (we were led to believe) the lowest since the covid pandemic...

... but has since been revised higher while the February print rose even more, to 34.3, hence why the latest average wage data was once again a product not of wages going up, but of how long Americans worked in any weekly period, in this case higher from 34.1 to 34.3, an increase which has a major impact on the average calculation.

While the above data points were examples of some latent weakness in the latest report, perhaps meant to give it a sheen of veracity, it was everything else in the report that was a problem starting with the BLS's latest choice of seasonal adjustments (after last month's wholesale revision), which have gone from merely laughable to full clownshow, as the following comparison between the monthly change in BLS and ADP payrolls shows. The trend is clear: the Biden admin numbers are now clearly rising even as the impartial ADP (which directly logs employment numbers at the company level and is far more accurate), shows an accelerating slowdown.

But it's more than just the Biden admin hanging its "success" on seasonal adjustments: when one digs deeper inside the jobs report, all sorts of ugly things emerge... such as the growing unprecedented divergence between the Establishment (payrolls) survey and much more accurate Household (actual employment) survey. To wit, while in January the BLS claims 275K payrolls were added, the Household survey found that the number of actually employed workers dropped for the third straight month (and 4 in the past 5), this time by 184K (from 161.152K to 160.968K).

This means that while the Payrolls series hits new all time highs every month since December 2020 (when according to the BLS the US had its last month of payrolls losses), the level of Employment has not budged in the past year. Worse, as shown in the chart below, such a gaping divergence has opened between the two series in the past 4 years, that the number of Employed workers would need to soar by 9 million (!) to catch up to what Payrolls claims is the employment situation.

There's more: shifting from a quantitative to a qualitative assessment, reveals just how ugly the composition of "new jobs" has been. Consider this: the BLS reports that in February 2024, the US had 132.9 million full-time jobs and 27.9 million part-time jobs. Well, that's great... until you look back one year and find that in February 2023 the US had 133.2 million full-time jobs, or more than it does one year later! And yes, all the job growth since then has been in part-time jobs, which have increased by 921K since February 2023 (from 27.020 million to 27.941 million).

Here is a summary of the labor composition in the past year: all the new jobs have been part-time jobs!

But wait there's even more, because now that the primary season is over and we enter the heart of election season and political talking points will be thrown around left and right, especially in the context of the immigration crisis created intentionally by the Biden administration which is hoping to import millions of new Democratic voters (maybe the US can hold the presidential election in Honduras or Guatemala, after all it is their citizens that will be illegally casting the key votes in November), what we find is that in February, the number of native-born workers tumbled again, sliding by a massive 560K to just 129.807 million. Add to this the December data, and we get a near-record 2.4 million plunge in native-born workers in just the past 3 months (only the covid crash was worse)!

The offset? A record 1.2 million foreign-born (read immigrants, both legal and illegal but mostly illegal) workers added in February!

Said otherwise, not only has all job creation in the past 6 years has been exclusively for foreign-born workers...

... but there has been zero job-creation for native born workers since June 2018!

This is a huge issue - especially at a time of an illegal alien flood at the southwest border...

... and is about to become a huge political scandal, because once the inevitable recession finally hits, there will be millions of furious unemployed Americans demanding a more accurate explanation for what happened - i.e., the illegal immigration floodgates that were opened by the Biden admin.
Which is also why Biden's handlers will do everything in their power to insure there is no official recession before November... and why after the election is over, all economic hell will finally break loose. Until then, however, expect the jobs numbers to get even more ridiculous.


Wendy’s has a new deal for daylight savings time haters


Mortgage rates fall as labor market normalizes


February Employment Situation


Shipping company files surprise Chapter 7 bankruptcy, liquidation
Wendy’s teases new $3 offer for upcoming holiday


Economic Earthquake Ahead? The Cracks Are Spreading Fast


Inside The Most Ridiculous Jobs Report In Recent History: Record 1.2 Million Immigrant Jobs Added In One Month
Inside The Most Ridiculous Jobs Report In History: Record 1.2 Million Immigrant Jobs Added In One Month
-

 Uncategorized2 weeks ago
All Of The Elements Are In Place For An Economic Crisis Of Staggering Proportions
-

 Uncategorized1 month ago
Cathie Wood sells a major tech stock (again)
-

 Uncategorized3 weeks ago
California Counties Could Be Forced To Pay $300 Million To Cover COVID-Era Program
-

 Uncategorized2 weeks ago
Apparel Retailer Express Moving Toward Bankruptcy
-

 Uncategorized3 weeks ago
Industrial Production Decreased 0.1% in January
-

 International2 days ago
Walmart launches clever answer to Target’s new membership program
-

 International2 days ago
EyePoint poaches medical chief from Apellis; Sandoz CFO, longtime BioNTech exec to retire
-

 Uncategorized3 weeks ago
RFK Jr: The Wuhan Cover-Up & The Rise Of The Biowarfare-Industrial Complex