S&T BANCORP, INC. ANNOUNCES SECOND QUARTER 2022 NET INCOME
S&T BANCORP, INC. ANNOUNCES SECOND QUARTER 2022 NET INCOME
PR Newswire
INDIANA, Pa., July 21, 2022
INDIANA, Pa., July 21, 2022 /PRNewswire/ — S&T Bancorp, Inc. (S&T) (NASDAQ: STBA), the holding company for S&T Bank, with operations…
Share this:


S&T BANCORP, INC. ANNOUNCES SECOND QUARTER 2022 NET INCOME
PR Newswire
INDIANA, Pa., July 21, 2022
INDIANA, Pa., July 21, 2022 /PRNewswire/ -- S&T Bancorp, Inc. (S&T) (NASDAQ: STBA), the holding company for S&T Bank, with operations in five markets including Western Pennsylvania, Eastern Pennsylvania, Northeast Ohio, Central Ohio and Upstate New York, announced net income of $28.9 million, or $0.74 per diluted share, for the second quarter of 2022 compared to net income of $29.1 million, or $0.74 per diluted share, for the first quarter of 2022 and net income of $28.4 million, or $0.72 per diluted share, for the second quarter of 2021.
- Return on average assets (ROA) of 1.25%, return on average equity (ROE) of 9.83% and return on average tangible equity (ROTE) (non-GAAP) of 14.63%.
- Pre-provision net revenue to average assets (PPNR) (non-GAAP) of 1.71%.
- Net interest income increased $7.5 million, or 11%, and NIM (FTE) (Non-GAAP) increased 40 basis points compared to the first quarter of 2022.
- Strong consumer loan growth of $111.7 million, or 27.5% annualized, compared to March 31, 2022.
- Nonperforming assets decreased $20.7 million, or 34.8%, compared to March 31, 2022.
- S&T's Board of Directors approved a $0.30 per share dividend compared to $0.28 per share in the same period last year.
"Our performance was strong this quarter with significant growth in net interest income and net interest margin. We also saw significant improvement in our nonperforming assets with a decline of nearly 35% from the first quarter and a 66% decline from a year ago," said Chris McComish, chief executive officer. "We are extremely proud to be recently named by Forbes as a Best-In-State Bank especially on the heels of our recognition by J.D. Power as the highest in overall customer satisfaction with retail banking in the Pennsylvania region. Both awards are an honor and a true reflection of our dedicated employees and the trust our customers have placed in us to help meet their financial needs."
Net interest income increased $7.5 million, or 11%, to $75.2 million for the second quarter of 2022 compared to $67.7 million for the first quarter of 2022. The increase in net interest income was primarily due to higher interest rates in the second quarter. The yield on total average loans increased 34 basis points compared to the first quarter of 2022 while the cost of total interest-bearing deposits remained unchanged at 0.14%. Net interest margin on a fully taxable equivalent basis (NIM) (FTE) (non-GAAP) increased 40 basis points to 3.56% compared to 3.16% in the prior quarter.
Total nonperforming assets decreased $20.7 million, or 34.8%, to $38.8 million at June 30, 2022. The decrease primarily related to the resolution of a $9.9 million commercial and industrial, or C&I, relationship and additional loan pay-offs. Significant progress has been made in reducing nonperforming assets over the past year with a reduction of $74.9 million, or 65.9%, since June 30, 2021. Nonperforming assets to total loans plus other real estate owned, or OREO, decreased 30 basis points to 0.55% at June 30, 2022 compared to 0.85% at March 31, 2022 and 1.62% at June 30, 2021. Net loan charge-offs were $3.0 million for the second quarter of 2022 compared to net loan recoveries of $2.0 million in the first quarter of 2022. Gross loan charge-offs of $7.7 million were offset by recoveries of $4.7 million during the second quarter of 2022. The C&I relationship previously mentioned resulted in a $5.5 million charge-off which was offset by a $3.9 million C&I recovery from a relationship that was charged off in 2019. The provision for credit losses was $3.2 million for the second quarter of 2022 compared to negative $0.5 million in the first quarter of 2022. The negative provision in the first quarter of 2022 was mainly due to the net recovery of $2.0 million. The allowance for credit losses was 1.39% of total portfolio loans as of June 30, 2022 compared to 1.43% at March 31, 2022.
Noninterest income decreased $2.6 million to $12.6 million in the second quarter of 2022 compared to $15.2 million in the first quarter of 2022. Other income decreased $1.9 million primarily related to the decline in the fair value of the assets in a nonqualified benefit plan and a $0.5 million gain on sale of OREO in the first quarter of 2022. Mortgage banking income decreased $0.5 million due to a shift in the volume of loans sold to loans held in the portfolio. Noninterest expense increased $1.0 million to $48.4 million for the second quarter of 2022 compared to $47.4 million in the first quarter of 2022 mainly due to an increase of $1.1 million in salaries and employee benefits related to higher incentives and medical expense offset by a decline in the fair value of the liability in a nonqualified benefit plan. Professional services and legal increased $0.4 million related to various consulting engagements during the second quarter of 2022.
Total assets were $9.1 billion at June 30, 2022 compared to $9.4 billion at March 31, 2022. The decrease in total assets related to a $479.1 million decline in cash balances which was mainly due to a decrease in total deposits and an increase in loans. Total portfolio loans excluding, Paycheck Protection Program, or PPP, increased by $107.2 million, or 6.2% annualized, compared to March 31, 2022. The consumer loan portfolio grew $111.7 million, or 27.5% annualized, with strong growth in both residential mortgages and home equity compared to March 31, 2022. Noninterest-bearing demand deposits were stable at $2.7 billion compared to March 31, 2022.
Interest-bearing deposits declined $344.7 million compared to March 31, 2022. The decline in interest-bearing deposits was concentrated in higher balance, rate sensitive customer accounts.
During the second quarter of 2022, 151,220 common shares were repurchased at a total cost of $4.2 million, or an average of $27.46 per share. S&T continues to maintain a strong regulatory capital position with all capital ratios above the well-capitalized thresholds of federal bank regulatory agencies.
S&T's Board of Directors approved a $0.30 per share cash dividend on July 18, 2022. This dividend compares to a $0.28 per share dividend declared in the same period in the prior year. The dividend is payable August 18, 2022 to shareholders of record on August 4, 2022.
S&T will host its second quarter 2022 earnings conference call live over the Internet at 1:00 p.m. ET on Thursday, July 21, 2022. To access the webcast, go to S&T's webpage at www.stbancorp.com and click on "Events & Presentations." Select "2nd Quarter 2022 Earnings Conference Call" and follow the instructions. After the live presentation, the webcast will be archived on this website for at least 90 days. A replay of the call will also be available until July 28, 2022, by dialing 1.877.481.4010; the Conference ID is 45770.
S&T Bancorp, Inc. is a $9.1 billion bank holding company that is headquartered in Indiana, Pennsylvania and trades on the NASDAQ Global Select Market under the symbol STBA. Its principal subsidiary, S&T Bank, was established in 1902 and operates in five markets including Western Pennsylvania, Eastern Pennsylvania, Northeast Ohio, Central Ohio and Upstate New York. S&T Bank was recently named by Forbes as a 2022 Best-in-State Bank. S&T Bank also received the highest ranking in customer satisfaction for retail banking in the Pennsylvania region by J.D. Power*. For more information visit stbancorp.com or stbank.com. Follow us on Facebook, Instagram and LinkedIn.
*S&T Bank received the highest score in Pennsylvania in the J.D. Power 2022 U.S. Retail Banking Satisfaction Study of customers' satisfaction with their primary bank. Visit jdpower.com/awards for more details.
This information contains or incorporates statements that we believe are "forward-looking statements" within the meaning of the Private Securities Litigation Reform Act of 1995. Forward-looking statements generally relate to our financial condition, results of operations, plans, objectives, outlook for earnings, revenues, expenses, capital and liquidity levels and ratios, asset levels, asset quality, financial position and other matters regarding or affecting S&T and its future business and operations. Forward-looking statements are typically identified by words or phrases such as "will likely result," "expect," "anticipate," "estimate," "forecast," "project," "intend," "believe," "assume," "strategy," "trend," "plan," "outlook," "outcome," "continue," "remain," "potential," "opportunity," "comfortable," "current," "position," "maintain," "sustain," "seek," "achieve," and variations of such words and similar expressions, or future or conditional verbs such as will, would, should, could or may. Although we believe the assumptions upon which these forward-looking statements are based are reasonable, any of these assumptions could prove to be inaccurate and the forward-looking statements based on these assumptions could be incorrect. The matters discussed in these forward-looking statements are subject to various risks, uncertainties and other factors that could cause actual results and trends to differ materially from those made, projected, or implied in or by the forward-looking statements depending on a variety of uncertainties or other factors including, but not limited to: credit losses and the credit risk of our commercial and consumer loan products; changes in the level of charge-offs and changes in estimates of the adequacy of the allowance for credit losses; cyber-security concerns; rapid technological developments and changes; operational risks or risk management failures by us or critical third parties, including fraud risk; our ability to manage our reputational risks; sensitivity to the interest rate environment including a prolonged period of low interest rates, a rapid increase in interest rates or a change in the shape of the yield curve; a change in spreads on interest-earning assets and interest-bearing liabilities; the transition from LIBOR as a reference rate; regulatory supervision and oversight, including changes in regulatory capital requirements and our ability to address those requirements; unanticipated changes in our liquidity position; changes in accounting policies, practices or guidance; legislation affecting the financial services industry as a whole, and S&T, in particular; the outcome of pending and future litigation and governmental proceedings; increasing price and product/service competition; the ability to continue to introduce competitive new products and services on a timely, cost-effective basis; managing our internal growth and acquisitions; the possibility that the anticipated benefits from acquisitions, cannot be fully realized in a timely manner or at all, or that integrating the acquired operations will be more difficult, disruptive or costly than anticipated; containing costs and expenses; reliance on significant customer relationships; an interruption or cessation of an important service by a third-party provider; our ability to attract and retain talented executives and employees; our ability to successfully manage our CEO transition; general economic or business conditions, including the strength of regional economic conditions in our market area; the duration and severity of the coronavirus ("COVID-19") pandemic, both in our principal area of operations and nationally, including the ultimate impact of the pandemic on the economy generally and on our operations; our participation in the Paycheck Protection Program; deterioration of the housing market and reduced demand for mortgages; deterioration in the overall macroeconomic conditions or the state of the banking industry that could warrant further analysis of the carrying value of goodwill and could result in an adjustment to its carrying value resulting in a non-cash charge to net income; the stability of our core deposit base and access to contingency funding; re-emergence of turbulence in significant portions of the global financial and real estate markets that could impact our performance, both directly, by affecting our revenues and the value of our assets and liabilities, and indirectly, by affecting the economy generally and access to capital in the amounts, at the times and on the terms required to support our future businesses.
Many of these factors, as well as other factors, are described in our Annual Report on Form 10-K for the year ended December 31, 2021, including Part I, Item 1A-"Risk Factors" and any of our subsequent filings with the SEC. Forward-looking statements are based on beliefs and assumptions using information available at the time the statements are made. We caution you not to unduly rely on forward-looking statements because the assumptions, beliefs, expectations and projections about future events may, and often do, differ materially from actual results. Any forward-looking statement speaks only as to the date on which it is made, and we undertake no obligation to update any forward-looking statement to reflect developments occurring after the statement is made.
S&T Bancorp, Inc. | ||||||
Consolidated Selected Financial Data | ||||||
Unaudited | ||||||
2022 | 2022 | 2021 | ||||
Second | First | Second | ||||
(dollars in thousands, except per share data) | Quarter | Quarter | Quarter | |||
INTEREST AND DIVIDEND INCOME | ||||||
Loans, including fees | $71,018 | $64,593 | $66,942 | |||
Investment Securities: | ||||||
Taxable | 5,995 | 4,936 | 3,793 | |||
Tax-exempt | 484 | 482 | 690 | |||
Dividends | 102 | 98 | 152 | |||
Total Interest and Dividend Income | 77,599 | 70,109 | 71,577 | |||
INTEREST EXPENSE | ||||||
Deposits | 1,790 | 1,853 | 2,652 | |||
Borrowings and junior subordinated debt securities | 615 | 523 | 621 | |||
Total Interest Expense | 2,405 | 2,376 | 3,273 | |||
NET INTEREST INCOME | 75,194 | 67,733 | 68,304 | |||
Provision for credit losses | 3,204 | (512) | 2,561 | |||
Net Interest Income After Provision for Credit Losses | 71,990 | 68,245 | 65,743 | |||
NONINTEREST INCOME | ||||||
Net gain on sale of securities | — | — | 29 | |||
Debit and credit card | 4,756 | 5,063 | 4,744 | |||
Service charges on deposit accounts | 4,181 | 3,974 | 3,642 | |||
Wealth management | 3,247 | 3,242 | 3,167 | |||
Mortgage banking | 466 | 1,015 | 1,734 | |||
Other | (20) | 1,932 | 2,108 | |||
Total Noninterest Income | 12,630 | 15,226 | 15,424 | |||
NONINTEREST EXPENSE | ||||||
Salaries and employee benefits | 24,811 | 23,712 | 24,515 | |||
Data processing and information technology | 4,104 | 4,435 | 3,787 | |||
Occupancy | 3,634 | 3,882 | 3,434 | |||
Furniture, equipment and software | 2,939 | 2,777 | 2,402 | |||
Professional services and legal | 2,380 | 1,949 | 1,637 | |||
Other taxes | 1,682 | 1,537 | 1,832 | |||
Marketing | 1,524 | 1,361 | 996 | |||
FDIC insurance | 882 | 937 | 924 | |||
Other | 6,468 | 6,824 | 6,302 | |||
Total Noninterest Expense | 48,424 | 47,414 | 45,829 | |||
Income Before Taxes | 36,196 | 36,057 | 35,338 | |||
Income tax expense | 7,338 | 6,914 | 6,971 | |||
Net Income | $28,858 | $29,143 | $28,367 | |||
Per Share Data | ||||||
Shares outstanding at end of period | 39,148,999 | 39,351,688 | 39,345,719 | |||
Average shares outstanding - diluted | 39,099,631 | 39,089,933 | 39,048,971 | |||
Diluted earnings per share | $0.74 | $0.74 | $0.72 | |||
Dividends declared per share | $0.30 | $0.29 | $0.28 | |||
Dividend yield (annualized) | 4.37 % | 3.92 % | 3.58 % | |||
Dividends paid to net income | 40.86 % | 39.06 % | 38.74 % | |||
Book value | $30.10 | $30.11 | $30.21 | |||
Tangible book value (1) | $20.44 | $20.49 | $20.57 | |||
Market value | $27.43 | $29.58 | $31.30 | |||
Profitability Ratios (Annualized) | ||||||
Return on average assets | 1.25 % | 1.25 % | 1.21 % | |||
Return on average shareholders' equity | 9.83 % | 9.88 % | 9.65 % | |||
Return on average tangible shareholders' equity(2) | 14.63 % | 14.61 % | 14.41 % | |||
Pre-provision net revenue/ average assets(3) | 1.71 % | 1.52 % | 1.61 % | |||
Efficiency ratio (FTE)(4) | 54.82 % | 56.82 % | 54.37 % | |||
S&T Bancorp, Inc. | ||||||
Consolidated Selected Financial Data | ||||||
Unaudited | ||||||
Six Months Ended June 30, | ||||||
(dollars in thousands, except per share data) | 2022 | 2021 | ||||
INTEREST AND DIVIDEND INCOME | ||||||
Loans, including fees | $135,611 | $137,174 | ||||
Investment Securities: | ||||||
Taxable | 10,931 | 7,356 | ||||
Tax-exempt | 966 | 1,503 | ||||
Dividends | 200 | 325 | ||||
Total Interest and Dividend Income | 147,708 | 146,358 | ||||
INTEREST EXPENSE | ||||||
Deposits | 3,643 | 6,133 | ||||
Borrowings and junior subordinated debt securities | 1,138 | 1,263 | ||||
Total Interest Expense | 4,781 | 7,396 | ||||
NET INTEREST INCOME | 142,927 | 138,962 | ||||
Provision for credit losses | 2,692 | 5,699 | ||||
Net Interest Income After Provision for Credit Losses | 140,235 | 133,263 | ||||
NONINTEREST INCOME | ||||||
Net gain on sale of securities | — | 29 | ||||
Debit and credit card | 9,819 | 8,906 | ||||
Service charges on deposit accounts | 8,155 | 7,116 | ||||
Wealth management | 6,489 | 6,111 | ||||
Mortgage banking | 1,481 | 6,044 | ||||
Other | 1,912 | 4,541 | ||||
Total Noninterest Income | 27,856 | 32,747 | ||||
NONINTEREST EXPENSE | ||||||
Salaries and employee benefits | 48,523 | 47,842 | ||||
Data processing and information technology | 8,539 | 8,012 | ||||
Occupancy | 7,516 | 7,261 | ||||
Furniture, equipment and software | 5,716 | 5,042 | ||||
Professional services and legal | 4,329 | 3,168 | ||||
Other taxes | 3,219 | 3,268 | ||||
Marketing | 2,885 | 2,318 | ||||
FDIC insurance | 1,819 | 1,970 | ||||
Other | 13,292 | 12,614 | ||||
Total Noninterest Expense | 95,838 | 91,495 | ||||
Income Before Taxes | 72,253 | 74,515 | ||||
Income tax expense | 14,252 | 14,247 | ||||
Net Income | $58,001 | $60,268 | ||||
Per Share Data | ||||||
Average shares outstanding - diluted | 39,095,716 | 39,039,007 | ||||
Diluted earnings per share | $1.48 | $1.54 | ||||
Dividends declared per share | $0.59 | $0.56 | ||||
Dividends paid to net income | 39.96 % | 36.44 % | ||||
Profitability Ratios (annualized) | ||||||
Return on average assets | 1.25 % | 1.31 % | ||||
Return on average shareholders' equity | 9.85 % | 10.39 % | ||||
Return on average tangible shareholders' equity(5) | 14.62 % | 15.57 % | ||||
Pre-provision net revenue / average assets(6) | 1.62 % | 1.75 % | ||||
Efficiency ratio (FTE)(7) | 55.79 % | 52.89 % | ||||
S&T Bancorp, Inc. | ||||||
Consolidated Selected Financial Data | ||||||
Unaudited | ||||||
2022 | 2022 | 2021 | ||||
Second | First | Second | ||||
(dollars in thousands) | Quarter | Quarter | Quarter | |||
ASSETS | ||||||
Cash and due from banks, including interest-bearing deposits | $344,694 | $823,757 | $985,278 | |||
Securities, at fair value | 1,068,576 | 1,028,218 | 840,375 | |||
Loans held for sale | 1,311 | 1,346 | 7,648 | |||
Commercial loans: | ||||||
Commercial real estate | 3,191,669 | 3,257,955 | 3,246,533 | |||
Commercial and industrial | 1,695,031 | 1,675,316 | 1,774,358 | |||
Commercial construction | 410,425 | 398,592 | 478,153 | |||
Total Commercial Loans | 5,297,125 | 5,331,863 | 5,499,044 | |||
Consumer loans: | ||||||
Residential mortgage | 975,109 | 912,531 | 859,329 | |||
Home equity | 611,893 | 581,821 | 547,658 | |||
Installment and other consumer | 119,938 | 112,297 | 88,210 | |||
Consumer construction | 36,829 | 25,399 | 13,110 | |||
Total Consumer Loans | 1,743,769 | 1,632,048 | 1,508,307 | |||
Total Portfolio Loans | 7,040,894 | 6,963,911 | 7,007,351 | |||
Allowance for credit losses | (98,095) | (99,915) | (109,636) | |||
Total Portfolio Loans, Net | 6,942,799 | 6,863,996 | 6,897,715 | |||
Federal Home Loan Bank and other restricted stock, at cost | 7,949 | 9,349 | 10,106 | |||
Goodwill | 373,424 | 373,424 | 373,424 | |||
Other assets | 365,061 | 332,191 | 381,286 | |||
Total Assets | $9,103,814 | $9,432,281 | $9,495,832 | |||
LIABILITIES | ||||||
Deposits: | ||||||
Noninterest-bearing demand | $2,736,849 | $2,740,315 | $2,668,833 | |||
Interest-bearing demand | 880,432 | 1,070,656 | 979,300 | |||
Money market | 1,888,506 | 1,992,916 | 2,047,254 | |||
Savings | 1,125,344 | 1,117,985 | 1,050,256 | |||
Certificates of deposit | 981,116 | 1,038,586 | 1,269,621 | |||
Total Deposits | 7,612,247 | 7,960,458 | 8,015,264 | |||
Borrowings: | ||||||
Securities sold under repurchase agreements | 39,259 | 70,112 | 68,587 | |||
Long-term borrowings | 21,988 | 22,171 | 22,969 | |||
Junior subordinated debt securities | 54,423 | 54,408 | 64,113 | |||
Total Borrowings | 115,670 | 146,691 | 155,669 | |||
Other liabilities | 197,539 | 140,182 | 136,166 | |||
Total Liabilities | 7,925,456 | 8,247,331 | 8,307,099 | |||
SHAREHOLDERS' EQUITY | ||||||
Total Shareholders' Equity | 1,178,358 | 1,184,950 | 1,188,733 | |||
Total Liabilities and Shareholders' Equity | $9,103,814 | $9,432,281 | $9,495,832 | |||
Capitalization Ratios | ||||||
Shareholders' equity / assets | 12.94 % | 12.56 % | 12.52 % | |||
Tangible common equity / tangible assets(9) | 9.17 % | 8.91 % | 8.88 % | |||
Tier 1 leverage ratio | 10.25 % | 9.85 % | 9.52 % | |||
Common equity tier 1 capital | 12.34 % | 12.26 % | 11.98 % | |||
Risk-based capital - tier 1 | 12.74 % | 12.67 % | 12.40 % | |||
Risk-based capital - total | 14.23 % | 14.18 % | 14.00 % | |||
S&T Bancorp, Inc. | |||||||
Consolidated Selected Financial Data | |||||||
Unaudited | |||||||
2022 | 2022 | 2021 | |||||
Second | First | Second | |||||
(dollars in thousands) | Quarter | Quarter | Quarter | ||||
Net Interest Margin (FTE) (QTD Averages) | |||||||
ASSETS | |||||||
Interest-bearing deposits with banks | $528,413 | 0.78 % | $756,141 | 0.16 % | $785,465 | 0.09 % | |
Securities, at fair value | 1,024,106 | 2.19 % | 1,002,212 | 2.10 % | 826,861 | 2.19 % | |
Loans held for sale | 1,406 | 3.95 % | 1,545 | 3.51 % | 4,353 | 3.01 % | |
Commercial real estate | 3,197,406 | 4.14 % | 3,257,238 | 3.65 % | 3,251,894 | 3.69 % | |
Commercial and industrial | 1,685,728 | 4.31 % | 1,712,865 | 3.98 % | 1,890,538 | 3.90 % | |
Commercial construction | 404,856 | 3.78 % | 409,264 | 3.30 % | 462,928 | 3.34 % | |
Total Commercial Loans | 5,287,990 | 4.16 % | 5,379,367 | 3.73 % | 5,605,359 | 3.73 % | |
Residential mortgage | 939,756 | 3.98 % | 896,268 | 4.02 % | 863,254 | 4.17 % | |
Home equity | 594,529 | 3.56 % | 570,781 | 3.43 % | 535,933 | 3.50 % | |
Installment and other consumer | 119,041 | 5.36 % | 109,972 | 5.44 % | 84,259 | 6.05 % | |
Consumer construction | 31,204 | 3.36 % | 21,833 | 3.37 % | 13,264 | 6.39 % | |
Total Consumer Loans | 1,684,530 | 3.92 % | 1,598,854 | 3.90 % | 1,496,710 | 4.06 % | |
Total Portfolio Loans | 6,972,520 | 4.11 % | 6,978,221 | 3.77 % | 7,102,069 | 3.80 % | |
Total Loans | 6,973,926 | 4.11 % | 6,979,765 | 3.77 % | 7,106,422 | 3.80 % | |
Federal Home Loan Bank and other restricted stock | 8,939 | 3.69 % | 9,280 | 3.40 % | 10,529 | 4.51 % | |
Total Interest-earning Assets | 8,535,384 | 3.67 % | 8,747,398 | 3.27 % | 8,729,277 | 3.31 % | |
Noninterest-earning assets | 690,207 | 709,246 | 704,635 | ||||
Total Assets | $9,225,591 | $9,456,644 | $9,433,911 | ||||
LIABILITIES AND SHAREHOLDERS' EQUITY | |||||||
Interest-bearing demand | $979,514 | 0.07 % | $986,639 | 0.08 % | $998,134 | 0.09 % | |
Money market | 1,930,852 | 0.15 % | 2,055,857 | 0.15 % | 2,037,976 | 0.18 % | |
Savings | 1,118,346 | 0.05 % | 1,109,048 | 0.03 % | 1,044,899 | 0.03 % | |
Certificates of deposit | 1,001,775 | 0.31 % | 1,070,189 | 0.32 % | 1,291,194 | 0.45 % | |
Total Interest-bearing Deposits | 5,030,487 | 0.14 % | 5,221,733 | 0.14 % | 5,372,203 | 0.20 % | |
Securities sold under repurchase agreements | 50,037 | 0.10 % | 81,790 | 0.10 % | 67,838 | 0.10 % | |
Long-term borrowings | 22,072 | 2.01 % | 22,310 | 1.95 % | 23,113 | 2.01 % | |
Junior subordinated debt securities | 54,413 | 3.62 % | 54,398 | 2.95 % | 64,103 | 3.06 % | |
Total Borrowings | 126,522 | 1.95 % | 158,498 | 1.34 % | 155,054 | 1.61 % | |
Total Interest-bearing Liabilities | 5,157,009 | 0.19 % | 5,380,231 | 0.18 % | 5,527,256 | 0.24 % | |
Noninterest-bearing liabilities | 2,891,032 | 2,879,718 | 2,727,653 | ||||
Shareholders' equity | 1,177,550 | 1,196,694 | 1,179,002 | ||||
Total Liabilities and Shareholders' Equity | $9,225,591 | $9,456,644 | $9,433,911 | ||||
Net Interest Margin(10) | 3.56 % | 3.16 % | 3.16 % | ||||
S&T Bancorp, Inc. | |||||||
Consolidated Selected Financial Data | |||||||
Unaudited | |||||||
Six Months Ended June 30, | |||||||
(dollars in thousands) | 2022 | 2021 | |||||
Net Interest Margin (FTE) (YTD Averages) | |||||||
ASSETS | |||||||
Interest-bearing deposits with banks | $641,648 | 0.42 % | $545,177 | 0.09 % | |||
Securities, at fair value | 1,013,219 | 2.14 % | 804,613 | 2.26 % | |||
Loans held for sale | 1,475 | 3.72 % | 5,351 | 2.90 % | |||
Commercial real estate | 3,227,156 | 3.89 % | 3,252,763 | 3.72 % | |||
Commercial and industrial | 1,699,222 | 4.15 % | 1,923,813 | 4.10 % | |||
Commercial construction | 407,048 | 3.54 % | 474,037 | 3.36 % | |||
Total Commercial Loans | 5,333,426 | 3.95 % | 5,650,613 | 3.82 % | |||
Residential mortgage | 918,132 | 4.00 % | 880,246 | 4.20 % | |||
Home equity | 582,721 | 3.50 % | 534,329 | 3.58 % | |||
Installment and other consumer | 114,531 | 5.40 % | 82,095 | 6.19 % | |||
Consumer construction | 26,544 | 3.36 % | 14,578 | 5.52 % | |||
Total Consumer Loans | 1,641,928 | 3.91 % | 1,511,249 | 4.10 % | |||
Total Portfolio Loans | 6,975,354 | 3.94 % | 7,161,862 | 3.88 % | |||
Total Loans | 6,976,829 | 3.94 % | 7,167,213 | 3.88 % | |||
Federal Home Loan Bank and other restricted stock | 9,108 | 3.54 % | 10,884 | 4.73 % | |||
Total Interest-earning Assets | 8,640,804 | 3.47 % | 8,527,887 | 3.49 % | |||
Noninterest-earning assets | 699,097 | 730,117 | |||||
Total Assets | $9,339,901 | $9,258,003 | |||||
LIABILITIES AND SHAREHOLDERS' EQUITY | |||||||
Interest-bearing demand | $983,057 | 0.07 % | $947,295 | 0.10 % | |||
Money market | 1,993,009 | 0.15 % | 2,003,569 | 0.18 % | |||
Savings | 1,113,723 | 0.04 % | 1,020,201 | 0.04 % | |||
Certificates of deposit | 1,035,793 | 0.32 % | 1,317,751 | 0.55 % | |||
Total Interest-bearing deposits | 5,125,582 | 0.14 % | 5,288,816 | 0.23 % | |||
Securities sold under repurchase agreements | 65,826 | 0.10 % | 66,254 | 0.13 % | |||
Short-term borrowings | — | — % | 12,707 | 0.19 % | |||
Long-term borrowings | 22,190 | 1.98 % | 23,291 | 2.01 % | |||
Junior subordinated debt securities | 54,406 | 3.29 % | 64,095 | 3.07 % | |||
Total Borrowings | 142,422 | 1.61 % | 166,348 | 1.53 % | |||
Total Interest-bearing Liabilities | 5,268,004 | 0.18 % | 5,455,164 | 0.27 % | |||
Noninterest-bearing liabilities | 2,884,828 | 2,633,219 | |||||
Shareholders' equity | 1,187,069 | 1,169,620 | |||||
Total Liabilities and Shareholders' Equity | $9,339,901 | $9,258,003 | |||||
Net Interest Margin(8) | 3.35 % | 3.31 % | |||||
S&T Bancorp, Inc. | |||||||
Consolidated Selected Financial Data | |||||||
Unaudited | |||||||
2022 | 2022 | 2021 | |||||
Second | First | Second | |||||
(dollars in thousands) | Quarter | Quarter | Quarter | ||||
Nonperforming Loans (NPL) | |||||||
Commercial loans: | % NPL | % NPL | % NPL | ||||
Commercial real estate | $15,783 | 0.49 % | $26,699 | 0.82 % | $82,050 | 2.53 % | |
Commercial and industrial | 4,454 | 0.26 % | 14,673 | 0.90 % | 16,997 | 0.96 % | |
Commercial construction | 864 | 0.21 % | 864 | 0.22 % | 384 | 0.08 % | |
Total Nonperforming Commercial Loans | 21,101 | 0.40 % | 42,236 | 0.79 % | 99,431 | 1.81 % | |
Consumer loans: | |||||||
Residential mortgage | 8,137 | 0.83 % | 7,450 | 0.82 % | 9,917 | 1.15 % | |
Home equity | 2,281 | 0.37 % | 2,713 | 0.47 % | 3,150 | 0.58 % | |
Installment and other consumer | 256 | 0.21 % | 125 | 0.11 % | 121 | 0.14 % | |
Total Nonperforming Consumer Loans | 10,674 | 0.61 % | 10,287 | 0.63 % | 13,188 | 0.87 % | |
Total Nonperforming Loans | $31,775 | 0.45 % | $52,524 | 0.75 % | $112,619 | 1.61 % | |
2022 | 2022 | 2021 | ||||
Second | First | Second | ||||
(dollars in thousands) | Quarter | Quarter | Quarter | |||
Loan Charge-offs (Recoveries) | ||||||
Charge-offs | $7,678 | $982 | $8,737 | |||
Recoveries | (4,666) | (3,019) | (1,264) | |||
Net Loan Charge-offs (Recoveries) | $3,012 | ($2,037) | $7,473 | |||
Net Loan Charge-offs (Recoveries) | ||||||
Commercial loans: | ||||||
Commercial real estate | ($125) | $178 | $6,595 | |||
Commercial and industrial | 2,712 | (2,507) | 795 | |||
Commercial construction | — | (1) | (2) | |||
Total Commercial Loan Charge-offs (Recoveries) | 2,587 | (2,330) | 7,388 | |||
Consumer loans: | ||||||
Residential mortgage | 13 | 81 | (57) | |||
Home equity | 6 | (20) | 10 | |||
Installment and other consumer | 406 | 232 | 132 | |||
Total Consumer Loan Charge-offs | 425 | 293 | 85 | |||
Total Net Loan Charge-offs (Recoveries) | $3,012 | ($2,037) | $7,473 |
Six Months Ended June 30, | ||||||
(dollars in thousands) | 2022 | 2021 | ||||
Loan Charge-offs (Recoveries) | ||||||
Charge-offs | $8,661 | $15,270 | ||||
Recoveries | (7,685) | (1,985) | ||||
Net Loan Charge-offs | $976 | $13,285 | ||||
Net Loan Charge-offs | ||||||
Commercial loans: | ||||||
Commercial real estate | $52 | $7,293 | ||||
Commercial and industrial | 205 | 5,708 | ||||
Commercial construction | (1) | (3) | ||||
Total Commercial Loan Charge-offs | 256 | 12,998 | ||||
Consumer loans: | ||||||
Residential mortgage | 94 | 15 | ||||
Home equity | (14) | 242 | ||||
Installment and other consumer | 640 | 30 | ||||
Total Consumer Loan Charge-offs | 720 | 287 | ||||
Total Net Loan Charge-offs | $976 | $13,285 | ||||
S&T Bancorp, Inc. | ||||||
Consolidated Selected Financial Data | ||||||
Unaudited | ||||||
2022 | 2022 | 2021 | ||||
Second | First | Second | ||||
(dollars in thousands) | Quarter | Quarter | Quarter | |||
Asset Quality Data | ||||||
Nonperforming loans | $31,775 | $52,524 | $112,619 | |||
OREO | 7,046 | 7,028 | 1,145 | |||
Total nonperforming assets | 38,821 | 59,552 | 113,764 | |||
Troubled debt restructurings (nonaccruing) | 4,010 | 15,389 | 20,650 | |||
Troubled debt restructurings (accruing) | 9,338 | 10,739 | 14,321 | |||
Total troubled debt restructurings | 13,348 | 26,128 | 34,971 | |||
Nonperforming loans / total loans | 0.45 % | 0.75 % | 1.61 % | |||
Nonperforming assets / total loans plus OREO | 0.55 % | 0.85 % | 1.62 % | |||
Allowance for credit losses / total portfolio loans | 1.39 % | 1.43 % | 1.56 % | |||
Allowance for credit losses / total portfolio loans excluding PPP | 1.40 % | 1.44 % | 1.64 % | |||
Allowance for credit losses / nonperforming loans | 309 % | 190 % | 97 % | |||
Net loan charge-offs (recoveries) | $3,012 | ($2,037) | $7,473 | |||
Net loan charge-offs (recoveries) (annualized) / average loans | 0.17 % | (0.12 %) | 0.43 % | |||
Six Months Ended June 30, | ||||||
(dollars in thousands) | 2022 | 2021 | ||||
Asset Quality Data | ||||||
Net loan charge-offs | $976 | $13,285 | ||||
Net loan charge-offs (annualized) / average loans | 0.03 % | 0.37 % | ||||
S&T Bancorp, Inc. | ||||||
Consolidated Selected Financial Data | ||||||
Unaudited | ||||||
Definitions and Reconciliation of GAAP to Non-GAAP Financial Measures: | ||||||
2022 | 2022 | 2021 | ||||
Second | First | Second | ||||
(dollars in thousands) | Quarter | Quarter | Quarter | |||
(1) Tangible Book Value (non-GAAP) | ||||||
Total shareholders' equity | $1,178,358 | $1,184,950 | $1,188,733 | |||
Less: goodwill and other intangible assets, net of deferred tax | (378,259) | (378,557) | (379,563) | |||
Tangible common equity (non-GAAP) | $800,099 | $806,393 | $809,170 | |||
Common shares outstanding | 39,149 | 39,352 | 39,346 | |||
Tangible book value (non-GAAP) | $20.44 | $20.49 | $20.57 | |||
(2) Return on Average Tangible Shareholders' Equity (non-GAAP) | ||||||
Net income (annualized) | $115,750 | $118,192 | $113,778 | |||
Plus: amortization of intangibles (annualized), net of tax | 1,197 | 1,276 | 1,395 | |||
Net income before amortization of intangibles (annualized) | $116,947 | $119,468 | $115,173 | |||
Average total shareholders' equity | $1,177,550 | $1,196,694 | $1,179,002 | |||
Less: average goodwill and other intangible assets, net of deferred | (378,453) | (378,761) | (379,784) | |||
Average tangible equity (non-GAAP) | $799,097 | $817,932 | $799,218 | |||
Return on average tangible shareholders' equity (non-GAAP) | 14.63 % | 14.61 % | 14.41 % | |||
(3) PPNR / Average Assets (non-GAAP) | ||||||
Income before taxes | $36,196 | $36,057 | $35,338 | |||
Plus: Provision for credit losses | 3,204 | (512) | 2,561 | |||
Total | $39,400 | $35,545 | $37,899 | |||
Total (annualized) (non-GAAP) | $158,034 | $144,155 | $152,012 | |||
Average assets | $9,225,591 | $9,456,644 | $9,433,911 | |||
PPNR / Average Assets (non-GAAP) | 1.71 % | 1.52 % | 1.61 % | |||
(4) Efficiency Ratio (non-GAAP) | ||||||
Noninterest expense | $48,424 | $47,414 | $45,829 | |||
Net interest income per consolidated statements of net income | 75,194 | 67,733 | 68,304 | |||
Plus: taxable equivalent adjustment | 506 | 493 | 585 | |||
Net interest income (FTE) (non-GAAP) | $75,700 | $68,226 | $68,889 | |||
Noninterest income | 12,630 | 15,226 | 15,424 | |||
Less: net gains on sale of securities | — | — | (29) | |||
Net interest income (FTE) (non-GAAP) plus noninterest income | $88,330 | $83,452 | $84,284 | |||
Efficiency ratio (non-GAAP) | 54.82 % | 56.82 % | 54.37 % | |||
S&T Bancorp, Inc. | ||||||||
Consolidated Selected Financial Data | ||||||||
Unaudited | ||||||||
Six Months Ended June 30, | ||||||||
(dollars in thousands) | 2022 | 2021 | ||||||
(5) Return on Average Tangible Shareholders' Equity (non-GAAP) | ||||||||
Net income (annualized) | $116,964 | $121,535 | ||||||
Plus: amortization of intangibles (annualized), net of tax | 1,236 | 1,429 | ||||||
Net income before amortization of intangibles (annualized) | $118,200 | $122,964 | ||||||
Average total shareholders' equity | $1,187,069 | $1,169,620 | ||||||
Less: average goodwill and other intangible assets, net of deferred | (378,606) | (379,963) | ||||||
Average tangible equity (non-GAAP) | $808,463 | $789,657 | ||||||
Return on average tangible shareholders' equity (non-GAAP) | 14.62 % | 15.57 % | ||||||
(6) PPNR / Average Assets (non-GAAP) | ||||||||
Income before taxes | $72,253 | $74,515 | ||||||
Plus: Provision for credit losses | 2,692 | 5,699 | ||||||
Total | $74,945 | $80,214 | ||||||
Total (annualized) (non-GAAP) | $151,132 | $161,758 | ||||||
Average assets | $9,339,901 | $9,258,003 | ||||||
PPNR / Average Assets (non-GAAP) | 1.62 % | 1.75 % | ||||||
(7) Efficiency Ratio (non-GAAP) | ||||||||
Noninterest expense | $95,838 | $91,495 | ||||||
Net interest income per consolidated statements of net income | 142,927 | 138,962 | ||||||
Plus: taxable equivalent adjustment | 999 | 1,249 | ||||||
Net interest income (FTE) (non-GAAP) | $143,926 | $140,211 | ||||||
Noninterest income | 27,856 | 32,747 | ||||||
Less: net gains on sale of securities | — | (29) | ||||||
Net interest income (FTE) (non-GAAP) plus noninterest income | $171,782 | $172,929 | ||||||
Efficiency ratio (non-GAAP) | 55.79 % | 52.91 % | ||||||
(8) Net Interest Margin Rate (FTE) (non-GAAP) | ||||||||
Interest income and dividend income | $147,708 | $146,358 | ||||||
Less: interest expense | (4,781) | (7,396) | ||||||
Net interest income per consolidated statements of net income | $142,927 | $138,962 | ||||||
Plus: taxable equivalent adjustment | 999 | 1,249 | ||||||
Net interest income (FTE) (non-GAAP) | $143,926 | $140,211 | ||||||
Net interest income (FTE) (annualized) | $290,236 | $282,746 | ||||||
Average interest-earning assets | $8,640,804 | $8,527,887 | ||||||
Net interest margin - (FTE) (non-GAAP) | 3.35 % | 3.31 % | ||||||
S&T Bancorp, Inc. | ||||||
Consolidated Selected Financial Data | ||||||
Unaudited | ||||||
Definitions and Reconciliation of GAAP to Non-GAAP Financial Measures: | ||||||
2022 | 2022 | 2021 | ||||
Second | First | Second | ||||
(dollars in thousands) | Quarter | Quarter | Quarter | |||
(9) Tangible Common Equity / Tangible Assets (non-GAAP) | ||||||
Total shareholders' equity | $1,178,358 | $1,184,950 | $1,188,733 | |||
Less: goodwill and other intangible assets, net of deferred tax liability | (378,259) | (378,557) | (379,563) | |||
Tangible common equity (non-GAAP) | $800,099 | $806,393 | $809,170 | |||
Total assets | $9,103,814 | $9,432,281 | $9,495,832 | |||
Less: goodwill and other intangible assets, net of deferred tax liability | (378,259) | (378,557) | (379,563) | |||
Tangible assets (non-GAAP) | $8,725,556 | $9,053,724 | $9,116,268 | |||
Tangible common equity to tangible assets (non-GAAP) | 9.17 % | 8.91 % | 8.88 % | |||
(10) Net Interest Margin Rate (FTE) (non-GAAP) | ||||||
Interest income and dividend income | $77,599 | $70,109 | $71,577 | |||
Less: interest expense | (2,405) | (2,376) | (3,273) | |||
Net interest income per consolidated statements of net income | $75,194 | $67,733 | $68,304 | |||
Plus: taxable equivalent adjustment | 506 | 493 | 585 | |||
Net interest income (FTE) (non-GAAP) | $75,700 | $68,226 | $68,889 | |||
Net interest income (FTE) (annualized) | $303,633 | $276,694 | $276,313 | |||
Average interest- earning assets | $8,535,384 | $8,747,398 | $8,729,277 | |||
Net interest margin (FTE) (non-GAAP) | 3.56 % | 3.16 % | 3.16 % | |||
View original content to download multimedia:https://www.prnewswire.com/news-releases/st-bancorp-inc-announces-second-quarter-2022-net-income-301590601.html
SOURCE S&T Bancorp, Inc.
Spread & Containment
There Goes The Fed’s Inflation Target: Goldman Sees Terminal Rate 100bps Higher At 3.5%
There Goes The Fed’s Inflation Target: Goldman Sees Terminal Rate 100bps Higher At 3.5%
Two years ago, we first said that it’s only a matter…
Share this:

Two years ago, we first said that it's only a matter of time before the Fed admits it is unable to rsolve the so-called "last mile" of inflation and that as a result, the old inflation target of 2% is no longer viable.
At some point Fed will concede it has no control over supply. That's when we will start getting leaks of raising the inflation target
— zerohedge (@zerohedge) June 21, 2022
Then one year ago, we correctly said that while everyone was paying attention elsewhere, the inflation target had already been hiked to 2.8%... on the way to even more increases.
The new inflation target has been set to 2.8%. The rest is just narrative fill for the next 2 years. https://t.co/X1xYkecyPy
— zerohedge (@zerohedge) February 21, 2023
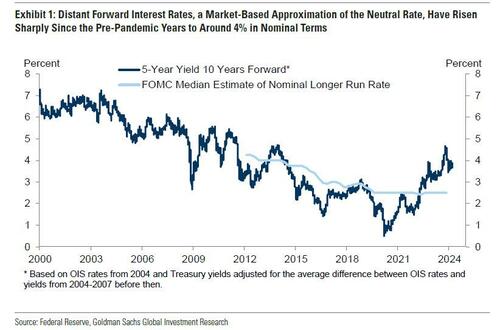
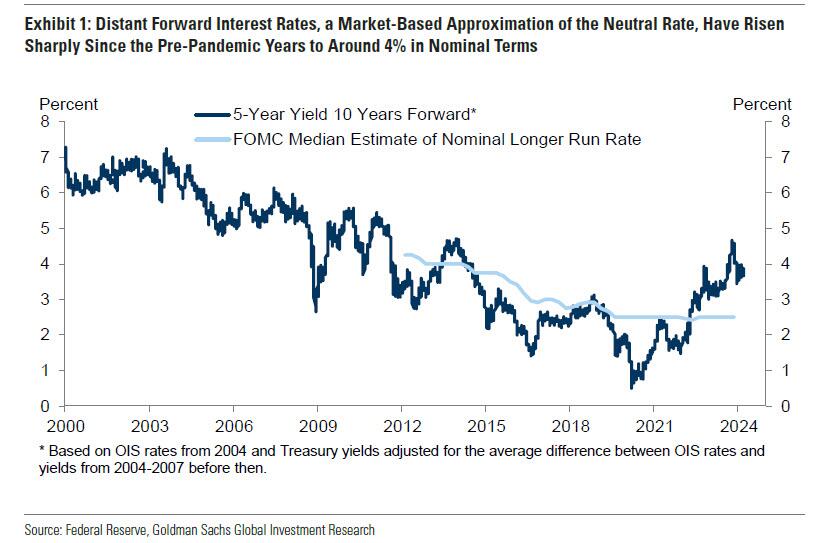
And while the Fed still pretends it can one day lower inflation to 2% even as it prepares to cut rates as soon as June, moments ago Goldman published a note from its economics team which had to balls to finally call a spade a spade, and concluded that - as party of the Fed's next big debate, i.e., rethinking the Neutral rate - both the neutral and terminal rate, a polite euphemism for the inflation target, are much higher than conventional wisdom believes, and that as a result Goldman is "penciling in a terminal rate of 3.25-3.5% this cycle, 100bp above the peak reached last cycle."
There is more in the full Goldman note, but below we excerpt the key fragments:
We argued last cycle that the long-run neutral rate was not as low as widely thought, perhaps closer to 3-3.5% in nominal terms than to 2-2.5%. We have also argued this cycle that the short-run neutral rate could be higher still because the fiscal deficit is much larger than usual—in fact, estimates of the elasticity of the neutral rate to the deficit suggest that the wider deficit might boost the short-term neutral rate by 1-1.5%. Fed economists have also offered another reason why the short-term neutral rate might be elevated, namely that broad financial conditions have not tightened commensurately with the rise in the funds rate, limiting transmission to the economy.
Over the coming year, Fed officials are likely to debate whether the neutral rate is still as low as they assumed last cycle and as the dot plot implies....
...Translation: raising the neutral rate estimate is also the first step to admitting that the traditional 2% inflation target is higher than previously expected. And once the Fed officially crosses that particular Rubicon, all bets are off.
... Their thinking is likely to be influenced by distant forward market rates, which have risen 1-2pp since the pre-pandemic years to about 4%; by model-based estimates of neutral, whose earlier real-time values have been revised up by roughly 0.5pp on average to about 3.5% nominal and whose latest values are little changed; and by their perception of how well the economy is performing at the current level of the funds rate.
The bank's conclusion:
We expect Fed officials to raise their estimates of neutral over time both by raising their long-run neutral rate dots somewhat and by concluding that short-run neutral is currently higher than long-run neutral. While we are fairly confident that Fed officials will not be comfortable leaving the funds rate above 5% indefinitely once inflation approaches 2% and that they will not go all the way back to 2.5% purely in the name of normalization, we are quite uncertain about where in between they will ultimately land.
Because the economy is not sensitive enough to small changes in the funds rate to make it glaringly obvious when neutral has been reached, the terminal or equilibrium rate where the FOMC decides to leave the funds rate is partly a matter of the true neutral rate and partly a matter of the perceived neutral rate. For now, we are penciling in a terminal rate of 3.25-3.5% this cycle, 100bps above the peak reached last cycle. This reflects both our view that neutral is higher than Fed officials think and our expectation that their thinking will evolve.
Not that this should come as a surprise: as a reminder, with the US now $35.5 trillion in debt and rising by $1 trillion every 100 days, we are fast approaching the Minsky Moment, which means the US has just a handful of options left: losing the reserve currency status, QEing the deficit and every new dollar in debt, or - the only viable alternative - inflating it all away. The only question we had before is when do "serious" economists make the same admission.
Meanwhile, nothing changes: total US debt jumps $57BN on March 15, to a record $34.543 trillion.
— zerohedge (@zerohedge) March 19, 2024
Three ways this ends: inflate it away, QE it all, or reserve status collapse
They now have.
And while we have discussed the staggering consequences of raising the inflation target by just 1% from 2% to 3% on everything from markets, to economic growth (instead of doubling every 35 years at 2% inflation target, prices would double every 23 years at 3%), and social cohesion, we will soon rerun the analysis again as the implications are profound. For now all you need to know is that with the US about to implicitly hit the overdrive of dollar devaluation, anything that is non-fiat will be much more preferable over fiat alternatives.
Much more in the full Goldman note available to pro subs in the usual place.
Spread & Containment
Household Net Interest Income Falls As Rates Spike
A Bloomberg article from this morning offered an excellent array of charts detailing the shifts in interest payment flows amid rising rates. The historical…
Share this:

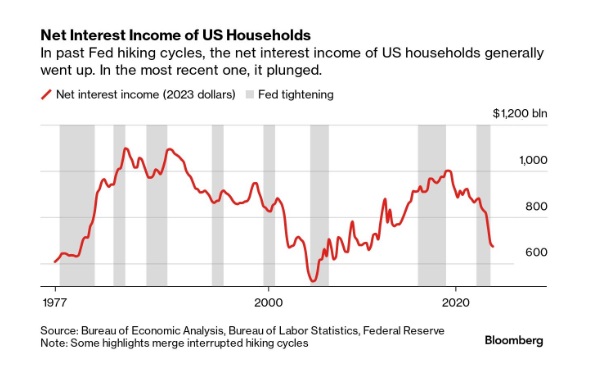
A Bloomberg article from this morning offered an excellent array of charts detailing the shifts in interest payment flows amid rising rates. The historical anomaly was both surprising and contradicted our priors.
10 Key Points:
- Historical Anomaly: This is the first time in the last fifty years that a Federal Reserve rate hike cycle has led to a significant drop in household net interest income.
- Interest Expense Increase: Since the Fed began raising rates in March 2022, Americans’ annual interest expenses on debts like mortgages and credit cards have surged by nearly $420 billion.
- Interest Income Lag: The increase in interest income during the same period was only about $280 billion, resulting in a net decline in household interest income, a departure from past trends.
- Consumer Debt Influence: The recent rate hikes impacted household finances more because of a higher proportion of consumer credit, which adjusts more quickly to rate changes, increasing interest costs.
- Banks and Savers: Banks have been slow to pass on higher interest rates to depositors, and the prolonged period of low rates before 2022 may have discouraged savers from actively seeking better returns.
- Shift in Wealth: There’s been a shift from interest-bearing assets to stocks, with dividends surpassing interest payments as a source of unearned income during the pandemic.
- Distributional Discrepancy: Higher interest rates benefit wealthier individuals who own interest-earning assets, whereas lower-income earners face the brunt of increased debt servicing costs, exacerbating economic inequality.
- Job Market Impact: Typically, Fed rate hikes affect households through the job market, as businesses cut costs, potentially leading to layoffs or wage suppression, though this hasn’t occurred yet in the current cycle.
- Economic Impact: The distribution of interest income and debt servicing means that rate increases transfer money from those more likely to spend (and thus stimulate the economy) to those less likely to increase consumption, potentially dampening economic activity.
- No Immediate Relief: Expectations for the Fed to reduce rates have diminished, indicating that high-interest expenses for households may persist.


Uncategorized
One more airline cracks down on lounge crowding in a way you won’t like
Qantas Airways is increasing the price of accessing its network of lounges by as much as 17%.
Share this:


Over the last two years, multiple airlines have dealt with crowding in their lounges. While they are designed as a luxury experience for a small subset of travelers, high numbers of people taking a trip post-pandemic as well as the different ways they are able to gain access through status or certain credit cards made it difficult for some airlines to keep up with keeping foods stocked, common areas clean and having enough staff to serve bar drinks at the rate that customers expect them.
In the fall of 2023, Delta Air Lines (DAL) caught serious traveler outcry after announcing that it was cracking down on crowding by raising how much one needs to spend for lounge access and limiting the number of times one can enter those lounges.
Related: Competitors pushed Delta to backtrack on its lounge and loyalty program changes
Some airlines saw the outcry with Delta as their chance to reassure customers that they would not raise their fees while others waited for the storm to pass to quietly implement their own increases.
Shutterstock
This is how much more you'll have to pay for Qantas lounge access
Australia's flagship carrier Qantas Airways (QUBSF) is the latest airline to announce that it would raise the cost accessing the 24 lounges across the country as well as the 600 international lounges available at airports across the world through partner airlines.
More Travel:
- A new travel term is taking over the internet (and reaching airlines and hotels)
- The 10 best airline stocks to buy now
- Airlines see a new kind of traveler at the front of the plane
Unlike other airlines which grant access primarily after reaching frequent flyer status, Qantas also sells it through a membership — starting from April 18, 2024, prices will rise from $600 Australian dollars ($392 USD) to $699 AUD ($456 USD) for one year, $1,100 ($718 USD) to $1,299 ($848 USD) for two years and $2,000 AUD ($1,304) to lock in the rate for four years.
Those signing up for lounge access for the first time also currently pay a joining fee of $99 AUD ($65 USD) that will rise to $129 AUD ($85 USD).
The airline also allows customers to purchase their membership with Qantas Points they collect through frequent travel; the membership fees are also being raised by the equivalent amount in points in what adds up to as much as 17% — from 308,000 to 399,900 to lock in access for four years.
Airline says hikes will 'cover cost increases passed on from suppliers'
"This is the first time the Qantas Club membership fees have increased in seven years and will help cover cost increases passed on from a range of suppliers over that time," a Qantas spokesperson confirmed to Simple Flying. "This follows a reduction in the membership fees for several years during the pandemic."
The spokesperson said the gains from the increases will go both towards making up for inflation-related costs and keeping existing lounges looking modern by updating features like furniture and décor.
While the price increases also do not apply for those who earned lounge access through frequent flyer status or change what it takes to earn that status, Qantas is also introducing even steeper increases for those renewing a membership or adding additional features such as spouse and partner memberships.
In some cases, the cost of these features will nearly double from what members are paying now.
stocks pandemic

Google’s A.I. Fiasco Exposes Deeper Infowarp


Home buyers must now navigate higher mortgage rates and prices


Supreme Court Rules Public Officials May Block Their Constituents On Social Media


Greenback Surges after BOJ Hikes and Ends YCC and RBA Delivers a Dovish Hold


Manufacturing and construction vs. the still-inverted yield curve


When words make you sick


Student loan borrowers may finally get answers to loan forgiveness issues


You can strike gold and silver investment opportunities at Costco


Bolsonaro Indicted By Brazilian Police For Falsifying Covid-19 Vaccine Records


Germany Is Running Out Of Money And Debt Levels Are Exploding, Finance Minister Warns
-

 Spread & Containment6 days ago
IFM’s Hat Trick and Reflections On Option-To-Buy M&A
-

 Uncategorized4 weeks ago
All Of The Elements Are In Place For An Economic Crisis Of Staggering Proportions
-

 International2 weeks ago
EyePoint poaches medical chief from Apellis; Sandoz CFO, longtime BioNTech exec to retire
-

 Uncategorized1 month ago
California Counties Could Be Forced To Pay $300 Million To Cover COVID-Era Program
-

 Uncategorized4 weeks ago
Apparel Retailer Express Moving Toward Bankruptcy
-

 Uncategorized1 month ago
Industrial Production Decreased 0.1% in January
-

 International2 weeks ago
Walmart launches clever answer to Target’s new membership program
-

 Uncategorized1 month ago
RFK Jr: The Wuhan Cover-Up & The Rise Of The Biowarfare-Industrial Complex