Uncategorized
Solar energy market in South Africa to grow at a CAGR of 29.74% from 2021 to 2026: Sunny climatic conditions to drive growth – Technavio
Solar energy market in South Africa to grow at a CAGR of 29.74% from 2021 to 2026: Sunny climatic conditions to drive growth – Technavio
PR Newswire
NEW YORK, March 27, 2023
NEW YORK, March 27, 2023 /PRNewswire/ — The size of the solar energy mark…
Share this:

Solar energy market in South Africa to grow at a CAGR of 29.74% from 2021 to 2026: Sunny climatic conditions to drive growth - Technavio
PR Newswire
NEW YORK, March 27, 2023
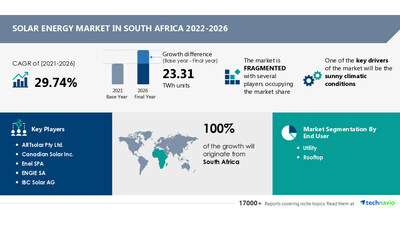
NEW YORK, March 27, 2023 /PRNewswire/ -- The size of the solar energy market in South Africa is estimated to increase by 23.31 terawatt-hour units from 2021 to 2026. The market's growth momentum will accelerate at a CAGR of 29.74%. Sunny climatic conditions are driving market growth. South Africa is located in a latitude zone with higher solar radiation than other regions or countries. Government policies and high investments in solar PV projects are expected to increase the installed solar PV capacity of the country in the coming years. Such factors are expected to impact market growth during the forecast period positively. However, the high initial investment and maintenance costs for solar PV systems are challenging market growth. The generation of solar energy requires a large area for solar panels. The efficiency of solar panels can reduce due to intermittency problems, which increases the initial investment and maintenance costs. This, in turn, leads to a significant burden on household users, which limits the use of solar panels and solar cover glass for residential purposes. Such factors are expected to hinder the solar energy market growth in South Africa during the forecast period. Discover some insights about the market before buying the full report - Request a sample report
Solar energy market in South Africa – Vendor analysis
Vendor Landscape –
The solar energy market in South Africa is fragmented, with the presence of numerous international and regional players. A few prominent vendors in the market are ARTsolar Pty Ltd., Canadian Solar Inc., Enel SPA, ENGIE SA, IBC Solar AG, JinkoSolar Holding Co. Ltd., Renenergy South Africa Pty Ltd., Jiangsu Seraphim Solar System Co. Ltd., SunPower Corp., and Trina Solar Co. Ltd.
The competition among vendors is moderate, and their growth is dependent on R&D and innovations. Frequent changes in government policies, continuous developments in technology, and environmental regulations are driving the growth of the solar market in South Africa. The declining prices of solar PV systems and stringent regulations related to carbon emissions will further attract investors.
Why buy?
- Add credibility to strategy
- Analyze competitor's offerings
- Get a holistic view of the market
Grow your profit margin with Technavio – Buy the report!
Vendor offerings -
- Canadian Solar Inc. - The company offers solar energy products under the BiHiKu7 brand. It offers solar modules, solar system kits, battery energy storage solutions, and other materials, components, and services.
- IBC Solar AG - The company offers solar energy products under the Longi brand.
- JinkoSolar Holding Co. Ltd - The company offers solar energy products under the Suntank brand.
- ARTsolar Pty Ltd. - The company offers solar energy products under the Alpha brand. It also manufactures crystalline solar panels.
- For details about vendors and their offerings – Request a sample report
Solar energy market in South Africa - Segmentation assessment
Segment overview
Technavio has segmented the market based on end-user (utility and rooftop) and application (grid-connected and off-grid).
- The utility segment will account for a significant share of the market growth during the forecast period. A large number of installations of large-scale solar power plants for the generation of clean energy and reduction of carbon emissions is driving the growth of this segment. The energy can also be stored in energy storage systems when there is no sunlight. Such factors will increase the adoption of utility-scale solar power in South Africa during the forecast period.
For insights on market segments - Download a sample report
Solar energy market in South Africa – Key trends
Scaling up renewables in transport will be a key trend in the solar energy market in South Africa. The country is focusing on carbon emission reduction and renewable energy to fulfill its energy requirements. For instance, Cape Town plans to procure only zero-emission vehicles by 2025. Its Electric Vehicle Framework includes leveraging EV roll-out and charging to increase the share of renewables. The city is considering mandating public EV charging stations to operate on renewable energy, which will require the electrification of transport systems. These factors, in turn, will accelerate the adoption of solar energy sources for power generation during the forecast period.
What are the key data covered in this report?
- CAGR of the market during the forecast period
- Detailed information about factors that will drive the growth of the solar energy market in South Africa between 2022 and 2026
- Precise estimation of the size of the solar energy market in South Africa and its contribution to the parent market
- Accurate predictions about upcoming trends and changes in consumer behavior
- A thorough analysis of the market's competitive landscape and detailed information about vendors
- Comprehensive analysis of factors that will challenge the growth vendors
Gain instant access to 17,000+ market research reports.
Technavio's SUBSCRIPTION platform
Related Reports:
The solar photovoltaic services (PV) market is estimated to grow at a CAGR of 15.38% between 2022 and 2027. The size of the market is forecast to increase by USD 16,359.62 million. This report extensively covers market segmentation by service (installation services and O&M services) and geography (APAC, Europe, North America, Middle East and Africa, and South America).
The solar thermal market size is estimated to increase by 16,7187.58 megawatts from 2021 to 2026, and the market's growth momentum will accelerate at a CAGR of 5.71%. This report extensively covers solar thermal market segmentation by application (heat generation and power generation) and geography (North America, APAC, Europe, Middle East and Africa, and South America).
Solar Energy Market Scope in South Africa | |
Report Coverage | Details |
Forecast period | 2022-2026 |
Growth momentum & CAGR | Accelerate at a CAGR of 29.74% |
Market growth 2022-2026 | 23.31 terawatt-hour units |
Market structure | Fragmented |
YoY growth 2021-2022 (%) | 24.80 |
Competitive landscape | Leading vendors, market positioning of vendors, competitive strategies, and industry risks |
Key companies profiled | ARTsolar Pty Ltd., Canadian Solar Inc., Enel SPA, ENGIE SA, IBC Solar AG, JinkoSolar Holding Co. Ltd., Renenergy South Africa Pty Ltd., Jiangsu Seraphim Solar System Co. Ltd., SunPower Corp., and Trina Solar Co. Ltd. |
Market dynamics | Parent market analysis, market growth inducers and obstacles, fast-growing and slow-growing segment analysis, COVID-19 impact and recovery analysis and future consumer dynamics, and market condition analysis for the forecast period |
Customization purview | If our report has not included the data that you are looking for, you can reach out to our analysts and get segments customized. |
Browse for Technavio utilities market reports
Table of contents
1. Executive Summary
1.1 Market Overview
Exhibit 01: Key Finding 1
Exhibit 02: Key Finding 2
Exhibit 03: Key Finding 5
Exhibit 04: Key Finding 6
Exhibit 05: Key Finding 7
2. Market Landscape
2.1 Market ecosystem
Exhibit 06: Parent market
Exhibit 07: Market characteristics
2.2 Value chain analysis
Exhibit 08: Value chain analysis: Renewable electricity
2.2.1 Inputs
2.2.2 Electricity generation
2.2.3 Electricity transmission
2.2.4 Electricity distribution
2.2.5 End-users
2.2.6 Innovations
3. Market Sizing
3.1 Market definition
Exhibit 09: Offerings of vendors included in the market definition
3.2 Market segment analysis
Exhibit 10: Market segments
3.3 Market size 2021
3.4 Market outlook: Forecast for 2021 - 2026
3.4.1 Estimating growth rates for emerging and high-growth markets
3.4.2 Estimating growth rates for mature markets
Exhibit 11: Global - Market size and forecast 2021 - 2026 (TWh)
Exhibit 12: Global market: Year-over-year growth 2021 - 2026 (%)
4. Five Forces Analysis
4.1 Five Forces Summary
Exhibit 13: Five forces analysis 2021 & 2026
4.2 Bargaining power of buyers
Exhibit 14: Bargaining power of buyers
4.3 Bargaining power of suppliers
Exhibit 15: Bargaining power of suppliers
4.4 Threat of new entrants
Exhibit 16: Threat of new entrants
4.5 Threat of substitutes
Exhibit 17: Threat of substitutes
4.6 Threat of rivalry
Exhibit 18: Threat of rivalry
4.7 Market condition
Exhibit 19: Market condition - Five forces 2021
5. Market Segmentation by Application
5.1 Market segments
The segments covered in this chapter are:
- Grid-connected
- Off-grid
Exhibit 20: Application - Market share 2021-2026 (%)
5.2 Comparison by Application
Exhibit 21: Comparison by Application
5.3 Grid-connected - Market size and forecast 2021-2026
Exhibit 22: Grid-connected - Market size and forecast 2021-2026 (TWh)
Exhibit 23: Grid-connected - Year-over-year growth 2021-2026 (%)
5.4 Off-grid - Market size and forecast 2021-2026
Exhibit 24: Off-grid - Market size and forecast 2021-2026 (TWh)
Exhibit 25: Off-grid - Year-over-year growth 2021-2026 (%)
5.5 Market opportunity by Application
Exhibit 26: Market opportunity by Application
6. Market Segmentation by End-user
6.1 Market segments
The segments covered in this chapter are:
- Utility
- Rooftop
Exhibit 27: End-user - Market share 2021-2026 (%)
6.2 Comparison by End-user
Exhibit 28: Comparison by End-user
6.3 Utility - Market size and forecast 2021-2026
Exhibit 29: Utility - Market size and forecast 2021-2026 (TWh)
Exhibit 30: Utility - Year-over-year growth 2021-2026 (%)
6.4 Rooftop - Market size and forecast 2021-2026
Exhibit 31: Rooftop - Market size and forecast 2021-2026 (TWh)
Exhibit 32: Rooftop - Year-over-year growth 2021-2026 (%)
6.5 Market opportunity by End-user
Exhibit 33: Market opportunity by End-user
7. Customer landscape
Technavio's customer landscape matrix comparing Drivers or price sensitivity, Adoption lifecycle, importance in customer price basket, Adoption rate and Key purchase criteria
7.1 Overview
Exhibit 34: Customer landscape
8. Drivers, Challenges, and Trends
8.1 Market drivers
8.1.1 Sunny climatic conditions
8.1.2 Rising adoption of renewable energy source
8.1.3 Rising government initiative
8.2 Market challenges
8.2.1 High initial investment and maintenance cost for solar PV systems
?8.2.2 Increasing number of alternative energy sources
8.2.3 Intermittency in solar power generation
Exhibit 35: Impact of drivers and challenges
8.3 Market trends
8.3.1 Scaling up renewables in transport
8.3.2 Declining cost of solar PV panels
8.3.3 Increasing adoption of microgrids
9. Vendor Landscape
9.1 Overview
Exhibit 36: Vendor landscape
9.2 Landscape disruption
Exhibit 37: Landscape disruption
Exhibit 38: Industry risks
10. Vendor Analysis
10.1 Vendors covered
Exhibit 44: Vendors covered
10.2 Market positioning of vendors
Exhibit 45: Market positioning of vendors
10.3 ARTsolar Pty Ltd.
Exhibit 41: ARTsolar Pty Ltd. - Overview
Exhibit 42: ARTsolar Pty Ltd. - Product and service
Exhibit 43: ARTsolar Pty Ltd. - Key offerings
10.4 Canadian Solar Inc.
Exhibit 44: Canadian Solar Inc. - Overview
Exhibit 45: Canadian Solar Inc. - Business segments
Exhibit 46: Canadian Solar Inc. - Key offerings
Exhibit 47: Canadian Solar Inc. - Segment focus
10.5 Enel SPA
Exhibit 48: Enel SPA - Overview
Exhibit 49: Enel SPA - Business segments
Exhibit 50: Enel SPA - Key offerings
10.6 ENGIE SA
Exhibit 51: ENGIE SA - Overview
Exhibit 52: ENGIE SA - Business segments
Exhibit 53: ENGIE SA - Key offerings
Exhibit 54: ENGIE SA - Segment focus
10.7 IBC Solar AG
Exhibit 55: IBC Solar AG - Overview
Exhibit 56: IBC Solar AG - Product and service
Exhibit 57: IBC Solar AG - Key offerings
10.8 Jiangsu Seraphim Solar System Co. Ltd.
Exhibit 58: Jiangsu Seraphim Solar System Co. Ltd. - Overview
Exhibit 59: Jiangsu Seraphim Solar System Co. Ltd. - Business segments
Exhibit 60: Jiangsu Seraphim Solar System Co. Ltd. - Key offerings
10.9 JinkoSolar Holding Co. Ltd.
Exhibit 61: JinkoSolar Holding Co. Ltd. - Overview
Exhibit 62: JinkoSolar Holding Co. Ltd. - Business segments
Exhibit 63: JinkoSolar Holding Co. Ltd. - Key offerings
10.10 Renenergy South Africa Pty Ltd.
Exhibit 64: Renenergy South Africa Pty Ltd. - Overview
Exhibit 65: Renenergy South Africa Pty Ltd. - Product and service
Exhibit 66: Renenergy South Africa Pty Ltd. - Key offerings
10.11 SunPower Corp.
Exhibit 67: SunPower Corp. - Overview
Exhibit 68: SunPower Corp. - Business segments
Exhibit 69: SunPower Corp. - Key offerings
Exhibit 70: SunPower Corp. - Segment focus
10.12 Trina Solar Co. Ltd.
Exhibit 71: Trina Solar Co. Ltd. - Overview
Exhibit 72: Trina Solar Co. Ltd. - Business segments
Exhibit 73: Trina Solar Co. Ltd. - Key offerings
Exhibit 74: Trina Solar Co. Ltd. - Segment focus
11. Appendix
11.1 Scope of the report
11.1.1 Market definition
11.1.2 Objectives
11.1.3 Notes and caveats
11.2 Currency conversion rates for US$
Exhibit 75: Currency conversion rates for US$
11.3 Research Methodology
Exhibit 76: Research Methodology
Exhibit 77: Validation techniques employed for market sizing
Exhibit 78: Information sources
11.4 List of abbreviations
Exhibit 79: List of abbreviations
About Us
Technavio is a leading global technology research and advisory company. Their research and analysis focus on emerging market trends and provide actionable insights to help businesses identify market opportunities and develop effective strategies to optimize their market positions. With over 500 specialized analysts, Technavio's report library consists of more than 17,000 reports and counting, covering 800 technologies, spanning across 50 countries. Their client base consists of enterprises of all sizes, including more than 100 Fortune 500 companies. This growing client base relies on Technavio's comprehensive coverage, extensive research, and actionable market insights to identify opportunities in existing and potential markets and assess their competitive positions within changing market scenarios.
Contact
Technavio Research
Jesse Maida
Media & Marketing Executive
US: +1 844 364 1100
UK: +44 203 893 3200
Email: media@technavio.com
Website: www.technavio.com/

View original content to download multimedia:https://www.prnewswire.com/news-releases/solar-energy-market-in-south-africa-to-grow-at-a-cagr-of-29-74-from-2021-to-2026-sunny-climatic-conditions-to-drive-growth---technavio-301781031.html
SOURCE Technavio
Uncategorized
February Employment Situation
By Paul Gomme and Peter Rupert The establishment data from the BLS showed a 275,000 increase in payroll employment for February, outpacing the 230,000…
Share this:


By Paul Gomme and Peter Rupert
The establishment data from the BLS showed a 275,000 increase in payroll employment for February, outpacing the 230,000 average over the previous 12 months. The payroll data for January and December were revised down by a total of 167,000. The private sector added 223,000 new jobs, the largest gain since May of last year.

Temporary help services employment continues a steep decline after a sharp post-pandemic rise.


Average hours of work increased from 34.2 to 34.3. The increase, along with the 223,000 private employment increase led to a hefty increase in total hours of 5.6% at an annualized rate, also the largest increase since May of last year.

The establishment report, once again, beat “expectations;” the WSJ survey of economists was 198,000. Other than the downward revisions, mentioned above, another bit of negative news was a smallish increase in wage growth, from $34.52 to $34.57.

The household survey shows that the labor force increased 150,000, a drop in employment of 184,000 and an increase in the number of unemployed persons of 334,000. The labor force participation rate held steady at 62.5, the employment to population ratio decreased from 60.2 to 60.1 and the unemployment rate increased from 3.66 to 3.86. Remember that the unemployment rate is the number of unemployed relative to the labor force (the number employed plus the number unemployed). Consequently, the unemployment rate can go up if the number of unemployed rises holding fixed the labor force, or if the labor force shrinks holding the number unemployed unchanged. An increase in the unemployment rate is not necessarily a bad thing: it may reflect a strong labor market drawing “marginally attached” individuals from outside the labor force. Indeed, there was a 96,000 decline in those workers.


Earlier in the week, the BLS announced JOLTS (Job Openings and Labor Turnover Survey) data for January. There isn’t much to report here as the job openings changed little at 8.9 million, the number of hires and total separations were little changed at 5.7 million and 5.3 million, respectively.

As has been the case for the last couple of years, the number of job openings remains higher than the number of unemployed persons.

Also earlier in the week the BLS announced that productivity increased 3.2% in the 4th quarter with output rising 3.5% and hours of work rising 0.3%.

The bottom line is that the labor market continues its surprisingly (to some) strong performance, once again proving stronger than many had expected. This strength makes it difficult to justify any interest rate cuts soon, particularly given the recent inflation spike.
unemployment pandemic unemploymentUncategorized
Mortgage rates fall as labor market normalizes
Jobless claims show an expanding economy. We will only be in a recession once jobless claims exceed 323,000 on a four-week moving average.
Share this:


Everyone was waiting to see if this week’s jobs report would send mortgage rates higher, which is what happened last month. Instead, the 10-year yield had a muted response after the headline number beat estimates, but we have negative job revisions from previous months. The Federal Reserve’s fear of wage growth spiraling out of control hasn’t materialized for over two years now and the unemployment rate ticked up to 3.9%. For now, we can say the labor market isn’t tight anymore, but it’s also not breaking.
The key labor data line in this expansion is the weekly jobless claims report. Jobless claims show an expanding economy that has not lost jobs yet. We will only be in a recession once jobless claims exceed 323,000 on a four-week moving average.
From the Fed: In the week ended March 2, initial claims for unemployment insurance benefits were flat, at 217,000. The four-week moving average declined slightly by 750, to 212,250
Below is an explanation of how we got here with the labor market, which all started during COVID-19.
1. I wrote the COVID-19 recovery model on April 7, 2020, and retired it on Dec. 9, 2020. By that time, the upfront recovery phase was done, and I needed to model out when we would get the jobs lost back.
2. Early in the labor market recovery, when we saw weaker job reports, I doubled and tripled down on my assertion that job openings would get to 10 million in this recovery. Job openings rose as high as to 12 million and are currently over 9 million. Even with the massive miss on a job report in May 2021, I didn’t waver.
Currently, the jobs openings, quit percentage and hires data are below pre-COVID-19 levels, which means the labor market isn’t as tight as it once was, and this is why the employment cost index has been slowing data to move along the quits percentage.

3. I wrote that we should get back all the jobs lost to COVID-19 by September of 2022. At the time this would be a speedy labor market recovery, and it happened on schedule, too
Total employment data
4. This is the key one for right now: If COVID-19 hadn’t happened, we would have between 157 million and 159 million jobs today, which would have been in line with the job growth rate in February 2020. Today, we are at 157,808,000. This is important because job growth should be cooling down now. We are more in line with where the labor market should be when averaging 140K-165K monthly. So for now, the fact that we aren’t trending between 140K-165K means we still have a bit more recovery kick left before we get down to those levels.

From BLS: Total nonfarm payroll employment rose by 275,000 in February, and the unemployment rate increased to 3.9 percent, the U.S. Bureau of Labor Statistics reported today. Job gains occurred in health care, in government, in food services and drinking places, in social assistance, and in transportation and warehousing.
Here are the jobs that were created and lost in the previous month:

In this jobs report, the unemployment rate for education levels looks like this:
- Less than a high school diploma: 6.1%
- High school graduate and no college: 4.2%
- Some college or associate degree: 3.1%
- Bachelor’s degree or higher: 2.2%

Today’s report has continued the trend of the labor data beating my expectations, only because I am looking for the jobs data to slow down to a level of 140K-165K, which hasn’t happened yet. I wouldn’t categorize the labor market as being tight anymore because of the quits ratio and the hires data in the job openings report. This also shows itself in the employment cost index as well. These are key data lines for the Fed and the reason we are going to see three rate cuts this year.
recession unemployment covid-19 fed federal reserve mortgage rates recession recovery unemploymentUncategorized
Inside The Most Ridiculous Jobs Report In History: Record 1.2 Million Immigrant Jobs Added In One Month
Inside The Most Ridiculous Jobs Report In History: Record 1.2 Million Immigrant Jobs Added In One Month
Last month we though that the January…
Share this:


Last month we though that the January jobs report was the "most ridiculous in recent history" but, boy, were we wrong because this morning the Biden department of goalseeked propaganda (aka BLS) published the February jobs report, and holy crap was that something else. Even Goebbels would blush.
What happened? Let's take a closer look.
On the surface, it was (almost) another blockbuster jobs report, certainly one which nobody expected, or rather just one bank out of 76 expected. Starting at the top, the BLS reported that in February the US unexpectedly added 275K jobs, with just one research analyst (from Dai-Ichi Research) expecting a higher number.
Some context: after last month's record 4-sigma beat, today's print was "only" 3 sigma higher than estimates. Needless to say, two multiple sigma beats in a row used to only happen in the USSR... and now in the US, apparently.

Before we go any further, a quick note on what last month we said was "the most ridiculous jobs report in recent history": it appears the BLS read our comments and decided to stop beclowing itself. It did that by slashing last month's ridiculous print by over a third, and revising what was originally reported as a massive 353K beat to just 229K, a 124K revision, which was the biggest one-month negative revision in two years!

Of course, that does not mean that this month's jobs print won't be revised lower: it will be, and not just that month but every other month until the November election because that's the only tool left in the Biden admin's box: pretend the economic and jobs are strong, then revise them sharply lower the next month, something we pointed out first last summer and which has not failed to disappoint once.
In the past month the Biden department of goalseeking stuff higher before revising it lower, has revised the following data sharply lower:
— zerohedge (@zerohedge) August 30, 2023
- Jobs
- JOLTS
- New Home sales
- Housing Starts and Permits
- Industrial Production
- PCE and core PCE
To be fair, not every aspect of the jobs report was stellar (after all, the BLS had to give it some vague credibility). Take the unemployment rate, after flatlining between 3.4% and 3.8% for two years - and thus denying expectations from Sahm's Rule that a recession may have already started - in February the unemployment rate unexpectedly jumped to 3.9%, the highest since February 2022 (with Black unemployment spiking by 0.3% to 5.6%, an indicator which the Biden admin will quickly slam as widespread economic racism or something).

And then there were average hourly earnings, which after surging 0.6% MoM in January (since revised to 0.5%) and spooking markets that wage growth is so hot, the Fed will have no choice but to delay cuts, in February the number tumbled to just 0.1%, the lowest in two years...

... for one simple reason: last month's average wage surge had nothing to do with actual wages, and everything to do with the BLS estimate of hours worked (which is the denominator in the average wage calculation) which last month tumbled to just 34.1 (we were led to believe) the lowest since the covid pandemic...

... but has since been revised higher while the February print rose even more, to 34.3, hence why the latest average wage data was once again a product not of wages going up, but of how long Americans worked in any weekly period, in this case higher from 34.1 to 34.3, an increase which has a major impact on the average calculation.

While the above data points were examples of some latent weakness in the latest report, perhaps meant to give it a sheen of veracity, it was everything else in the report that was a problem starting with the BLS's latest choice of seasonal adjustments (after last month's wholesale revision), which have gone from merely laughable to full clownshow, as the following comparison between the monthly change in BLS and ADP payrolls shows. The trend is clear: the Biden admin numbers are now clearly rising even as the impartial ADP (which directly logs employment numbers at the company level and is far more accurate), shows an accelerating slowdown.

But it's more than just the Biden admin hanging its "success" on seasonal adjustments: when one digs deeper inside the jobs report, all sorts of ugly things emerge... such as the growing unprecedented divergence between the Establishment (payrolls) survey and much more accurate Household (actual employment) survey. To wit, while in January the BLS claims 275K payrolls were added, the Household survey found that the number of actually employed workers dropped for the third straight month (and 4 in the past 5), this time by 184K (from 161.152K to 160.968K).

This means that while the Payrolls series hits new all time highs every month since December 2020 (when according to the BLS the US had its last month of payrolls losses), the level of Employment has not budged in the past year. Worse, as shown in the chart below, such a gaping divergence has opened between the two series in the past 4 years, that the number of Employed workers would need to soar by 9 million (!) to catch up to what Payrolls claims is the employment situation.

There's more: shifting from a quantitative to a qualitative assessment, reveals just how ugly the composition of "new jobs" has been. Consider this: the BLS reports that in February 2024, the US had 132.9 million full-time jobs and 27.9 million part-time jobs. Well, that's great... until you look back one year and find that in February 2023 the US had 133.2 million full-time jobs, or more than it does one year later! And yes, all the job growth since then has been in part-time jobs, which have increased by 921K since February 2023 (from 27.020 million to 27.941 million).

Here is a summary of the labor composition in the past year: all the new jobs have been part-time jobs!

But wait there's even more, because now that the primary season is over and we enter the heart of election season and political talking points will be thrown around left and right, especially in the context of the immigration crisis created intentionally by the Biden administration which is hoping to import millions of new Democratic voters (maybe the US can hold the presidential election in Honduras or Guatemala, after all it is their citizens that will be illegally casting the key votes in November), what we find is that in February, the number of native-born workers tumbled again, sliding by a massive 560K to just 129.807 million. Add to this the December data, and we get a near-record 2.4 million plunge in native-born workers in just the past 3 months (only the covid crash was worse)!

The offset? A record 1.2 million foreign-born (read immigrants, both legal and illegal but mostly illegal) workers added in February!

Said otherwise, not only has all job creation in the past 6 years has been exclusively for foreign-born workers...

... but there has been zero job-creation for native born workers since June 2018!

This is a huge issue - especially at a time of an illegal alien flood at the southwest border...

... and is about to become a huge political scandal, because once the inevitable recession finally hits, there will be millions of furious unemployed Americans demanding a more accurate explanation for what happened - i.e., the illegal immigration floodgates that were opened by the Biden admin.
Which is also why Biden's handlers will do everything in their power to insure there is no official recession before November... and why after the election is over, all economic hell will finally break loose. Until then, however, expect the jobs numbers to get even more ridiculous.


-

 Uncategorized2 weeks ago
All Of The Elements Are In Place For An Economic Crisis Of Staggering Proportions
-

 Uncategorized1 month ago
Cathie Wood sells a major tech stock (again)
-

 Uncategorized3 weeks ago
California Counties Could Be Forced To Pay $300 Million To Cover COVID-Era Program
-

 Uncategorized2 weeks ago
Apparel Retailer Express Moving Toward Bankruptcy
-

 Uncategorized3 weeks ago
Industrial Production Decreased 0.1% in January
-

 International2 days ago
Walmart launches clever answer to Target’s new membership program
-

 International3 days ago
EyePoint poaches medical chief from Apellis; Sandoz CFO, longtime BioNTech exec to retire
-

 Uncategorized3 weeks ago
RFK Jr: The Wuhan Cover-Up & The Rise Of The Biowarfare-Industrial Complex