Shore Bancshares Reports 2021 Financial Results and Quarterly Dividend of $0.12 Per share
Shore Bancshares Reports 2021 Financial Results and Quarterly Dividend of $0.12 Per share
PR Newswire
EASTON, Md., Feb. 14, 2022
EASTON, Md., Feb. 14, 2022 /PRNewswire/ — Shore Bancshares, Inc. (NASDAQ – SHBI) (the “Company”) reported net income o…
Share this:


Shore Bancshares Reports 2021 Financial Results and Quarterly Dividend of $0.12 Per share
PR Newswire
EASTON, Md., Feb. 14, 2022
EASTON, Md., Feb. 14, 2022 /PRNewswire/ -- Shore Bancshares, Inc. (NASDAQ - SHBI) (the "Company") reported net income of $2.723 million or $0.16 per diluted common share for the fourth quarter of 2021, compared to net income of $4.617 million or $0.39 per diluted common share for the third quarter of 2021, and net income of $3.886 million or $0.32 per diluted common share for the fourth quarter of 2020. Net income, excluding merger related expenses for the fourth quarter of 2021 was $7.914 million or $0.46 per diluted common share. Net income for the fiscal year of 2021 was $15.368 million or $1.17 per diluted common share, compared to net income for the fiscal year of 2020 of $15.730 million or $1.27 per diluted common share. On October 31, 2021, the Company acquired Severn Bancorp, Inc. ("Severn"). Net income, excluding merger related expenses for 2021 was $21.237 million or $1.62 per diluted common share. For the fourth quarter and the fiscal year of 2021, the Company recorded $7.6 million and $8.5 million, respectively, in merger-related expenses.
When comparing net income for the fourth quarter of 2021 to the third quarter of 2021, net income decreased $1.9 million, the direct result of $7.6 million in merger related expenses in the fourth quarter of 2021. The Company reported increases in net interest income and noninterest income of $5.1 million and $2.2 million, respectively, coupled with a reversal of provision for credit losses for a decrease of $2.0 million. These improvements were partially offset by an increase in noninterest expense of $4.5 million, excluding merger-related expenses. When comparing net income for the fourth quarter of 2021 to the fourth quarter of 2020, net income decreased $1.1 million, due to merger related expenses of $7.6 million. The Company reported increases in net interest income and noninterest income of $6.9 million and $2.1 million, respectively, coupled with a reversal of provision for credit losses for a decrease of $2.8 million, partially offset by an increase in noninterest expense of $5.3 million, excluding merger related expenses.
"We are pleased to announce our fourth quarter earnings and fiscal year 2021 results." said Lloyd L. "Scott" Beatty, Jr., President and Chief Executive Officer. "Our acquisition of Severn Bank continues to be a high priority as the process continues from the legal merger date of November 1, 2021, through the core processing conversion date of February 19, 2022. The integration has been well received and we are thrilled to have their outstanding team join us as we expand our footprint and strive to create value for our shareholders. In 2021, we experienced significant growth in both loans and deposits. Excess liquidity continues to put pressure on our margin, but that liquidity is well positioned to profit from the expected interest rate hikes in 2022."
Balance Sheet Review
Total assets were $3.460 billion at December 31, 2021, a $1.5 billion, or 79.0%, increase when compared to $1.933 billion at the end of 2020. The merger with Severn, added approximately $1.1 billion to total assets as of October 31, 2021. Excluding these acquired assets, total assets increased $384.7 million, or 19.9% when compared to the end of 2020. Of this growth the Company experienced increases in investment securities held to maturity of $214.6 million, interest-bearing deposits with other banks of $98.6 million, loans of $80.3 million and loans held for sale of $26.8 million, partially offset by a decrease in investment securities available for sale of $43.6 million.
Total deposits increased $1.326 billion, or 77.9%, when compared to December 31, 2020. The merger with Severn, added approximately $955.3 million to total deposits as of October 31, 2021. Excluding these deposits, total deposits increased $370.2 million, or 21.8%, when compared to the end of 2020. The significant movement within deposit accounts, excluding the deposits acquired from Severn, continues to be impacted by new account openings and municipal deposit inflows.
Total stockholders' equity increased $155.7 million, or 79.8%, when compared to December 31, 2020, primarily due to the acquisition of Severn. At December 31, 2021, the ratio of total equity to total assets was 10.13% and the ratio of total tangible equity to total tangible assets was 8.25%.
Review of Quarterly Financial Results
Net interest income was $20.6 million for the fourth quarter of 2021, compared to $15.6 million for the third quarter of 2021 and $13.8 million for the fourth quarter of 2020. The increase in net interest income when compared to the third quarter of 2021 was primarily due to increases in interest and fees on loans of $5.1 million, interest on taxable investment securities of $345 thousand and interest on deposits with other banks of $72 thousand, partially offset by increases in expense on interest-bearing deposits of $323 thousand and borrowings of $123 thousand. The improvement in interest and fees on loans was due to an increase in the average balance of loans of $399.8 million, or 26.9%, combined with accretion income of approximately $628 thousand from the acquired Severn loans, which increased the average yield on loans for the quarter. The acquisition of loans from Severn had the most significant impact on the higher interest and fees on loans, but it was also complemented by significant organic loan growth of $39.7 million and forgiveness on PPP loans during the fourth quarter of 2021. The increase in interest on taxable investment securities was also primarily impacted by the acquisition of Severn with the addition of continued purchases of held to maturity securities during the fourth quarter of 2021, due to an excess liquidity position. The increase in interest expense on interest-bearing deposits was primarily due to higher rates paid on money market and savings deposits acquired from Severn, resulting in an increase of 10bps in the average rate paid on these deposits. The addition of a long-term advance from the Federal Home Loan Bank ("FHLB") and subordinated debt, acquired from Severn, resulted in $150 thousand of additional borrowing expense. The long-term advances from the FHLB, will mature in October of 2022 and management will keep the subordinated debt on the balance sheet due to its addition to capital. The increase in net interest income when comparing the fourth quarter of 2021 to the fourth quarter of 2020, was primarily due to increases in interest and fees on loans of $6.0 million, interest on taxable investment securities of $754 thousand and interest on deposits with other banks of $125 thousand, coupled with a decrease in interest expense on interest-bearing deposits of $81 thousand. These improvements to net interest income were partially offset by the addition of long-term advances from the FHLB and subordinated debt acquired from Severn, which were the primary cause of additional borrowing expense of $108 thousand.
The Company's net interest margin decreased to 2.87% for the fourth quarter of 2021 from 2.99% for the third quarter of 2021 and decreased from 3.08% for the fourth quarter of 2020. The decrease in net interest margin in the fourth quarter of 2021 when compared to the third quarter of 2021 and the fourth quarter of 2020, was primarily due to excess liquidity, which has been partially invested in lower yielding taxable investment securities. In addition, the acquired borrowings from Severn attributed to the decline in margin when compared to the third quarter of 2021 and the fourth quarter of 2020. Rates paid on interest-bearing deposits in the fourth quarter of 2021 compared to the third quarter of 2021, increased by 2bps, whereas the rates paid compared to the fourth quarter of 2020, declined 18bps. Absent excess liquidity of $400 million, we estimate our margin for the fourth quarter of 2021 would have been 3.34%.
The provision for credit losses was $(1.7) million for the three months ended December 31, 2021. The comparable amounts were $290 thousand and $1.1 million for the three months ended September 30, 2021 and December 31, 2020, respectively. The reversal of provision expense in the fourth quarter of 2021 was related to reduced pandemic related qualitative factors associated with anticipated losses that failed to materialize in 2021. The ratio of the allowance for credit losses to period-end loans, excluding PPP loans and acquired loans, was 0.96% at December 31, 2021, compared to 1.10% at September 30, 2021 and 1.09% at December 31, 2020. The decreased percentage of the allowance to total loans, excluding PPP loans and acquired loans, as compared to September 30, 2021, was due to reduced pandemic qualitative factors previously mentioned. The decreased percentage of the allowance to total loans, excluding PPP loans and acquired loans, as compared to December 31, 2020, was primarily due to improved credit quality and pandemic related allocations prior to the end of 2020, which as mentioned, were significantly reduced during the fourth quarter of 2021. The Company reported net recoveries of $142 thousand in the fourth quarter of 2021, compared to net recoveries of $147 thousand in the third quarter of 2021 and net recoveries of $61 thousand for the fourth quarter of 2020.
At December 31, 2021 and September 30, 2021, nonperforming assets were $3.8 million and $4.4 million, respectively. The balance of nonperforming assets decreased primarily due to a decrease in nonaccrual loans of $671 thousand, or 19.4%. Accruing troubled debt restructurings ("TDRs") decreased $83 thousand, or 1.4%. Other real estate owned properties increased to $532 thousand for December 31, 2021, from $203 thousand at September 30, 2021, also attributable to the acquisition of Severn. When comparing December 31, 2021, to December 31, 2020, nonperforming assets decreased $2.4 million, or 38.9%, primarily due to decreases in nonaccrual loans of $2.7 million, or 48.9% and loans 90 days past due and still accruing of $296 thousand, or 36.8%. Accruing TDRs decreased $1.3 million, or 19.0%, and other real estate owned increased $532 thousand, over the same time period. The ratio of nonperforming assets and accruing TDRs to total assets was 0.27%, 0.44% and 0.68% at December 31, 2021, September 30, 2021 and December 31, 2020, respectively. In addition, the ratio of accruing TDRs to total loans at December 31, 2021 was 0.27%, compared to 0.38% at September 30, 2021 and 0.48% at December 31, 2020.
Total noninterest income for the fourth quarter of 2021 increased $2.2 million, or 76.3%, when compared to the third quarter of 2021 and increased $2.1 million, or 68.3%, when compared to the fourth quarter of 2020. The increase compared to the third quarter of 2021 and the fourth quarter of 2020 was primarily due to the addition of revenue from the recently acquired mortgage division and Mid-Maryland Title, Co. ("Mid-MD") of Severn. The mortgage division added $948 thousand and Mid-MD attributed $247 thousand in the fourth quarter of 2021. Service charges on deposit accounts increased $429 thousand when compared to the third quarter of 2021 and $452 thousand when compared to the fourth quarter of 2020. In addition, rental income on premises acquired from Severn, added an additional $237 thousand when compared to the third quarter of 2021 and $242 thousand when compared to the fourth quarter of 2020.
Total noninterest expense, excluding merger related expenses, for the fourth quarter of 2021 increased $4.5 million, or 39.4%, when compared to the third quarter of 2021 and increased $5.3 million, or 50.5%, when compared to the fourth quarter of 2020. The increase in noninterest expense when compared to the third quarter of 2021 and the fourth quarter of 2020, was primarily due to increases in salaries and wages, employee related benefits, occupancy expense, data processing, amortization of intangible assets and FDIC insurance premium expense, which were all significantly impacted by adding Severn and its operations in the fourth quarter of 2021.
Review of 2021 Financial Results
Net interest income for 2021 was $64.1 million, an increase of $11.5 million, or 21.9% when compared to 2020. The increase was primarily due to higher interest income and fees on loans of $8.4 million and taxable investment securities of $2.0 million. Total interest expense decreased $1.0 million, due to the average rates paid on interest-bearing deposits which declined by 30bps, partially offset by the addition of subordinated debt in the third quarter of 2020 and the acquisition of subordinated debt from Severn. The Company's net interest margin decreased to 2.94% for 2021, compared to 3.27% for 2020. The primary factor impacting the net interest margin was the average yield on earnings assets which declined 50bps. Although the average yield on loans only increased 1bp, the average yield on investment in taxable securities declined 64bps, while the average yield on interest-bearing deposits with other banks declined 12bps. The Company had excess liquidity before adding $955.3 million in deposits in connection with the acquisition of Severn on October 31, 2021. Management believes that the excess liquidity is a temporary issue but will benefit from anticipated interest rate increases from the Federal Reserve in the near-term while continuing to seek alternative investments with favorable yields.
The provision for credit losses for 2021 and 2020 was $(358) thousand and $3.9 million, respectively, while net recoveries were $414 thousand and net charge offs were $519 thousand, respectively. The reversal in provision for credit losses was the result of recoveries in 2021 compared to charge-offs in 2020 and the alleviation of qualitative factors established in 2020 related to the pandemic. The ratio of allowance to total loans, excluding PPP loans and acquired loans, decreased from 1.09% at December 31, 2020, to 0.96% at December 31, 2021. The primary drivers for the decrease in the percentage of allowance for credit losses to total loans were improved credit quality and the reduced impact of qualitative factors related to the pandemic. Management will continue to evaluate the adequacy of the allowance for credit losses as changes within the Company's portfolio are known.
Total noninterest income for 2021 increased $2.7 million, or 25.6%, when compared to the same period in 2020. The increase in noninterest income primarily consisted of the addition of the mortgage division and Mid-MD title from Severn. As previously stated, the mortgage division added $948 thousand and Mid-MD attributed $247 thousand in 2021. In addition, the increase in noninterest income in 2021 included increases in debit card interchange fees of $958 thousand, service charges on deposit accounts of $557 thousand and trust and investment fee income of $323 thousand, partially offset by a decrease in the gains on sale of investment securities of $345 thousand.
Total noninterest expense for 2021, excluding merger related expenses, increased $9.9 million, or 25.7%, when compared to the same period in 2020. The increase was mainly the result of increases in salaries and wages, employee related benefits, occupancy expense, data processing, amortization of intangible assets and FDIC insurance premium expense, which were all significantly impacted by adding Severn and its operations in the fourth quarter of 2021. In addition, as previously mentioned, during 2021, the Company recorded merger-related expenses of $8.5 million due to the acquisition of Severn.
Small Business Administration's Paycheck Protection Program ("PPP") and COVID related deferrals
As of December 31, 2021, the Company had 227 PPP loans totaling $27.6 million that were outstanding, inclusive of loans issued pre-merger and those acquired from Severn. The Company had no COVID related loan deferrals.
Shore Bancshares, Inc. Reports Quarterly Dividend of $0.12 Per Share
The Company announced that the Board of Directors has declared a quarterly common stock dividend in the amount of $0.12 per share, payable March 7, 2022, to stockholders of record on February 24, 2022.
Shore Bancshares Information
Shore Bancshares is a financial holding company headquartered in Easton, Maryland and is the largest independent bank holding company located on Maryland's Eastern Shore. It is the parent company of Shore United Bank. Shore Bancshares engages in trust and wealth management services through Wye Financial Partners, a division of Shore United Bank.
Additional information is available at www.shorebancshares.com.
Forward-Looking Statements
The statements contained herein that are not historical facts are forward-looking statements (as defined by the Private Securities Litigation Reform Act of 1995) based on management's current expectations and beliefs concerning future developments and their potential effects on the Company. Such statements involve inherent risks and uncertainties, many of which are difficult to predict and are generally beyond the control of the Company. There can be no assurance that future developments affecting the Company will be the same as those anticipated by management. These statements are evidenced by terms such as "anticipate," "estimate," "should," "expect," "believe," "intend," and similar expressions. Although these statements reflect management's good faith beliefs and projections, they are not guarantees of future performance and they may not prove true. These projections involve risk and uncertainties that could cause actual results to differ materially from those addressed in the forward-looking statements. For a discussion of these risks and uncertainties, see the section of the periodic reports filed by Shore Bancshares, Inc. with the Securities and Exchange Commission entitled "Risk Factors".
The Company specifically disclaims any obligation to update any factors or to publicly announce the result of revisions to any of the forward-looking statements included herein to reflect future events or developments.
Shore Bancshares, Inc. | |||||||||||||||||
Financial Highlights (Unaudited) | |||||||||||||||||
(Dollars in thousands, except per share data) | |||||||||||||||||
For the Three Months Ended | For the Year Ended | ||||||||||||||||
December 31, | December 31, | ||||||||||||||||
2021 | 2020 | Change | 2021 | 2020 | Change | ||||||||||||
PROFITABILITY FOR THE PERIOD | |||||||||||||||||
Net interest income | $ | 20,639 | $ | 13,765 | 49.9 | % | $ | 64,130 | $ | 52,597 | 21.9 | % | |||||
Provision for credit losses | (1,723) | 1,050 | (264.1) | (358) | 3,900 | (109.2) | |||||||||||
Noninterest income | 5,129 | 3,047 | 68.3 | 13,498 | 10,749 | 25.6 | |||||||||||
Noninterest expense | 23,497 | 10,556 | 122.6 | 56,806 | 38,399 | 47.9 | |||||||||||
Income before income taxes | 3,994 | 5,206 | (23.3) | 21,180 | 21,047 | 0.6 | |||||||||||
Income tax expense | 1,271 | 1,320 | (3.7) | 5,812 | 5,317 | 9.3 | |||||||||||
Net income | $ | 2,723 | $ | 3,886 | (29.9) | $ | 15,368 | $ | 15,730 | (2.3) | |||||||
Return on average assets | 0.36 | % | 0.82 | % | (46) | bp | 0.66 | % | 0.92 | % | (26) | bp | |||||
Return on average assets excluding merger expenses - Non-GAAP (2) | 1.35 | 0.82 | 53 | 1.03 | 0.92 | 11 | |||||||||||
Return on average equity | 3.59 | 7.82 | (423) | 6.86 | 7.95 | (109) | |||||||||||
Return on average tangible equity - Non-GAAP (1), (2) | 13.88 | 8.88 | 500 | 11.34 | 9.04 | 230 | |||||||||||
Net interest margin | 2.87 | 3.08 | (21) | 2.94 | 3.27 | (33) | |||||||||||
Efficiency ratio - GAAP | 91.19 | 62.79 | 2,840 | 73.18 | 60.62 | 1,256 | |||||||||||
Efficiency ratio - Non-GAAP (1), (2) | 60.13 | 61.91 | (178) | 61.15 | 59.97 | 118 | |||||||||||
PER SHARE DATA | |||||||||||||||||
Basic and diluted net income per common share | $ | 0.16 | $ | 0.32 | (50.0) | % | $ | 1.17 | $ | 1.27 | (7.9) | % | |||||
Dividends paid per common share | $ | 0.12 | $ | 0.12 | — | $ | 0.48 | $ | 0.48 | — | |||||||
Book value per common share at period end | 17.71 | 16.55 | 7.0 | ||||||||||||||
Tangible book value per common share at period end - Non-GAAP (1) | 14.12 | 14.92 | (5.4) | ||||||||||||||
Market value at period end | 20.85 | 14.60 | 42.8 | ||||||||||||||
Market range: | |||||||||||||||||
High | 23.19 | 15.12 | 53.4 | 23.19 | 17.56 | 32.1 | |||||||||||
Low | 17.50 | 10.25 | 70.7 | 12.99 | 7.63 | 70.2 | |||||||||||
AVERAGE BALANCE SHEET DATA | |||||||||||||||||
Loans | $ | 1,887,126 | $ | 1,430,013 | 32.0 | % | $ | 1,568,468 | $ | 1,368,887 | 14.6 | % | |||||
Investment securities | 468,724 | 179,801 | 160.7 | 329,890 | 138,391 | 138.4 | |||||||||||
Earning assets | 2,842,097 | 1,780,854 | 59.6 | 2,185,123 | 1,611,004 | 35.6 | |||||||||||
Assets | 3,037,262 | 1,880,449 | 61.5 | 2,317,597 | 1,709,997 | 35.5 | |||||||||||
Deposits | 2,547,151 | 1,646,980 | 54.7 | 2,015,624 | 1,487,921 | 35.5 | |||||||||||
Stockholders' equity | 301,095 | 197,591 | 52.4 | 224,055 | 197,969 | 13.2 | |||||||||||
CREDIT QUALITY DATA | |||||||||||||||||
Net (recoveries) charge-offs | $ | (142) | $ | (61) | (132.8) | % | $ | (414) | $ | 519 | (179.8) | % | |||||
Nonaccrual loans | $ | 2,786 | $ | 5,455 | (48.9) | ||||||||||||
Loans 90 days past due and still accruing | 508 | 804 | (36.8) | ||||||||||||||
Other real estate owned | 532 | — | — | ||||||||||||||
Total nonperforming assets | 3,826 | 6,259 | (38.9) | ||||||||||||||
Accruing troubled debt restructurings (TDRs) excluding acquired | 5,667 | 6,997 | (19.0) | ||||||||||||||
Total nonperforming assets and accruing TDRs excluding acquired | $ | 9,493 | $ | 13,256 | (28.4) | ||||||||||||
CAPITAL AND CREDIT QUALITY RATIOS | |||||||||||||||||
Period-end equity to assets | 10.13 | % | 10.09 | % | 4 | bp | |||||||||||
Period-end tangible equity to tangible assets - Non-GAAP (1) | 8.25 | 9.18 | (93) | ||||||||||||||
Annualized net (recoveries) charge-offs to average loans | (0.03) | (0.02) | (1) | (0.03) | % | 0.04 | % | (7) | bp | ||||||||
Allowance for credit losses as a percent of: | |||||||||||||||||
Period-end loans (3) | 0.66 | 0.95 | (29) | ||||||||||||||
Period-end loans (4) | 0.96 | 1.09 | (13) | ||||||||||||||
Nonaccrual loans | 500.50 | 254.59 | 246 | ||||||||||||||
Nonperforming assets | 364.45 | 221.89 | 143 | ||||||||||||||
Accruing TDRs excluding acquired | 246.06 | 198.49 | 48 | ||||||||||||||
Nonperforming assets and accruing TDRs excluding acquired | 146.89 | 104.77 | 42 | ||||||||||||||
As a percent of total loans: | |||||||||||||||||
Nonaccrual loans | 0.13 | 0.38 | (25) | ||||||||||||||
Accruing TDRs excluding acquired | 0.27 | 0.48 | (21) | ||||||||||||||
Nonaccrual loans and accruing TDRs excluding acquired | 0.40 | 0.86 | (46) | ||||||||||||||
As a percent of total loans+other real estate owned: | |||||||||||||||||
Nonperforming assets | 0.18 | 0.43 | (25) | ||||||||||||||
Nonperforming assets and accruing TDRs excluding acquired | 0.45 | 0.91 | (46) | ||||||||||||||
As a percent of total assets: | |||||||||||||||||
Nonaccrual loans | 0.08 | 0.28 | (20) | ||||||||||||||
Nonperforming assets | 0.11 | 0.32 | (21) | ||||||||||||||
Accruing TDRs excluding acquired | 0.16 | 0.36 | (20) | ||||||||||||||
Nonperforming assets and accruing TDRs excluding acquired | 0.27 | 0.68 | (41) | ||||||||||||||
____________________ | |
(1) | See the reconciliation table that begins on page 14 of 15. |
(2) | This ratio excludes merger related expenses (Non-GAAP). |
(3) | As of December 31, 2021 and December 31, 2020, these ratios included all loans held for investment, including PPP loans of $27.6 million and $122.8 million, respectively. |
(4) | As of December 31, 2021 and December 31, 2020, these ratios exclude PPP loans, acquired loans and the associated purchase discount mark on the acquired loans from both Severn and Northwest. |
Shore Bancshares, Inc. | |||||||||
Consolidated Balance Sheets (Unaudited) | |||||||||
(In thousands, except per share data) | |||||||||
December 31, 2021 | |||||||||
December 31, | December 31, | compared to | |||||||
2021 | 2020 | December 31, 2020 | |||||||
ASSETS | |||||||||
Cash and due from banks | $ | 16,919 | $ | 16,666 | 1.5 | % | |||
Interest-bearing deposits with other banks | 566,694 | 170,251 | 232.9 | ||||||
Cash and cash equivalents | 583,613 | 186,917 | 212.2 | ||||||
Investment securities available for sale (at fair value) | 116,982 | 139,568 | (16.2) | ||||||
Investment securities held to maturity (at amortized cost) | 404,594 | 65,706 | 515.8 | ||||||
Equity securities, at fair value | 1,372 | 1,395 | (1.6) | ||||||
Restricted securities | 4,159 | 3,626 | 14.7 | ||||||
Loans held for sale, at fair value | 36,427 | - | — | ||||||
Loans | 2,119,175 | 1,454,256 | 45.7 | ||||||
Less: allowance for credit losses | (13,944) | (13,888) | 0.4 | ||||||
Loans, net | 2,105,231 | 1,440,368 | 46.2 | ||||||
Premises and equipment, net | 51,624 | 24,924 | 107.1 | ||||||
Goodwill | 63,421 | 17,518 | 262.0 | ||||||
Other intangible assets, net | 7,535 | 1,719 | 338.3 | ||||||
Other real estate owned, net | 532 | — | — | ||||||
Mortgage servicing rights | 4,087 | — | — | ||||||
Right of use assets, net | 11,370 | 4,795 | 137.1 | ||||||
Other assets | 69,469 | 46,779 | 48.5 | ||||||
Total assets | $ | 3,460,416 | $ | 1,933,315 | 79.0 | ||||
LIABILITIES | |||||||||
Noninterest-bearing deposits | $ | 1,059,963 | $ | 509,091 | 108.2 | ||||
Interest-bearing deposits | 1,966,273 | 1,191,614 | 65.0 | ||||||
Total deposits | 3,026,236 | 1,700,705 | 77.9 | ||||||
Securities sold under retail repurchase agreements | 4,143 | 1,050 | 294.6 | ||||||
Advances from FHLB - short-term | — | — | — | ||||||
Advances from FHLB - long-term | 10,135 | — | — | ||||||
Subordinated debt | 42,762 | 24,429 | 75.0 | ||||||
Total borrowings | 57,040 | 25,479 | |||||||
Lease liabilities | 11,567 | 4,874 | 137.3 | ||||||
Accrued expenses and other liabilities | 14,880 | 7,238 | 105.6 | ||||||
Total liabilities | 3,109,723 | 1,738,296 | 78.9 | ||||||
COMMITMENTS AND CONTINGENCIES | |||||||||
STOCKHOLDERS' EQUITY | |||||||||
Common stock, par value $0.01; authorized 35,000,000 shares | 198 | 118 | 67.8 | ||||||
Additional paid in capital | 200,473 | 52,167 | 284.3 | ||||||
Retained earnings | 149,966 | 141,205 | 6.2 | ||||||
Accumulated other comprehensive income | 56 | 1,529 | (96.3) | ||||||
Total stockholders' equity | 350,693 | 195,019 | 79.8 | ||||||
Total liabilities and stockholders' equity | $ | 3,460,416 | $ | 1,933,315 | 79.0 | ||||
Period-end common shares outstanding | 19,808 | 11,783 | 68.1 | ||||||
Book value per common share | $ | 17.71 | $ | 16.55 | 7.0 | ||||
Shore Bancshares, Inc. | |||||||||||||||||
Consolidated Statements of Income (Unaudited) | |||||||||||||||||
(In thousands, except per share data) | |||||||||||||||||
For the Three Months Ended | For the Year Ended | ||||||||||||||||
December 31, | December 31, | ||||||||||||||||
2021 | 2020 | % Change | 2021 | 2020 | % Change | ||||||||||||
INTEREST INCOME | |||||||||||||||||
Interest and fees on loans | $ | 20,564 | $ | 14,541 | 41.4 | % | $ | 64,795 | $ | 56,420 | 14.8 | % | |||||
Interest on investment securities: | |||||||||||||||||
Taxable | 1,663 | 910 | 82.7 | 5,006 | 2,997 | 67.0 | |||||||||||
Interest on deposits with other banks | 169 | 44 | 284.1 | 368 | 260 | 41.5 | |||||||||||
Total interest income | 22,396 | 15,495 | 44.5 | 70,169 | 59,677 | 17.6 | |||||||||||
INTEREST EXPENSE | |||||||||||||||||
Interest on deposits | 1,272 | 1,355 | (6.1) | 4,461 | 6,440 | (30.7) | |||||||||||
Interest on short-term borrowings | 3 | 1 | 200.0 | 8 | 5 | 60.0 | |||||||||||
Interest on long-term borrowings | 482 | 374 | 28.9 | 1,570 | 635 | — | |||||||||||
Total interest expense | 1,757 | 1,730 | 1.6 | 6,039 | 7,080 | (14.7) | |||||||||||
NET INTEREST INCOME | 20,639 | 13,765 | 49.9 | 64,130 | 52,597 | 21.9 | |||||||||||
Provision for credit losses | (1,723) | 1,050 | (264.1) | (358) | 3,900 | (109.2) | |||||||||||
NET INTEREST INCOME AFTER PROVISION | |||||||||||||||||
FOR CREDIT LOSSES | 22,362 | 12,715 | 75.9 | 64,488 | 48,697 | 32.4 | |||||||||||
NONINTEREST INCOME | |||||||||||||||||
Service charges on deposit accounts | 1,234 | 782 | 57.8 | 3,396 | 2,839 | 19.6 | |||||||||||
Trust and investment fee income | 522 | 439 | 18.9 | 1,881 | 1,558 | 20.7 | |||||||||||
Gains on sales and calls of investment securities | — | — | — | 2 | 347 | — | |||||||||||
Interchange credits | 1,043 | 837 | 24.6 | 3,964 | 3,006 | — | |||||||||||
Mortgage-banking revenue | 948 | — | — | 948 | — | — | |||||||||||
Title Company revenue | 247 | — | — | 247 | — | — | |||||||||||
Other noninterest income | 1,135 | 989 | 14.8 | 3,060 | 2,999 | 2.0 | |||||||||||
Total noninterest income | 5,129 | 3,047 | 68.3 | 13,498 | 10,749 | 25.6 | |||||||||||
NONINTEREST EXPENSE | |||||||||||||||||
Salaries and wages | 7,727 | 4,366 | 77.0 | 21,222 | 14,935 | 42.1 | |||||||||||
Employee benefits | 2,271 | 1,715 | 32.4 | 7,262 | 6,461 | 12.4 | |||||||||||
Occupancy expense | 1,263 | 745 | 69.5 | 3,690 | 2,919 | 26.4 | |||||||||||
Furniture and equipment expense | 385 | 366 | 5.2 | 1,553 | 1,224 | 26.9 | |||||||||||
Data processing | 1,487 | 1,093 | 36.0 | 5,001 | 4,288 | 16.6 | |||||||||||
Directors' fees | 170 | 118 | 44.1 | 620 | 504 | 23.0 | |||||||||||
Amortization of intangible assets | 381 | 126 | 202.4 | 734 | 533 | 37.7 | |||||||||||
FDIC insurance premium expense | 362 | 138 | 162.3 | 1,015 | 485 | 109.3 | |||||||||||
Other real estate owned expenses, net | (2) | 38 | (105.3) | 4 | 56 | (92.9) | |||||||||||
Legal and professional fees | 150 | 662 | (77.3) | 1,742 | 2,296 | (24.1) | |||||||||||
Merger related expenses | 7,615 | — | — | 8,530 | — | — | |||||||||||
Other noninterest expenses | 1,688 | 1,189 | 42.0 | 5,433 | 4,698 | 15.6 | |||||||||||
Total noninterest expense | 23,497 | 10,556 | 122.6 | 56,806 | 38,399 | 47.9 | |||||||||||
Income before income taxes | 3,994 | 5,206 | (23.3) | 21,180 | 21,047 | 0.6 | |||||||||||
Income tax expense | 1,271 | 1,320 | (3.7) | 5,812 | 5,317 | 9.3 | |||||||||||
NET INCOME | $ | 2,723 | $ | 3,886 | (29.9) | $ | 15,368 | $ | 15,730 | (2.3) | |||||||
Weighted average shares outstanding - basic | 17,180 | 12,004 | 43.1 | 13,119 | 12,380 | 6.0 | |||||||||||
Weighted average shares outstanding - diluted | 17,180 | 12,005 | 43.1 | 13,119 | 12,381 | 6.0 | |||||||||||
Basic and diluted net income per common share | $ | 0.16 | $ | 0.32 | (50.0) | $ | 1.17 | $ | 1.27 | (7.9) | |||||||
Dividends paid per common share | 0.12 | 0.12 | — | 0.48 | 0.48 | — | |||||||||||
Shore Bancshares, Inc. | |||||||||||||||||||||
Consolidated Average Balance Sheets (Unaudited) | |||||||||||||||||||||
(Dollars in thousands) | |||||||||||||||||||||
For the Three Months Ended | For the Year Ended | ||||||||||||||||||||
December 31, | December 31, | ||||||||||||||||||||
2021 | 2020 | 2021 | 2020 | ||||||||||||||||||
Average | Yield/ | Average | Yield/ | Average | Yield/ | Average | Yield/ | ||||||||||||||
balance | rate | balance | rate | balance | rate | balance | rate | ||||||||||||||
Earning assets | |||||||||||||||||||||
Loans (1), (2), (3) | $ | 1,887,126 | 4.33 | % | $ | 1,430,013 | 4.05 | % | $ | 1,568,468 | 4.14 | % | $ | 1,368,887 | 4.13 | % | |||||
Investment securities | |||||||||||||||||||||
Taxable | 468,724 | 1.42 | 179,801 | 2.02 | 329,890 | 1.52 | 138,391 | 2.16 | |||||||||||||
Interest-bearing deposits | 486,247 | 0.14 | 171,040 | 0.10 | 286,765 | 0.13 | 103,726 | 0.25 | |||||||||||||
Total earning assets | 2,842,097 | 3.11 | % | 1,780,854 | 3.47 | % | 2,185,123 | 3.21 | % | 1,611,004 | 3.71 | % | |||||||||
Cash and due from banks | 22,625 | 17,268 | 19,838 | 18,042 | |||||||||||||||||
Other assets | 188,399 | 95,684 | 127,704 | 92,575 | |||||||||||||||||
Allowance for credit losses | (15,859) | (13,357) | (15,068) | (11,624) | |||||||||||||||||
Total assets | $ | 3,037,262 | $ | 1,880,449 | $ | 2,317,597 | $ | 1,709,997 | |||||||||||||
Interest-bearing liabilities | |||||||||||||||||||||
Demand deposits | $ | 494,081 | 0.14 | % | $ | 420,582 | 0.18 | % | $ | 450,399 | 0.14 | % | $ | 343,848 | 0.26 | % | |||||
Money market and savings deposits | 925,301 | 0.28 | 459,237 | 0.20 | 675,979 | 0.21 | 434,781 | 0.27 | |||||||||||||
Certificates of deposit $100,000 or more | 174,268 | 0.49 | 128,642 | 1.45 | 144,209 | 0.84 | 129,150 | 1.70 | |||||||||||||
Other time deposits | 173,975 | 0.50 | 145,795 | 1.27 | 151,429 | 0.78 | 148,823 | 1.46 | |||||||||||||
Interest-bearing deposits | 1,767,625 | 0.29 | 1,154,256 | 0.47 | 1,422,016 | 0.31 | 1,056,602 | 0.61 | |||||||||||||
Securities sold under retail repurchase | |||||||||||||||||||||
agreements and federal funds purchased | 3,972 | 0.30 | 1,101 | 0.36 | 3,017 | 0.27 | 1,484 | 0.34 | |||||||||||||
Advances from FHLB - long-term | 6,630 | 2.21 | — | — | 1,671 | 0.48 | 3,934 | 2.87 | |||||||||||||
Subordinated debt | 36,589 | 5.12 | 24,420 | 6.09 | 27,528 | 5.70 | 8,617 | 6.06 | |||||||||||||
Total interest-bearing liabilities | 1,814,816 | 0.38 | % | 1,179,777 | 0.58 | % | 1,454,232 | 0.42 | % | 1,070,637 | 0.66 | % | |||||||||
Noninterest-bearing deposits | 779,526 | 492,724 | 593,608 | 431,319 | |||||||||||||||||
Accrued expenses and other liabilities | 141,825 | 10,357 | 45,702 | 10,072 | |||||||||||||||||
Stockholders' equity | 301,095 | 197,591 | 224,055 | 197,969 | |||||||||||||||||
Total liabilities and stockholders' equity | $ | 3,037,262 | $ | 1,880,449 | $ | 2,317,597 | $ | 1,709,997 | |||||||||||||
Net interest spread | 2.73 | % | 2.89 | % | 2.79 | % | 3.05 | % | |||||||||||||
Net interest margin | 2.87 | % | 3.08 | % | 2.94 | % | 3.27 | % | |||||||||||||
____________________ | |
(1) | All amounts are reported on a tax-equivalent basis computed using the statutory federal income tax rate of 21.0%, exclusive of nondeductible interest expense. |
(2) | Average loan balances include nonaccrual loans. |
(3) | Interest income on loans includes accreted loan fees, net of costs and accretion of discounts on acquired loans, which are included in the yield calculations. |
Shore Bancshares, Inc. | ||||||||||||||||||||
Financial Highlights By Quarter (Unaudited) | ||||||||||||||||||||
(Dollars in thousands, except per share data) | ||||||||||||||||||||
4th Quarter | 3rd Quarter | 2nd Quarter | 1st Quarter | 4th Quarter | Q4 2021 | Q4 2021 | ||||||||||||||
2021 | 2021 | 2021 | 2021 | 2020 | compared to | compared to | ||||||||||||||
Q4 2021 | Q3 2021 | Q2 2021 | Q1 2021 | Q4 2020 | Q3 2021 | Q4 2020 | ||||||||||||||
PROFITABILITY FOR THE PERIOD | ||||||||||||||||||||
Taxable-equivalent net interest income | $ | 20,652 | $ | 15,623 | $ | 14,141 | $ | 13,836 | $ | 13,799 | 32.2 | % | 49.7 | % | ||||||
Less: Taxable-equivalent adjustment | 13 | 34 | 38 | 36 | 34 | (61.8) | (61.8) | |||||||||||||
Net interest income | 20,639 | 15,589 | 14,103 | 13,800 | 13,765 | 32.4 | 49.9 | |||||||||||||
Provision for credit losses | (1,723) | 290 | 650 | 425 | 1,050 | (694.1) | (264.1) | |||||||||||||
Noninterest income | 5,129 | 2,909 | 2,903 | 2,557 | 3,047 | 76.3 | 68.3 | |||||||||||||
Noninterest expense | 23,497 | 11,934 | 10,876 | 10,499 | 10,556 | 96.9 | 122.6 | |||||||||||||
Income before income taxes | 3,994 | 6,274 | 5,480 | 5,433 | 5,206 | (36.3) | (23.3) | |||||||||||||
Income tax expense | 1,271 | 1,657 | 1,449 | 1,435 | 1,320 | (23.3) | (3.7) | |||||||||||||
Net income | $ | 2,723 | $ | 4,617 | $ | 4,031 | $ | 3,998 | $ | 3,886 | (41.0) | (29.9) | ||||||||
Return on average assets | 0.36 | % | 0.84 | % | 0.78 | % | 0.82 | % | 0.82 | % | (48) | bp | (46) | bp | ||||||
Return on average assets excluding merger expenses - Non-GAAP (2) | 1.35 | 0.94 | 0.86 | 0.82 | 0.82 | 41 | 53 | |||||||||||||
Return on average equity | 3.59 | 9.12 | 8.19 | 8.28 | 7.82 | (553) | (423) | |||||||||||||
Return on average tangible equity - Non-GAAP(1) | 13.88 | 11.12 | 9.89 | 9.40 | 8.88 | 276 | 500 | |||||||||||||
Net interest margin | 2.87 | 2.99 | 2.91 | 3.00 | 3.08 | (12) | (21) | |||||||||||||
Efficiency ratio - GAAP | 91.19 | 64.52 | 63.95 | 64.19 | 62.79 | 2,667 | 2,840 | |||||||||||||
Efficiency ratio - Non-GAAP (1), (2) | 60.13 | 60.92 | 60.90 | 63.28 | 61.91 | (79) | (178) | |||||||||||||
PER SHARE DATA | ||||||||||||||||||||
Basic and diluted net income per common share | $ | 0.16 | $ | 0.39 | $ | 0.34 | $ | 0.34 | $ | 0.32 | (59.0) | % | (50.0) | % | ||||||
Dividends paid per common share | 0.12 | 0.12 | 0.12 | 0.12 | 0.12 | — | — | |||||||||||||
Book value per common share at period end | 17.71 | 17.15 | 16.91 | 16.69 | 16.55 | 3.3 | 7.0 | |||||||||||||
Tangible book value per common share at period end - Non-GAAP (1) | 14.12 | 15.55 | 15.29 | 15.06 | 14.92 | (9.2) | (5.4) | |||||||||||||
Market value at period end | 20.85 | 17.73 | 16.75 | 17.02 | 14.60 | 17.6 | 42.8 | |||||||||||||
Market range: | ||||||||||||||||||||
High | 23.19 | 18.00 | 18.01 | 18.10 | 15.12 | 28.8 | 53.4 | |||||||||||||
Low | 17.50 | 16.35 | 16.10 | 12.99 | 10.25 | 7.0 | 70.7 | |||||||||||||
AVERAGE BALANCE SHEET DATA | ||||||||||||||||||||
Loans | $ | 1,887,126 | $ | 1,487,281 | $ | 1,444,684 | $ | 1,450,883 | $ | 1,430,013 | 26.9 | % | 32.0 | % | ||||||
Investment securities | 468,724 | 334,205 | 286,121 | 227,816 | 179,801 | 40.3 | 160.7 | |||||||||||||
Earning assets | 2,842,097 | 2,071,505 | 1,949,509 | 1,867,930 | 1,780,854 | 37.2 | 59.6 | |||||||||||||
Assets | 3,037,262 | 2,184,448 | 2,061,214 | 1,975,951 | 1,880,449 | 39.0 | 61.5 | |||||||||||||
Deposits | 2,547,151 | 1,943,225 | 1,822,148 | 1,742,666 | 1,646,980 | 31.1 | 54.7 | |||||||||||||
Stockholders' equity | 301,095 | 200,881 | 197,532 | 195,791 | 197,591 | 49.9 | 52.4 | |||||||||||||
CREDIT QUALITY DATA | ||||||||||||||||||||
Net (recoveries) charge-offs | $ | (142) | $ | (147) | $ | (125) | $ | — | $ | (61) | 3.4 | % | (132.8) | % | ||||||
Nonaccrual loans | $ | 2,786 | $ | 3,457 | $ | 3,947 | $ | 4,880 | $ | 5,455 | (19.4) | (48.9) | ||||||||
Loans 90 days past due and still accruing | 508 | 748 | 752 | 1,188 | 804 | (32.1) | (36.8) | |||||||||||||
Other real estate owned | 532 | 203 | 203 | 205 | — | 162.1 | 100.0 | |||||||||||||
Total nonperforming assets | $ | 3,826 | $ | 4,408 | $ | 4,902 | $ | 6,273 | $ | 6,259 | (13.2) | (38.9) | ||||||||
Accruing troubled debt restructurings (TDRs) excluding acquired | $ | 5,667 | $ | 5,750 | $ | 6,338 | $ | 6,456 | $ | 6,997 | (1.4) | (19.0) | ||||||||
Total nonperforming assets and accruing TDRs | $ | 9,493 | $ | 10,158 | $ | 11,240 | $ | 12,729 | $ | 13,256 | (6.5) | (28.4) | ||||||||
CAPITAL AND CREDIT QUALITY RATIOS | ||||||||||||||||||||
Period-end equity to assets | 10.13 | % | 8.92 | % | 9.37 | % | 9.61 | % | 10.09 | % | 121 | bp | 4 | bp | ||||||
Period-end tangible equity to tangible assets - Non-GAAP (1) | 8.25 | 8.15 | 8.55 | 8.76 | 9.18 | 10 | (93) | |||||||||||||
Annualized net (recoveries) charge-offs to average loans | (0.03) | (0.04) | (0.03) | — | (0.02) | 1 | (1) | |||||||||||||
Allowance for credit losses as a percent of: | ||||||||||||||||||||
Period-end loans (3) | 0.66 | 1.04 | 1.02 | 0.98 | 0.95 | (38) | (29) | |||||||||||||
Period-end loans (4) | 0.96 | 1.10 | 1.12 | 1.11 | 1.09 | (14) | (13) | |||||||||||||
Nonaccrual loans | 500.50 | 449.09 | 382.27 | 293.30 | 254.59 | 5,141 | 246 | |||||||||||||
Nonperforming assets | 364.45 | 352.20 | 307.79 | 228.17 | 221.89 | 1,225 | 143 | |||||||||||||
Accruing TDRs excluding acquired | 246.06 | 270.00 | 238.06 | 221.70 | 198.49 | (2,394) | 48 | |||||||||||||
Nonperforming assets and accruing TDRs excluding acquired | 146.89 | 152.84 | 134.23 | 112.44 | 104.77 | (595) | 42 | |||||||||||||
As a percent of total loans: | ||||||||||||||||||||
Nonaccrual loans | 0.13 | 0.23 | 0.27 | 0.33 | 0.38 | (10) | (25) | |||||||||||||
Accruing TDRs excluding acquired | 0.27 | 0.38 | 0.43 | 0.44 | 0.48 | (11) | (21) | |||||||||||||
Nonaccrual loans and accruing TDRs excluding acquired | 0.40 | 0.62 | 0.70 | 0.78 | 0.86 | (22) | (46) | |||||||||||||
As a percent of total loans+other real estate owned: | ||||||||||||||||||||
Nonperforming assets | 0.18 | 0.29 | 0.33 | 0.43 | 0.43 | (11) | (25) | |||||||||||||
Nonperforming assets and accruing TDRs excluding acquired | 0.45 | 0.68 | 0.76 | 0.87 | 0.91 | (23) | (46) | |||||||||||||
As a percent of total assets: | ||||||||||||||||||||
Nonaccrual loans | 0.08 | 0.15 | 0.19 | 0.24 | 0.28 | (7) | (20) | |||||||||||||
Nonperforming assets | 0.11 | 0.19 | 0.23 | 0.31 | 0.32 | (8) | (21) | |||||||||||||
Accruing TDRs excluding acquired | 0.16 | 0.25 | 0.30 | 0.32 | 0.36 | (9) | (20) | |||||||||||||
Nonperforming assets and accruing TDRs excluding acquired | 0.27 | 0.44 | 0.53 | 0.63 | 0.68 | (17) | (41) | |||||||||||||
___________________ | |
(1) | See the reconciliation table that begins on page 14 of 15. |
(2) | This ratio excludes merger related expenses (Non-GAAP). |
(3) | Includes all loans held for investment, including PPP loan balances for all periods shown. |
(4) | For all periods shown, these ratios exclude PPP loans, acquired loans and the associated purchase discount mark on the acquired loans from both Severn and Northwest. |
Shore Bancshares, Inc. | ||||||||||||||||||||
Consolidated Statements of Income By Quarter (Unaudited) | ||||||||||||||||||||
(In thousands, except per share data) | ||||||||||||||||||||
Q4 2021 | Q4 2021 | |||||||||||||||||||
compared to | compared to | |||||||||||||||||||
Q4 2021 | Q3 2021 | Q2 2021 | Q1 2021 | Q4 2020 | Q3 2021 | Q4 2020 | ||||||||||||||
INTEREST INCOME | ||||||||||||||||||||
Interest and fees on loans | $ | 20,564 | $ | 15,484 | $ | 14,381 | $ | 14,366 | $ | 14,541 | 32.8 | % | 41.4 | % | ||||||
Interest on investment securities: | ||||||||||||||||||||
Taxable | 1,663 | 1,318 | 1,095 | 931 | 910 | 26.2 | 82.7 | |||||||||||||
Interest on deposits with other banks | 169 | 97 | 55 | 47 | 44 | 74.2 | 284.1 | |||||||||||||
Total interest income | 22,396 | 16,899 | 15,531 | 15,344 | 15,495 | 32.5 | 44.5 | |||||||||||||
INTEREST EXPENSE | ||||||||||||||||||||
Interest on deposits | 1,272 | 949 | 1,056 | 1,184 | 1,355 | 34.0 | (6.1) | |||||||||||||
Interest on short-term borrowings | 3 | 2 | 2 | 1 | 1 | 50.0 | 200.0 | |||||||||||||
Interest on long-term borrowings | 482 | 359 | 370 | 359 | 374 | 34.3 | 28.9 | |||||||||||||
Total interest expense | 1,757 | 1,310 | 1,428 | 1,544 | 1,730 | 34.1 | 1.6 | |||||||||||||
NET INTEREST INCOME | 20,639 | 15,589 | 14,103 | 13,800 | 13,765 | 32.4 | 49.9 | |||||||||||||
Provision for credit losses | (1,723) | 290 | 650 | 425 | 1,050 | (694.1) | (264.1) | |||||||||||||
NET INTEREST INCOME AFTER PROVISION | ||||||||||||||||||||
FOR CREDIT LOSSES | 22,362 | 15,299 | 13,453 | 13,375 | 12,715 | 46.2 | 75.9 | |||||||||||||
NONINTEREST INCOME | ||||||||||||||||||||
Service charges on deposit accounts | 1,234 | 805 | 683 | 674 | 782 | 53.3 | 57.8 | |||||||||||||
Trust and investment fee income | 522 | 477 | 475 | 407 | 439 | 9.4 | 18.9 | |||||||||||||
Gains on sales and calls of investment securities | — | 2 | — | — | — | (100.0) | — | |||||||||||||
Interchange credits | 1,043 | 1,016 | 1,036 | 869 | 837 | 2.7 | 24.6 | |||||||||||||
Mortgage-banking revenue | 948 | — | — | — | — | — | — | |||||||||||||
Title Company revenue | 247 | — | — | — | — | — | — | |||||||||||||
Other noninterest income | 1,135 | 609 | 709 | 607 | 989 | 86.4 | 14.8 | |||||||||||||
Total noninterest income | 5,129 | 2,909 | 2,903 | 2,557 | 3,047 | 76.3 | 68.3 | |||||||||||||
NONINTEREST EXPENSE | ||||||||||||||||||||
Salaries and wages | 7,727 | 5,091 | 4,262 | 4,142 | 4,366 | 51.8 | 77.0 | |||||||||||||
Employee benefits | 2,271 | 1,654 | 1,493 | 1,844 | 1,715 | 37.3 | 32.4 | |||||||||||||
Occupancy expense | 1,263 | 843 | 770 | 814 | 745 | 49.8 | 69.5 | |||||||||||||
Furniture and equipment expense | 385 | 449 | 412 | 307 | 366 | (14.3) | 5.2 | |||||||||||||
Data processing | 1,487 | 1,170 | 1,217 | 1,127 | 1,093 | 27.1 | 36.0 | |||||||||||||
Directors' fees | 170 | 147 | 154 | 149 | 118 | 15.6 | 44.1 | |||||||||||||
Amortization of intangible assets | 381 | 107 | 120 | 126 | 126 | 256.1 | 202.4 | |||||||||||||
FDIC insurance premium expense | 362 | 245 | 223 | 185 | 138 | 47.8 | 162.3 | |||||||||||||
Other real estate owned expenses, net | (2) | 4 | 1 | 1 | 38 | (150.0) | (105.3) | |||||||||||||
Legal and professional fees | 150 | 428 | 648 | 516 | 662 | (65.0) | (77.3) | |||||||||||||
Merger related expenses | 7,615 | 538 | 377 | — | — | 1,315.4 | — | |||||||||||||
Other noninterest expenses | 1,688 | 1,258 | 1,199 | 1,288 | 1,189 | 34.2 | 42.0 | |||||||||||||
Total noninterest expense | 23,497 | 11,934 | 10,876 | 10,499 | 10,556 | 96.9 | 122.6 | |||||||||||||
Income before income taxes | 3,994 | 6,274 | 5,480 | 5,433 | 5,206 | (36.3) | (23.3) | |||||||||||||
Income tax expense | 1,271 | 1,657 | 1,449 | 1,435 | 1,320 | (23.3) | (3.7) | |||||||||||||
NET INCOME | $ | 2,723 | $ | 4,617 | $ | 4,031 | $ | 3,998 | $ | 3,886 | (41.0) | (29.9) | ||||||||
Weighted average shares outstanding - basic | 17,180 | 11,752 | 11,752 | 11,745 | 12,004 | 46.2 | 43.1 | |||||||||||||
Weighted average shares outstanding - diluted | 17,180 | 11,752 | 11,754 | 11,747 | 12,005 | 46.2 | 43.1 | |||||||||||||
Basic and diluted net income per common share | $ | 0.16 | $ | 0.39 | $ | 0.34 | $ | 0.34 | $ | 0.32 | (59.0) | (50.0) | ||||||||
Dividends paid per common share | 0.12 | 0.12 | 0.12 | 0.12 | 0.12 | — | — | |||||||||||||
Shore Bancshares, Inc. | ||||||||||||||||||||||||||||||
Consolidated Average Balance Sheets By Quarter (Unaudited) | ||||||||||||||||||||||||||||||
(Dollars in thousands) | ||||||||||||||||||||||||||||||
Average balance | ||||||||||||||||||||||||||||||
Q4 2021 | Q4 2021 | |||||||||||||||||||||||||||||
compared to | compared to | |||||||||||||||||||||||||||||
Q4 2021 | Q3 2021 | Q2 2021 | Q1 2021 | Q4 2020 | Q3 2021 | Q4 2020 | ||||||||||||||||||||||||
Average | Yield/ | Average | Yield/ | Average | Yield/ | Average | Yield/ | Average | Yield/ | |||||||||||||||||||||
balance | rate | balance | rate | balance | rate | balance | rate | balance | rate | |||||||||||||||||||||
Earning assets | ||||||||||||||||||||||||||||||
Loans (1), (2), (3) | $ | 1,887,126 | 4.33 | % | $ | 1,487,281 | 4.14 | % | $ | 1,444,684 | 4.00 | % | $ | 1,450,883 | 4.03 | % | $ | 1,430,013 | 4.05 | % | 26.9 | % | 32.0 | % | ||||||
Investment securities | ||||||||||||||||||||||||||||||
Taxable | 468,724 | 1.42 | 334,205 | 1.58 | 286,121 | 1.53 | 227,816 | 1.63 | 179,801 | 2.02 | 40.3 | 160.7 | ||||||||||||||||||
Interest-bearing deposits | 486,247 | 0.14 | 250,019 | 0.15 | 218,704 | 0.10 | 189,231 | 0.10 | 171,040 | 0.10 | 94.5 | 184.3 | ||||||||||||||||||
Total earning assets | 2,842,097 | 3.11 | % | 2,071,505 | 3.24 | % | 1,949,509 | 3.20 | % | 1,867,930 | 3.34 | % | 1,780,854 | 3.47 | % | 37.2 | 59.6 | |||||||||||||
Cash and due from banks | 22,625 | 19,453 | 16,908 | 19,245 | 17,268 | 16.3 | 31.0 | |||||||||||||||||||||||
Other assets | 188,399 | 108,989 | 109,457 | 103,010 | 95,684 | 72.9 | 96.9 | |||||||||||||||||||||||
Allowance for credit losses | (15,859) | (15,499) | (14,660) | (14,234) | (13,357) | 2.3 | 18.7 | |||||||||||||||||||||||
Total assets | $ | 3,037,262 | $ | 2,184,448 | $ | 2,061,214 | $ | 1,975,951 | $ | 1,880,449 | 39.0 | 61.5 | ||||||||||||||||||
Interest-bearing liabilities | ||||||||||||||||||||||||||||||
Demand deposits | $ | 494,081 | 0.14 | % | $ | 462,950 | 0.14 | % | $ | 405,473 | 0.13 | % | $ | 438,340 | 0.14 | % | $ | 420,582 | 0.18 | % | 6.7 | 17.5 | ||||||||
Money market and savings deposits | 925,301 | 0.28 | 644,330 | 0.18 | 605,202 | 0.17 | 510,881 | 0.18 | 459,237 | 0.20 | 43.6 | 101.5 | ||||||||||||||||||
Certificates of deposit $100,000 or more | 174,268 | 0.49 | 136,059 | 0.71 | 135,376 | 1.04 | 130,745 | 1.26 | 128,642 | 1.45 | 28.1 | 35.5 | ||||||||||||||||||
Other time deposits | 173,975 | 0.50 | 142,777 | 0.68 | 143,821 | 0.90 | 144,919 | 1.10 | 145,795 | 1.27 | 21.9 | 19.3 | ||||||||||||||||||
Interest-bearing deposits | 1,767,625 | 0.29 | 1,386,116 | 0.27 | 1,289,872 | 0.33 | 1,224,885 | 0.39 | 1,154,256 | 0.47 | 27.5 | 53.1 | ||||||||||||||||||
Securities sold under retail repurchase agreements | ||||||||||||||||||||||||||||||
and federal funds purchased | 3,972 | 0.30 | 2,718 | 0.29 | 3,123 | 0.26 | 2,238 | 0.18 | 1,101 | 0.36 | 46.1 | 260.8 | ||||||||||||||||||
Advances from FHLB - long-term | 6,630 | 2.21 | — | — | — | — | — | — | — | — | 100.0 | 100.0 | ||||||||||||||||||
Subordinated debt | 36,589 | 5.12 | 24,504 | 5.81 | 24,474 | 6.06 | 24,443 | 5.96 | 24,420 | 6.09 | 49.3 | 49.8 | ||||||||||||||||||
Total interest-bearing liabilities | 1,814,816 | 0.38 | % | 1,413,338 | 0.37 | % | 1,317,469 | 0.43 | % | 1,251,566 | 0.50 | % | 1,179,777 | 0.58 | % | 28.4 | 53.8 | |||||||||||||
Noninterest-bearing deposits | 779,526 | 557,109 | 532,276 | 517,781 | 492,724 | 39.9 | 58.2 | |||||||||||||||||||||||
Accrued expenses and other liabilities | 141,825 | 13,120 | 13,937 | 10,813 | 10,357 | 981.0 | 1,269.4 | |||||||||||||||||||||||
Stockholders' equity | 301,095 | 200,881 | 197,532 | 195,791 | 197,591 | 49.9 | 52.4 | |||||||||||||||||||||||
Total liabilities and stockholders' equity | $ | 3,037,262 | $ | 2,184,448 | $ | 2,061,214 | $ | 1,975,951 | $ | 1,880,449 | 39.0 | 61.5 | ||||||||||||||||||
Net interest spread | 2.73 | % | 2.87 | % | 2.77 | % | 2.84 | % | 2.89 | % | ||||||||||||||||||||
Net interest margin | 2.87 | % | 2.99 | % | 2.91 | % | 3.00 | % | 3.08 | % | ||||||||||||||||||||
____________________ | |
(1) | All amounts are reported on a tax-equivalent basis computed using the statutory federal income tax rate of 21.0%, exclusive of nondeductible interest expense. |
(2) | Average loan balances include nonaccrual loans. |
(3) | Interest income on loans includes accreted loan fees, net of costs and accretion of discounts on acquired loans, which are included in the yield calculations. |
Shore Bancshares, Inc. | ||||||||||||||||||||||
Reconciliation of Generally Accepted Accounting Principles (GAAP) | ||||||||||||||||||||||
and Non-GAAP Measures (Unaudited) | ||||||||||||||||||||||
(In thousands, except per share data) | ||||||||||||||||||||||
YTD | YTD | |||||||||||||||||||||
Q4 2021 | Q3 2021 | Q2 2021 | Q1 2021 | Q4 2020 | 12/31/2021 | 12/31/2020 | ||||||||||||||||
The following reconciles return on average equity and return on average tangible equity (Note 1): | ||||||||||||||||||||||
Net Income | $ | 2,723 | $ | 4,617 | $ | 4,031 | $ | 3,998 | $ | 3,886 | $ | 15,368 | $ | 15,730 | ||||||||
Net Income - annualized (A) | $ | 10,803 | $ | 18,317 | $ | 16,168 | $ | 16,214 | $ | 15,460 | $ | 15,368 | $ | 15,730 | ||||||||
Net income, excluding net amortization of intangible assets | ||||||||||||||||||||||
and merger related expenses | $ | 8,688 | $ | 5,098 | $ | 4,402 | $ | 4,092 | $ | 3,980 | $ | 22,279 | $ | 16,128 | ||||||||
Net income, excluding net amortization of intangible assets - annualized (B) and merger related expenses | $ | 34,469 | $ | 20,226 | $ | 17,656 | $ | 16,595 | $ | 15,833 | $ | 22,279 | $ | 16,128 | ||||||||
Average stockholders' equity (C) | $ | 301,095 | $ | 200,881 | $ | 197,532 | $ | 195,791 | $ | 197,591 | $ | 224,055 | $ | 197,969 | ||||||||
Less: Average goodwill and other intangible assets | (52,692) | (18,942) | (19,053) | (19,178) | (19,304) | (27,535) | (19,498) | |||||||||||||||
Average tangible equity (D) | $ | 248,403 | $ | 181,939 | $ | 178,479 | $ | 176,613 | $ | 178,287 | $ | 196,520 | $ | 178,471 | ||||||||
Return on average equity (GAAP) (A)/(C) | 3.59 | % | 9.12 | % | 8.19 | % | 8.28 | % | 7.82 | % | 6.86 | % | 7.95 | % | ||||||||
Return on average tangible equity (Non-GAAP) (B)/(D) | 13.88 | % | 11.12 | % | 9.89 | % | 9.40 | % | 8.88 | % | 11.34 | % | 9.04 | % | ||||||||
The following reconciles GAAP efficiency ratio and non-GAAP efficiency ratio (Note 2): | ||||||||||||||||||||||
Noninterest expense (E) | $ | 23,497 | $ | 11,934 | $ | 10,876 | $ | 10,499 | $ | 10,556 | $ | 56,806 | $ | 38,399 | ||||||||
Less: Amortization of intangible assets | (381) | (107) | (120) | (126) | (126) | (734) | (533) | |||||||||||||||
Merger Expenses | (7,615) | (538) | (377) | — | — | (8,530) | — | |||||||||||||||
Adjusted noninterest expense (F) | $ | 15,501 | $ | 11,289 | $ | 10,379 | $ | 10,373 | $ | 10,430 | $ | 47,542 | $ | 37,866 | ||||||||
Net interest income (G) | 20,639 | 15,589 | 14,103 | 13,800 | 13,765 | 64,130 | 52,597 | |||||||||||||||
Add: Taxable-equivalent adjustment | 13 | 34 | 38 | 36 | 34 | 121 | 141 | |||||||||||||||
Taxable-equivalent net interest income (H) | $ | 20,652 | $ | 15,623 | $ | 14,141 | $ | 13,836 | $ | 13,799 | $ | 64,251 | $ | 52,738 | ||||||||
Noninterest income (I) | $ | 5,129 | $ | 2,909 | $ | 2,903 | $ | 2,557 | $ | 3,047 | $ | 13,498 | 10,749 | |||||||||
Less: Investment securities (gains) | — | (2) | — | — | — | (2) | (347) | |||||||||||||||
Adjusted noninterest income (J) | $ | 5,129 | $ | 2,907 | $ | 2,903 | $ | 2,557 | $ | 3,047 | $ | 13,496 | $ | 10,402 | ||||||||
Efficiency ratio (GAAP) (E)/(G)+(I) | 91.19 | % | 64.52 | % | 63.95 | % | 64.19 | % | 62.79 | % | 73.18 | % | 60.62 | % | ||||||||
Efficiency ratio (Non-GAAP) (F)/(H)+(J) | 60.13 | % | 60.92 | % | 60.90 | % | 63.28 | % | 61.91 | % | 61.15 | % | 59.97 | % | ||||||||
The following reconciles book value per common share and tangible book value per common share (Note 1): | ||||||||||||||||||||||
Stockholders' equity (L) | $ | 350,693 | $ | 201,607 | $ | 198,682 | $ | 196,104 | $ | 195,019 | ||||||||||||
Less: Goodwill and other intangible assets | (70,956) | (18,883) | (18,991) | (19,111) | (19,237) | |||||||||||||||||
Tangible equity (M) | $ | 279,737 | $ | 182,724 | $ | 179,691 | $ | 176,993 | $ | 175,782 | ||||||||||||
Shares outstanding (N) | 19,808 | 11,752 | 11,752 | 11,752 | 11,783 | |||||||||||||||||
Book value per common share (GAAP) (L)/(N) | $ | 17.71 | $ | 17.15 | $ | 16.91 | $ | 16.69 | $ | 16.55 | ||||||||||||
Tangible book value per common share (Non-GAAP) (M)/(N) | $ | 14.12 | $ | 15.55 | $ | 15.29 | $ | 15.06 | $ | 14.92 | ||||||||||||
The following reconciles equity to assets and tangible equity to tangible assets (Note 1): | ||||||||||||||||||||||
Stockholders' equity (O) | $ | 350,693 | $ | 201,607 | $ | 198,682 | $ | 196,104 | $ | 195,019 | ||||||||||||
Less: Goodwill and other intangible assets | (70,956) | (18,883) | (18,991) | (19,111) | (19,237) | |||||||||||||||||
Tangible equity (P) | $ | 279,737 | $ | 182,724 | $ | 179,691 | $ | 176,993 | $ | 175,782 | ||||||||||||
Assets (Q) | $ | 3,460,416 | $ | 2,260,774 | $ | 2,120,260 | $ | 2,039,631 | $ | 1,933,315 | ||||||||||||
Less: Goodwill and other intangible assets | (70,956) | (18,883) | (18,991) | (19,111) | (19,237) | |||||||||||||||||
Tangible assets (R) | $ | 3,389,460 | $ | 2,241,891 | $ | 2,101,269 | $ | 2,020,520 | $ | 1,914,078 | ||||||||||||
Period-end equity/assets (GAAP) (O)/(Q) | 10.13 | % | 8.92 | % | 9.37 | % | 9.61 | % | 10.09 | % | ||||||||||||
Period-end tangible equity/tangible assets (Non-GAAP) (P)/(R) | 8.25 | % | 8.15 | % | 8.55 | % | 8.76 | % | 9.18 | % | ||||||||||||
____________________ |
Note 1: Management believes that reporting tangible equity and tangible assets more closely approximates the adequacy of capital for regulatory purposes. |
Note 2: Management believes that reporting the non-GAAP efficiency ratio more closely measures its effectiveness of controlling cash-based operating activities. |
View original content to download multimedia:https://www.prnewswire.com/news-releases/shore-bancshares-reports-2021-financial-results-and-quarterly-dividend-of-0-12-per-share-301481966.html
SOURCE Shore Bancshares, Inc.
 federal reserve
pandemic
press-release
federal reserve
pandemic
press-release
Government
Rand Paul Teases Senate GOP Leader Run – Musk Says “I Would Support”
Rand Paul Teases Senate GOP Leader Run – Musk Says "I Would Support"
Republican Kentucky Senator Rand Paul on Friday hinted that he may jump…
Share this:


Republican Kentucky Senator Rand Paul on Friday hinted that he may jump into the race to become the next Senate GOP leader, and Elon Musk was quick to support the idea. Republicans must find a successor for periodically malfunctioning Mitch McConnell, who recently announced he'll step down in November, though intending to keep his Senate seat until his term ends in January 2027, when he'd be within weeks of turning 86.
So far, the announced field consists of two quintessential establishment types: John Cornyn of Texas and John Thune of South Dakota. While John Barrasso's name had been thrown around as one of "The Three Johns" considered top contenders, the Wyoming senator on Tuesday said he'll instead seek the number two slot as party whip.
Paul used X to tease his potential bid for the position which -- if the GOP takes back the upper chamber in November -- could graduate from Minority Leader to Majority Leader. He started by telling his 5.1 million followers he'd had lots of people asking him about his interest in running...
Thousands of people have been asking if I'd run for Senate leadership...
— Rand Paul (@RandPaul) March 8, 2024
...then followed up with a poll in which he predictably annihilated Cornyn and Thune, taking a 96% share as of Friday night, with the other two below 2% each.
????????️VOTE NOW ????️ ???? Who would you like to be the next Senate leader?
— Rand Paul (@RandPaul) March 8, 2024
Elon Musk was quick to back the idea of Paul as GOP leader, while daring Cornyn and Thune to follow Paul's lead by throwing their names out for consideration by the Twitter-verse X-verse.
I would support Rand Paul and suspect that other candidates will not actually run polls out of concern for the results, but let’s see if they will!
— Elon Musk (@elonmusk) March 8, 2024
Paul has been a stalwart opponent of security-state mass surveillance, foreign interventionism -- to include shoveling billions of dollars into the proxy war in Ukraine -- and out-of-control spending in general. He demonstrated the latter passion on the Senate floor this week as he ridiculed the latest kick-the-can spending package:
This bill is an insult to the American people. The earmarks are all the wasteful spending that you could ever hope to see, and it should be defeated. Read more: https://t.co/Jt8K5iucA4 pic.twitter.com/I5okd4QgDg
— Senator Rand Paul (@SenRandPaul) March 8, 2024
In February, Paul used Senate rules to force his colleagues into a grueling Super Bowl weekend of votes, as he worked to derail a $95 billion foreign aid bill. "I think we should stay here as long as it takes,” said Paul. “If it takes a week or a month, I’ll force them to stay here to discuss why they think the border of Ukraine is more important than the US border.”
Don't expect a Majority Leader Paul to ditch the filibuster -- he's been a hardy user of the legislative delay tactic. In 2013, he spoke for 13 hours to fight the nomination of John Brennan as CIA director. In 2015, he orated for 10-and-a-half-hours to oppose extension of the Patriot Act.
Among the general public, Paul is probably best known as Capitol Hill's chief tormentor of Dr. Anthony Fauci, who was director of the National Institute of Allergy and Infectious Disease during the Covid-19 pandemic. Paul says the evidence indicates the virus emerged from China's Wuhan Institute of Virology. He's accused Fauci and other members of the US government public health apparatus of evading questions about their funding of the Chinese lab's "gain of function" research, which takes natural viruses and morphs them into something more dangerous. Paul has pointedly said that Fauci committed perjury in congressional hearings and that he belongs in jail "without question."
Musk is neither the only nor the first noteworthy figure to back Paul for party leader. Just hours after McConnell announced his upcoming step-down from leadership, independent 2024 presidential candidate Robert F. Kennedy, Jr voiced his support:
Mitch McConnell, who has served in the Senate for almost 40 years, announced he'll step down this November.
— Robert F. Kennedy Jr (@RobertKennedyJr) February 28, 2024
Part of public service is about knowing when to usher in a new generation. It’s time to promote leaders in Washington, DC who won’t kowtow to the military contractors or…
In a testament to the extent to which the establishment recoils at the libertarian-minded Paul, mainstream media outlets -- which have been quick to report on other developments in the majority leader race -- pretended not to notice that Paul had signaled his interest in the job. More than 24 hours after Paul's test-the-waters tweet-fest began, not a single major outlet had brought it to the attention of their audience.
That may be his strongest endorsement yet.
Government
The Great Replacement Loophole: Illegal Immigrants Score 5-Year Work Benefit While “Waiting” For Deporation, Asylum
The Great Replacement Loophole: Illegal Immigrants Score 5-Year Work Benefit While "Waiting" For Deporation, Asylum
Over the past several…
Share this:


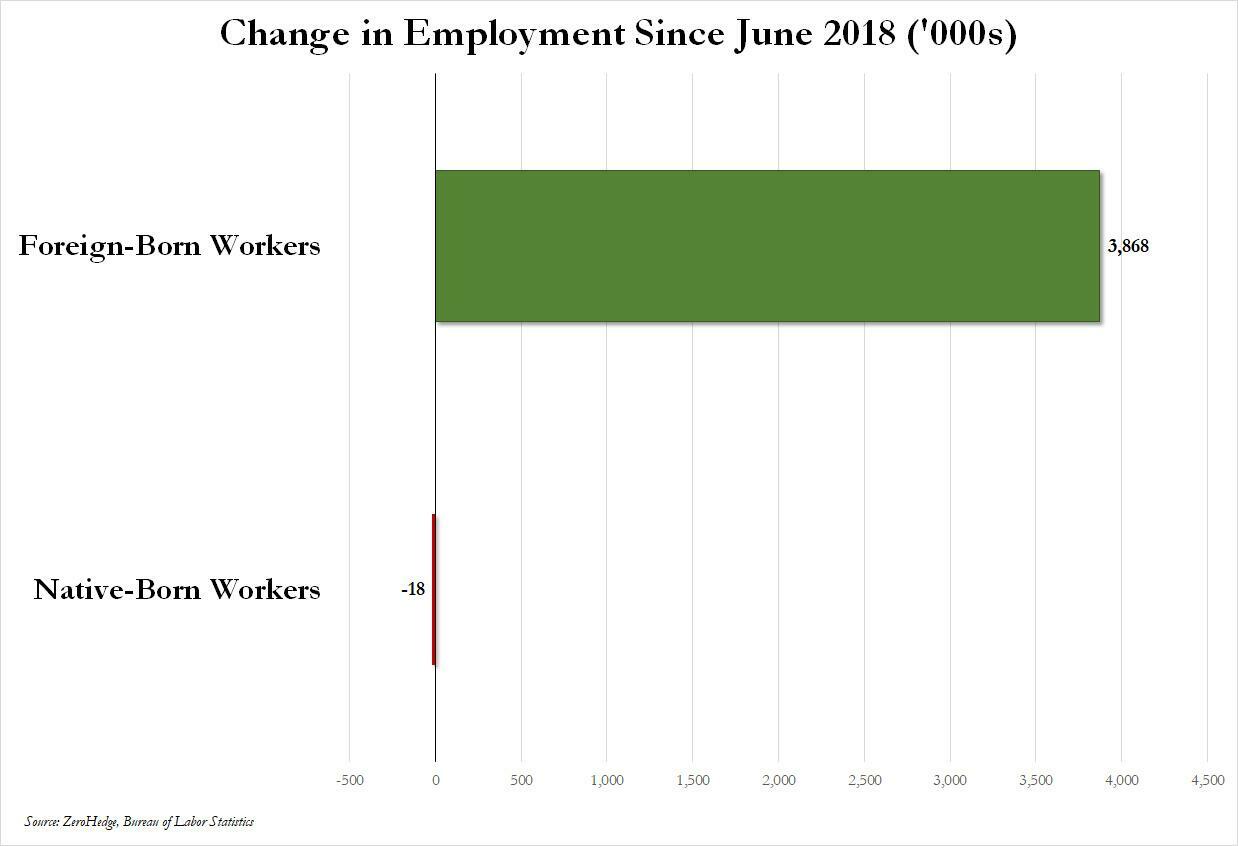
Over the past several months we've pointed out that there has been zero job creation for native-born workers since the summer of 2018...
... and that since Joe Biden was sworn into office, most of the post-pandemic job gains the administration continuously brags about have gone foreign-born (read immigrants, mostly illegal ones) workers.
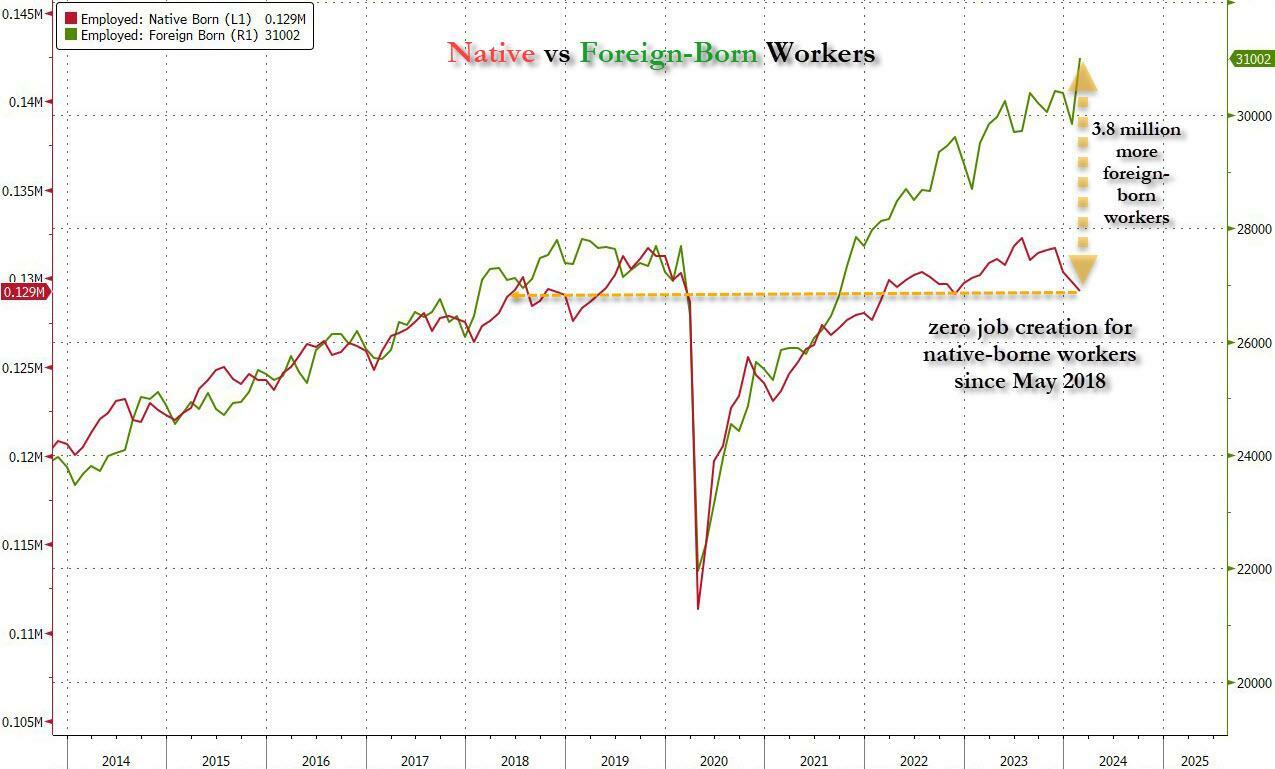
And while the left might find this data almost as verboten as FBI crime statistics - as it directly supports the so-called "great replacement theory" we're not supposed to discuss - it also coincides with record numbers of illegal crossings into the United States under Biden.
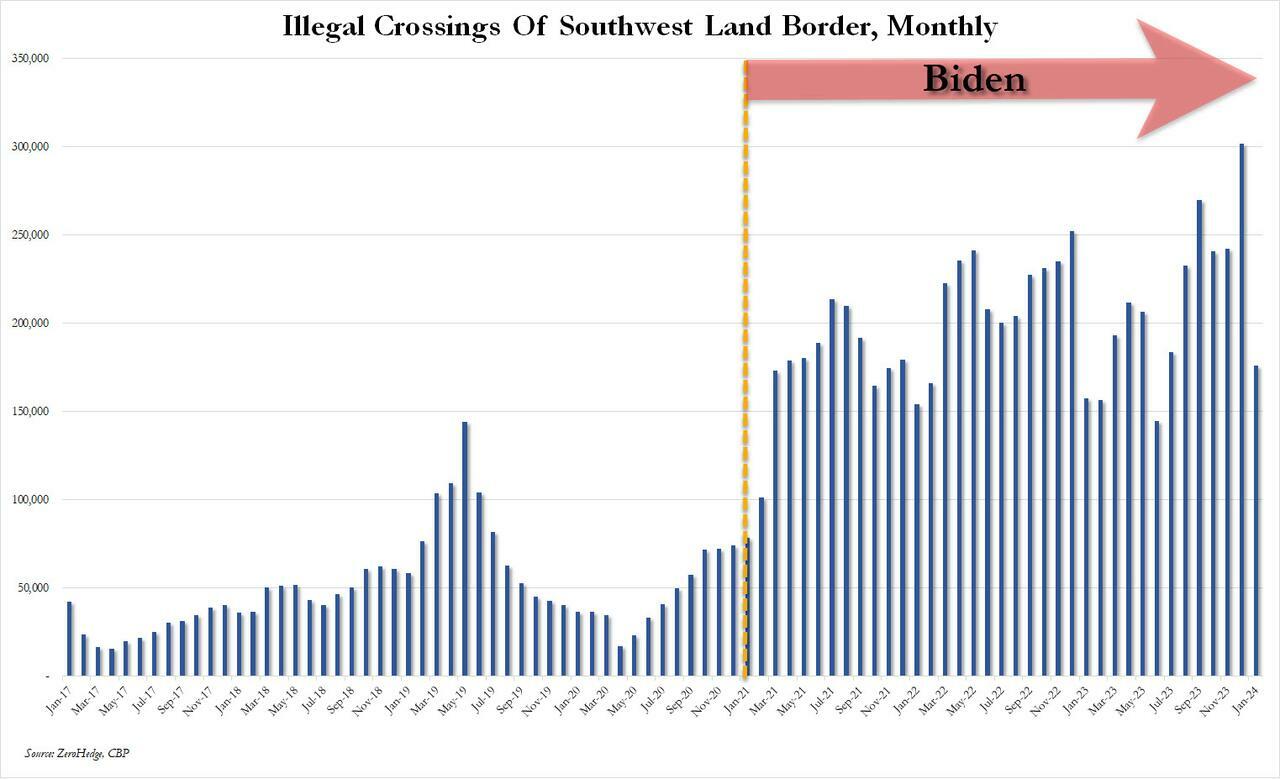
In short, the Biden administration opened the floodgates, 10 million illegal immigrants poured into the country, and most of the post-pandemic "jobs recovery" went to foreign-born workers, of which illegal immigrants represent the largest chunk.

'But Tyler, illegal immigrants can't possibly work in the United States whilst awaiting their asylum hearings,' one might hear from the peanut gallery. On the contrary: ever since Biden reversed a key aspect of Trump's labor policies, all illegal immigrants - even those awaiting deportation proceedings - have been given carte blanche to work while awaiting said proceedings for up to five years...
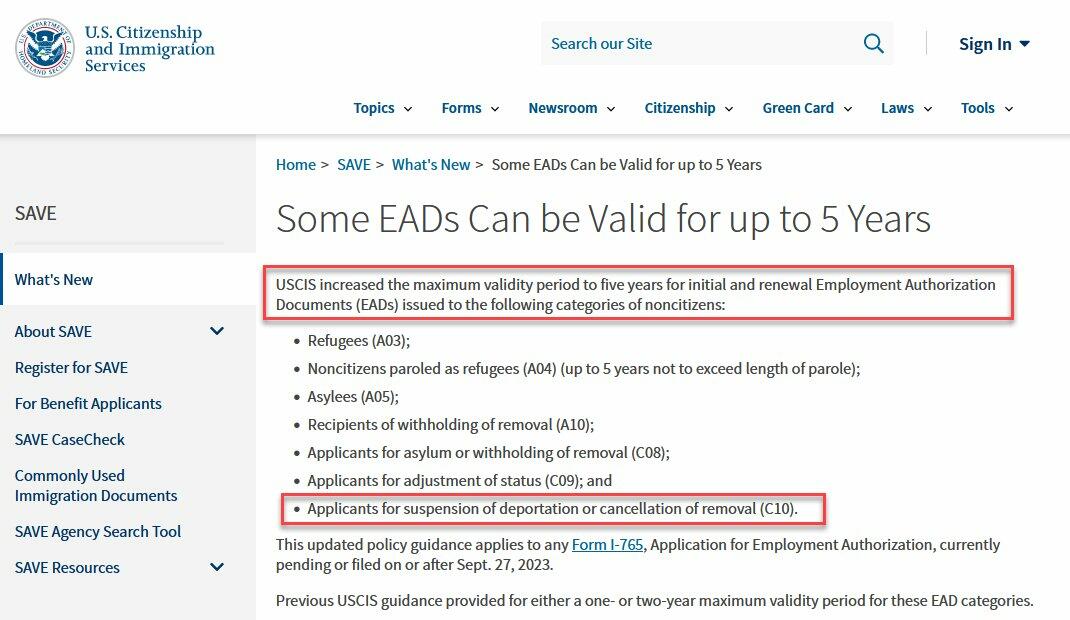
... something which even Elon Musk was shocked to learn.
Wow, learn something new every day https://t.co/8MDtEEZGam
— Elon Musk (@elonmusk) March 10, 2024
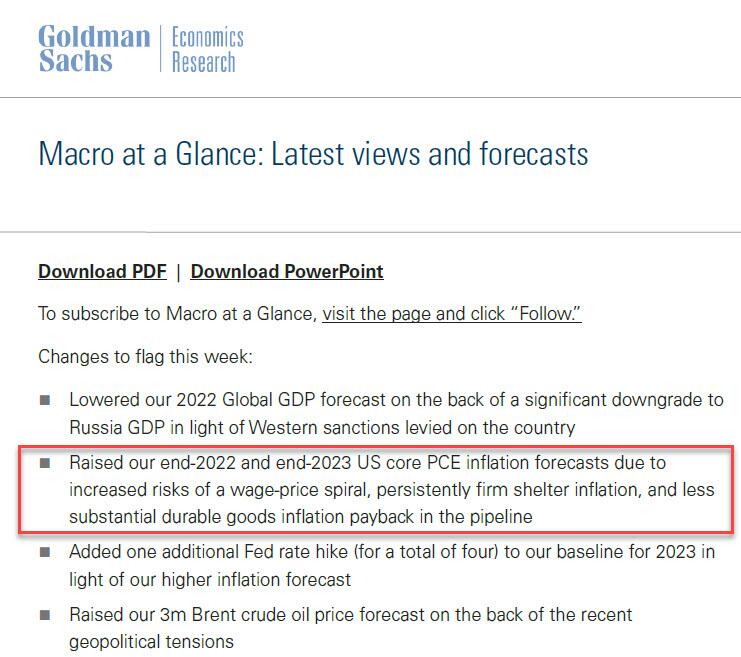
Which leads us to another question: recall that the primary concern for the Biden admin for much of 2022 and 2023 was soaring prices, i.e., relentless inflation in general, and rising wages in particular, which in turn prompted even Goldman to admit two years ago that the diabolical wage-price spiral had been unleashed in the US (diabolical, because nothing absent a major economic shock, read recession or depression, can short-circuit it once it is in place).
Well, there is one other thing that can break the wage-price spiral loop: a flood of ultra-cheap illegal immigrant workers. But don't take our word for it: here is Fed Chair Jerome Powell himself during his February 60 Minutes interview:
PELLEY: Why was immigration important?
POWELL: Because, you know, immigrants come in, and they tend to work at a rate that is at or above that for non-immigrants. Immigrants who come to the country tend to be in the workforce at a slightly higher level than native Americans do. But that's largely because of the age difference. They tend to skew younger.
PELLEY: Why is immigration so important to the economy?
POWELL: Well, first of all, immigration policy is not the Fed's job. The immigration policy of the United States is really important and really much under discussion right now, and that's none of our business. We don't set immigration policy. We don't comment on it.
I will say, over time, though, the U.S. economy has benefited from immigration. And, frankly, just in the last, year a big part of the story of the labor market coming back into better balance is immigration returning to levels that were more typical of the pre-pandemic era.
PELLEY: The country needed the workers.
POWELL: It did. And so, that's what's been happening.
Translation: Immigrants work hard, and Americans are lazy. But much more importantly, since illegal immigrants will work for any pay, and since Biden's Department of Homeland Security, via its Citizenship and Immigration Services Agency, has made it so illegal immigrants can work in the US perfectly legally for up to 5 years (if not more), one can argue that the flood of illegals through the southern border has been the primary reason why inflation - or rather mostly wage inflation, that all too critical component of the wage-price spiral - has moderated in in the past year, when the US labor market suddenly found itself flooded with millions of perfectly eligible workers, who just also happen to be illegal immigrants and thus have zero wage bargaining options.
None of this is to suggest that the relentless flood of immigrants into the US is not also driven by voting and census concerns - something Elon Musk has been pounding the table on in recent weeks, and has gone so far to call it "the biggest corruption of American democracy in the 21st century", but in retrospect, one can also argue that the only modest success the Biden admin has had in the past year - namely bringing inflation down from a torrid 9% annual rate to "only" 3% - has also been due to the millions of illegals he's imported into the country.
We would be remiss if we didn't also note that this so often carries catastrophic short-term consequences for the social fabric of the country (the Laken Riley fiasco being only the latest example), not to mention the far more dire long-term consequences for the future of the US - chief among them the trillions of dollars in debt the US will need to incur to pay for all those new illegal immigrants Democrat voters and low-paid workers. This is on top of the labor revolution that will kick in once AI leads to mass layoffs among high-paying, white-collar jobs, after which all those newly laid off native-born workers hoping to trade down to lower paying (if available) jobs will discover that hardened criminals from Honduras or Guatemala have already taken them, all thanks to Joe Biden.
Spread & Containment
‘I couldn’t stand the pain’: the Turkish holiday resort that’s become an emergency dental centre for Britons who can’t get treated at home
The crisis in NHS dentistry is driving increasing numbers abroad for treatment. Here are some of their stories.
Share this:


It’s a hot summer day in the Turkish city of Antalya, a Mediterranean resort with golden beaches, deep blue sea and vibrant nightlife. The pool area of the all-inclusive resort is crammed with British people on sun loungers – but they aren’t here for a holiday. This hotel is linked to a dental clinic that organises treatment packages, and most of these guests are here to see a dentist.
From Norwich, two women talk about gums and injections. A man from Wales holds a tissue close to his mouth and spits blood – he has just had two molars extracted.
The dental clinic organises everything for these dental “tourists” throughout their treatment, which typically lasts from three to 15 days. The stories I hear of what has caused them to travel to Turkey are strikingly similar: all have struggled to secure dental treatment at home on the NHS.
“The hotel is nice and some days I go to the beach,” says Susan*, a hairdresser in her mid-30s from Norwich. “But really, we aren’t tourists like in a proper holiday. We come here because we have no choice. I couldn’t stand the pain.”

This is Susan’s second visit to Antalya. She explains that her ordeal started two years earlier:
I went to an NHS dentist who told me I had gum disease … She did some cleaning to my teeth and gums but it got worse. When I ate, my teeth were moving … the gums were bleeding and it was very painful. I called to say I was in pain but the clinic was not accepting NHS patients any more.
The only option the dentist offered Susan was to register as a private patient:
I asked how much. They said £50 for x-rays and then if the gum disease got worse, £300 or so for extraction. Four of them were moving – imagine: £1,200 for losing your teeth! Without teeth I’d lose my clients, but I didn’t have the money. I’m a single mum. I called my mum and cried.
Susan’s mother told her about a friend of hers who had been to Turkey for treatment, then together they found a suitable clinic:
The prices are so much cheaper! Tooth extraction, x-rays, consultations – it all comes included. The flight and hotel for seven days cost the same as losing four teeth in Norwich … I had my lower teeth removed here six months ago, now I’ve got implants … £2,800 for everything – hotel, transfer, treatments. I only paid the flights separately.
In the UK, roughly half the adult population suffers from periodontitis – inflammation of the gums caused by plaque bacteria that can lead to irreversible loss of gums, teeth, and bone. Regular reviews by a dentist or hygienist are required to manage this condition. But nine out of ten dental practices cannot offer NHS appointments to new adult patients, while eight in ten are not accepting new child patients.
Some UK dentists argue that Britons who travel abroad for treatment do so mainly for cosmetic procedures. They warn that dental tourism is dangerous, and that if their treatment goes wrong, dentists in the UK will be unable to help because they don’t want to be responsible for further damage. Susan shrugs this off:
Dentists in England say: ‘If you go to Turkey, we won’t touch you [afterwards].’ But I don’t worry because there are no appointments at home anyway. They couldn’t help in the first place, and this is why we are in Turkey.
‘How can we pay all this money?’
As a social anthropologist, I travelled to Turkey a number of times in 2023 to investigate the crisis of NHS dentistry, and the journeys abroad that UK patients are increasingly making as a result. I have relatives in Istanbul and have been researching migration and trading patterns in Turkey’s largest city since 2016.
In August 2023, I visited the resort in Antalya, nearly 400 miles south of Istanbul. As well as Susan, I met a group from a village in Wales who said there was no provision of NHS dentistry back home. They had organised a two-week trip to Turkey: the 12-strong group included a middle-aged couple with two sons in their early 20s, and two couples who were pensioners. By going together, Anya tells me, they could support each other through their different treatments:
I’ve had many cavities since I was little … Before, you could see a dentist regularly – you didn’t even think about it. If you had pain or wanted a regular visit, you phoned and you went … That was in the 1990s, when I went to the dentist maybe every year.
Anya says that once she had children, her family and work commitments meant she had no time to go to the dentist. Then, years later, she started having serious toothache:
Every time I chewed something, it hurt. I ate soups and soft food, and I also lost weight … Even drinking was painful – tea: pain, cold water: pain. I was taking paracetamol all the time! I went to the dentist to fix all this, but there were no appointments.
Anya was told she would have to wait months, or find a dentist elsewhere:
A private clinic gave me a list of things I needed done. Oh my God, almost £6,000. My husband went too – same story. How can we pay all this money? So we decided to come to Turkey. Some people we know had been here, and others in the village wanted to come too. We’ve brought our sons too – they also need to be checked and fixed. Our whole family could be fixed for less than £6,000.
By the time they travelled, Anya’s dental problems had turned into a dental emergency. She says she could not live with the pain anymore, and was relying on paracetamol.
In 2023, about 6 million adults in the UK experienced protracted pain (lasting more than two weeks) caused by toothache. Unintentional paracetamol overdose due to dental pain is a significant cause of admissions to acute medical units. If left untreated, tooth infections can spread to other parts of the body and cause life-threatening complications – and on rare occasions, death.
In February 2024, police were called to manage hundreds of people queuing outside a newly opened dental clinic in Bristol, all hoping to be registered or seen by an NHS dentist. One in ten Britons have admitted to performing “DIY dentistry”, of which 20% did so because they could not find a timely appointment. This includes people pulling out their teeth with pliers and using superglue to repair their teeth.
In the 1990s, dentistry was almost entirely provided through NHS services, with only around 500 solely private dentists registered. Today, NHS dentist numbers in England are at their lowest level in a decade, with 23,577 dentists registered to perform NHS work in 2022-23, down 695 on the previous year. Furthermore, the precise division of NHS and private work that each dentist provides is not measured.
The COVID pandemic created longer waiting lists for NHS treatment in an already stretched public service. In Bridlington, Yorkshire, people are now reportedly having to wait eight-to-nine years to get an NHS dental appointment with the only remaining NHS dentist in the town.
In his book Patients of the State (2012), Argentine sociologist Javier Auyero describes the “indignities of waiting”. It is the poor who are mostly forced to wait, he writes. Queues for state benefits and public services constitute a tangible form of power over the marginalised. There is an ethnic dimension to this story, too. Data suggests that in the UK, patients less likely to be effective in booking an NHS dental appointment are non-white ethnic groups and Gypsy or Irish travellers, and that it is particularly challenging for refugees and asylum-seekers to access dental care.

This article is part of Conversation Insights
The Insights team generates long-form journalism derived from interdisciplinary research. The team is working with academics from different backgrounds who have been engaged in projects aimed at tackling societal and scientific challenges.
In 2022, I experienced my own dental emergency. An infected tooth was causing me debilitating pain, and needed root canal treatment. I was advised this would cost £71 on the NHS, plus £307 for a follow-up crown – but that I would have to wait months for an appointment. The pain became excruciating – I could not sleep, let alone wait for months. In the same clinic, privately, I was quoted £1,300 for the treatment (more than half my monthly income at the time), or £295 for a tooth extraction.
I did not want to lose my tooth because of lack of money. So I bought a flight to Istanbul immediately for the price of the extraction in the UK, and my tooth was treated with root canal therapy by a private dentist there for £80. Including the costs of travelling, the total was a third of what I was quoted to be treated privately in the UK. Two years on, my treated tooth hasn’t given me any more problems.
A better quality of life
Not everyone is in Antalya for emergency procedures. The pensioners from Wales had contacted numerous clinics they found on the internet, comparing prices, treatments and hotel packages at least a year in advance, in a carefully planned trip to get dental implants – artificial replacements for tooth roots that help support dentures, crowns and bridges.

In Turkey, all the dentists I speak to (most of whom cater mainly for foreigners, including UK nationals) consider implants not a cosmetic or luxurious treatment, but a development in dentistry that gives patients who are able to have the procedure a much better quality of life. This procedure is not available on the NHS for most of the UK population, and the patients I meet in Turkey could not afford implants in private clinics back home.
Paul is in Antalya to replace his dentures, which have become uncomfortable and irritating to his gums, with implants. He says he couldn’t find an appointment to see an NHS dentist. His wife Sonia went through a similar procedure the year before and is very satisfied with the results, telling me: “Why have dentures that you need to put in a glass overnight, in the old style? If you can have implants, I say, you’re better off having them.”
Most of the dental tourists I meet in Antalya are white British: this city, known as the Turkish Riviera, has developed an entire economy catering to English-speaking tourists. In 2023, more than 1.3 million people visited the city from the UK, up almost 15% on the previous year.
Read more: NHS dentistry is in crisis – are overseas dentists the answer?
In contrast, the Britons I meet in Istanbul are predominantly from a non-white ethnic background. Omar, a pensioner of Pakistani origin in his early 70s, has come here after waiting “half a year” for an NHS appointment to fix the dental bridge that is causing him pain. Omar’s son had been previously for a hair transplant, and was offered a free dental checkup by the same clinic, so he suggested it to his father. Having worked as a driver for a manufacturing company for two decades in Birmingham, Omar says he feels disappointed to have contributed to the British economy for so long, only to be “let down” by the NHS:
At home, I must wait and wait and wait to get a bridge – and then I had many problems with it. I couldn’t eat because the bridge was uncomfortable and I was in pain, but there were no appointments on the NHS. I asked a private dentist and they recommended implants, but they are far too expensive [in the UK]. I started losing weight, which is not a bad thing at the beginning, but then I was worrying because I couldn’t chew and eat well and was losing more weight … Here in Istanbul, I got dental implants – US$500 each, problem solved! In England, each implant is maybe £2,000 or £3,000.
In the waiting area of another clinic in Istanbul, I meet Mariam, a British woman of Iraqi background in her late 40s, who is making her second visit to the dentist here. Initially, she needed root canal therapy after experiencing severe pain for weeks. Having been quoted £1,200 in a private clinic in outer London, Mariam decided to fly to Istanbul instead, where she was quoted £150 by a dentist she knew through her large family. Even considering the cost of the flight, Mariam says the decision was obvious:
Dentists in England are so expensive and NHS appointments so difficult to find. It’s awful there, isn’t it? Dentists there blamed me for my rotten teeth. They say it’s my fault: I don’t clean or I ate sugar, or this or that. I grew up in a village in Iraq and didn’t go to the dentist – we were very poor. Then we left because of war, so we didn’t go to a dentist … When I arrived in London more than 20 years ago, I didn’t speak English, so I still didn’t go to the dentist … I think when you move from one place to another, you don’t go to the dentist unless you are in real, real pain.
In Istanbul, Mariam has opted not only for the urgent root canal treatment but also a longer and more complex treatment suggested by her consultant, who she says is a renowned doctor from Syria. This will include several extractions and implants of back and front teeth, and when I ask what she thinks of achieving a “Hollywood smile”, Mariam says:
Who doesn’t want a nice smile? I didn’t come here to be a model. I came because I was in pain, but I know this doctor is the best for implants, and my front teeth were rotten anyway.
Dentists in the UK warn about the risks of “overtreatment” abroad, but Mariam appears confident that this is her opportunity to solve all her oral health problems. Two of her sisters have already been through a similar treatment, so they all trust this doctor.

The UK’s ‘dental deserts’
To get a fuller understanding of the NHS dental crisis, I’ve also conducted 20 interviews in the UK with people who have travelled or were considering travelling abroad for dental treatment.
Joan, a 50-year-old woman from Exeter, tells me she considered going to Turkey and could have afforded it, but that her back and knee problems meant she could not brave the trip. She has lost all her lower front teeth due to gum disease and, when I meet her, has been waiting 13 months for an NHS dental appointment. Joan tells me she is living in “shame”, unable to smile.
In the UK, areas with extremely limited provision of NHS dental services – known as as “dental deserts” – include densely populated urban areas such as Portsmouth and Greater Manchester, as well as many rural and coastal areas.
In Felixstowe, the last dentist taking NHS patients went private in 2023, despite the efforts of the activist group Toothless in Suffolk to secure better access to NHS dentists in the area. It’s a similar story in Ripon, Yorkshire, and in Dumfries & Galloway, Scotland, where nearly 25,000 patients have been de-registered from NHS dentists since 2021.
Data shows that 2 million adults must travel at least 40 miles within the UK to access dental care. Branding travel for dental care as “tourism” carries the risk of disguising the elements of duress under which patients move to restore their oral health – nationally and internationally. It also hides the immobility of those who cannot undertake such journeys.
The 90-year-old woman in Dumfries & Galloway who now faces travelling for hours by bus to see an NHS dentist can hardly be considered “tourism” – nor the Ukrainian war refugees who travelled back from West Sussex and Norwich to Ukraine, rather than face the long wait to see an NHS dentist.
Many people I have spoken to cannot afford the cost of transport to attend dental appointments two hours away – or they have care responsibilities that make it impossible. Instead, they are forced to wait in pain, in the hope of one day securing an appointment closer to home.

‘Your crisis is our business’
The indignities of waiting in the UK are having a big impact on the lives of some local and foreign dentists in Turkey. Some neighbourhoods are rapidly changing as dental and other health clinics, usually in luxurious multi-storey glass buildings, mushroom. In the office of one large Istanbul medical complex with sections for hair transplants and dentistry (plus one linked to a hospital for more extensive cosmetic surgery), its Turkish owner and main investor tells me:
Your crisis is our business, but this is a bazaar. There are good clinics and bad clinics, and unfortunately sometimes foreign patients do not know which one to choose. But for us, the business is very good.
This clinic only caters to foreign patients. The owner, an architect by profession who also developed medical clinics in Brazil, describes how COVID had a major impact on his business:
When in Europe you had COVID lockdowns, Turkey allowed foreigners to come. Many people came for ‘medical tourism’ – we had many patients for cosmetic surgery and hair transplants. And that was when the dental business started, because our patients couldn’t see a dentist in Germany or England. Then more and more patients started to come for dental treatments, especially from the UK and Ireland. For them, it’s very, very cheap here.
The reasons include the value of the Turkish lira relative to the British pound, the low cost of labour, the increasing competition among Turkish clinics, and the sheer motivation of dentists here. While most dentists catering to foreign patients are from Turkey, others have arrived seeking refuge from war and violence in Syria, Iraq, Afghanistan, Iran and beyond. They work diligently to rebuild their lives, careers and lost wealth.
Regardless of their origin, all dentists in Turkey must be registered and certified. Hamed, a Syrian dentist and co-owner of a new clinic in Istanbul catering to European and North American patients, tells me:
I know that you say ‘Syrian’ and people think ‘migrant’, ‘refugee’, and maybe think ‘how can this dentist be good?’ – but Syria, before the war, had very good doctors and dentists. Many of us came to Turkey and now I have a Turkish passport. I had to pass the exams to practise dentistry here – I study hard. The exams are in Turkish and they are difficult, so you cannot say that Syrian doctors are stupid.
Hamed talks excitedly about the latest technology that is coming to his profession: “There are always new materials and techniques, and we cannot stop learning.” He is about to travel to Paris to an international conference:
I can say my techniques are very advanced … I bet I put more implants and do more bone grafting and surgeries every week than any dentist you know in England. A good dentist is about practice and hand skills and experience. I work hard, very hard, because more and more patients are arriving to my clinic, because in England they don’t find dentists.

While there is no official data about the number of people travelling from the UK to Turkey for dental treatment, investors and dentists I speak to consider that numbers are rocketing. From all over the world, Turkey received 1.2 million visitors for “medical tourism” in 2022, an increase of 308% on the previous year. Of these, about 250,000 patients went for dentistry. One of the most renowned dental clinics in Istanbul had only 15 British patients in 2019, but that number increased to 2,200 in 2023 and is expected to reach 5,500 in 2024.
Like all forms of medical care, dental treatments carry risks. Most clinics in Turkey offer a ten-year guarantee for treatments and a printed clinical history of procedures carried out, so patients can show this to their local dentists and continue their regular annual care in the UK. Dental treatments, checkups and maintaining a good oral health is a life-time process, not a one-off event.
Many UK patients, however, are caught between a rock and a hard place – criticised for going abroad, yet unable to get affordable dental care in the UK before and after their return. The British Dental Association has called for more action to inform these patients about the risks of getting treated overseas – and has warned UK dentists about the legal implications of treating these patients on their return. But this does not address the difficulties faced by British patients who are being forced to go abroad in search of affordable, often urgent dental care.
A global emergency
The World Health Organization states that the explosion of oral disease around the world is a result of the “negligent attitude” that governments, policymakers and insurance companies have towards including oral healthcare under the umbrella of universal healthcare. It as if the health of our teeth and mouth is optional; somehow less important than treatment to the rest of our body. Yet complications from untreated tooth decay can lead to hospitalisation.
The main causes of oral health diseases are untreated tooth decay, severe gum disease, toothlessness, and cancers of the lip and oral cavity. Cases grew during the pandemic, when little or no attention was paid to oral health. Meanwhile, the global cosmetic dentistry market is predicted to continue growing at an annual rate of 13% for the rest of this decade, confirming the strong relationship between socioeconomic status and access to oral healthcare.
In the UK since 2018, there have been more than 218,000 admissions to hospital for rotting teeth, of which more than 100,000 were children. Some 40% of children in the UK have not seen a dentist in the past 12 months. The role of dentists in prevention of tooth decay and its complications, and in the early detection of mouth cancer, is vital. While there is a 90% survival rate for mouth cancer if spotted early, the lack of access to dental appointments is causing cases to go undetected.
The reasons for the crisis in NHS dentistry are complex, but include: the real-term cuts in funding to NHS dentistry; the challenges of recruitment and retention of dentists in rural and coastal areas; pay inequalities facing dental nurses, most of them women, who are being badly hit by the cost of living crisis; and, in England, the 2006 Dental Contract that does not remunerate dentists in a way that encourages them to continue seeing NHS patients.
The UK is suffering a mass exodus of the public dentistry workforce, with workers leaving the profession entirely or shifting to the private sector, where payments and life-work balance are better, bureaucracy is reduced, and prospects for career development look much better. A survey of general dental practitioners found that around half have reduced their NHS work since the pandemic – with 43% saying they were likely to go fully private, and 42% considering a career change or taking early retirement.
Reversing the UK’s dental crisis requires more commitment to substantial reform and funding than the “recovery plan” announced by Victoria Atkins, the secretary of state for health and social care, on February 7.
The stories I have gathered show that people travelling abroad for dental treatment don’t see themselves as “tourists” or vanity-driven consumers of the “Hollywood smile”. Rather, they have been forced by the crisis in NHS dentistry to seek out a service 1,500 miles away in Turkey that should be a basic, affordable right for all, on their own doorstep.
*Names in this article have been changed to protect the anonymity of the interviewees.

For you: more from our Insights series:
GP crisis: how did things go so wrong, and what needs to change?
Insomnia: how chronic sleep problems can lead to a spiralling decline in mental health
To hear about new Insights articles, join the hundreds of thousands of people who value The Conversation’s evidence-based news. Subscribe to our newsletter.
Diana Ibanez Tirado receives funding from the School of Global Studies, University of Sussex.
pound pandemic treatment therapy spread recovery iran brazil european europe uk germany ukraine world health organization

Veterans Affairs Kept COVID-19 Vaccine Mandate In Place Without Evidence


The Coming Of The Police State In America


Beloved mall retailer files Chapter 7 bankruptcy, will liquidate


February Employment Situation


Low Iron Levels In Blood Could Trigger Long COVID: Study


Walmart has really good news for shoppers (and Joe Biden)


Another beloved brewery files Chapter 11 bankruptcy


‘I couldn’t stand the pain’: the Turkish holiday resort that’s become an emergency dental centre for Britons who can’t get treated at home


Rand Paul Teases Senate GOP Leader Run – Musk Says “I Would Support”
Walmart joins Costco in sharing key pricing news
-

 Uncategorized2 weeks ago
All Of The Elements Are In Place For An Economic Crisis Of Staggering Proportions
-

 Uncategorized1 month ago
Cathie Wood sells a major tech stock (again)
-

 Uncategorized3 weeks ago
California Counties Could Be Forced To Pay $300 Million To Cover COVID-Era Program
-

 Uncategorized2 weeks ago
Apparel Retailer Express Moving Toward Bankruptcy
-

 Uncategorized3 weeks ago
Industrial Production Decreased 0.1% in January
-

 International3 days ago
Walmart launches clever answer to Target’s new membership program
-

 International3 days ago
EyePoint poaches medical chief from Apellis; Sandoz CFO, longtime BioNTech exec to retire
-

 Uncategorized3 weeks ago
RFK Jr: The Wuhan Cover-Up & The Rise Of The Biowarfare-Industrial Complex