Connect with us

Uncategorized

Scientists researched on finite-time anti-saturated proximity control with a tumbling non-cooperative space target

The past few decades have witnessed the burgeoning development of on-orbit servicing in light of various meaningful space applications such as repair of…

Published

on

The past few decades have witnessed the burgeoning development of on-orbit servicing in light of various meaningful space applications such as repair of malfunctioning satellites, debris removal, on-orbit assembly, and so on. As for the orbit-servicing targets, they are usually divided into 2 categories, i.e., cooperative and non-cooperative ones, based on whether the space targets have active cross-link communication and cooperative identifiers with the servicing spacecraft or not. Before executing the orbit-servicing task, close-range rendezvous and proximity is an inevitable process in which precise observation for the orbit-servicing target is implemented to determine the docking ports and time (for the cooperative target) or capture ports and time (for the non-cooperative target). Thus, highly reliable and precise rendezvous and proximity control methods are essential to guarantee the safety and success of the on-orbit servicing task. As for non-cooperative target, a particular quantitative performance bound technique, prescribed performance control (PPC), was proposed and has attracted wide attention in the control system design. By the user’s specific choice for the parameters of the performance function, the finite-time or appointed-time convergence can be achieved for the controlled systems. However, a major defect in the aforementioned PPC control methods should be considered in practical engineering, that is, the actuator saturation induced by high sensitivity to the performance bounds. In a research paper recently published in Space: Science & Technology, scholars from Central South University, Intelligent Science & Technology Academy Limited of CASIC, and University of Strathclyde propose a brand-new anti-saturated appointed-time pose tracking control method for spacecraft rendezvous with a tumbling non-cooperative target, in which a novel appointed-time convergent performance function whose initial derivative is zero and an anti-saturated pose tracking controller with an adaptive saturation compensator are developed.

Credit: Space: Science & Technology

The past few decades have witnessed the burgeoning development of on-orbit servicing in light of various meaningful space applications such as repair of malfunctioning satellites, debris removal, on-orbit assembly, and so on. As for the orbit-servicing targets, they are usually divided into 2 categories, i.e., cooperative and non-cooperative ones, based on whether the space targets have active cross-link communication and cooperative identifiers with the servicing spacecraft or not. Before executing the orbit-servicing task, close-range rendezvous and proximity is an inevitable process in which precise observation for the orbit-servicing target is implemented to determine the docking ports and time (for the cooperative target) or capture ports and time (for the non-cooperative target). Thus, highly reliable and precise rendezvous and proximity control methods are essential to guarantee the safety and success of the on-orbit servicing task. As for non-cooperative target, a particular quantitative performance bound technique, prescribed performance control (PPC), was proposed and has attracted wide attention in the control system design. By the user’s specific choice for the parameters of the performance function, the finite-time or appointed-time convergence can be achieved for the controlled systems. However, a major defect in the aforementioned PPC control methods should be considered in practical engineering, that is, the actuator saturation induced by high sensitivity to the performance bounds. In a research paper recently published in Space: Science & Technology, scholars from Central South University, Intelligent Science & Technology Academy Limited of CASIC, and University of Strathclyde propose a brand-new anti-saturated appointed-time pose tracking control method for spacecraft rendezvous with a tumbling non-cooperative target, in which a novel appointed-time convergent performance function whose initial derivative is zero and an anti-saturated pose tracking controller with an adaptive saturation compensator are developed.

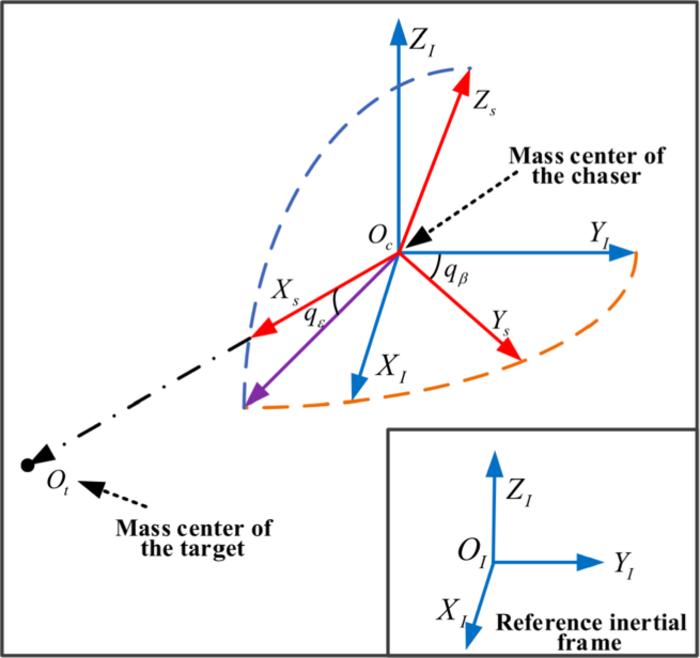
First, authors show the problem statement with description of the relative motion dynamics during the close-range proximity operations. Before moving, it is assumed that 2 spacecrafts are in orbit around the earth. Wherein, one is the servicing spacecraft (chaser for brevity), which has the control ability to approach the target. The other is the target spacecraft (target for brevity), which is tumbling and has no active interaction with the chaser. The relative translational motion between the chaser and target is described in the line of sight (LOS) coordinate frame. Wherein, the distance between the chaser and the target (r), the elevation angle (qε), and azimuth angle (qβ) in the LOS coordinate frame are derived from the accelerated velocity of the tumbling target (at) which is unknown for the chaser, the unknown space perturbations (d), and the accelerated velocity of the chaser (uc) to be designed. The tracking error system for the relative translational motion is obtained. The relative rotational motion dynamics between the chaser and target have been established with the quaternion. Based on the relative rotational motion dynamics, the desired attitude command of the chaser is preplanned, under the consideration that the center axes of the measure sensors should be along with the vector xbcd and the solar panels should be vertical with the solar ray. The coupling relative translational and rotational motion dynamics under the actuator saturation are expressed via newly defined variables χ1 and χ2. Based on the established relative motion dynamic model in Eq. (14), the control objectives of this paper are 2-fold: (a) The orbital and attitude tracking errors χ1 and χ2 can be steered by the designed controller to a small neighborhood around the origin with guaranteed performance within finite time. (b) The negative effects introduced by control saturation can be compensated by devising an adaptive anti-saturation controller.

Then, authors developed an adaptive anti-saturated appointed-time convergent controller for the tracking error system of the close-range proximity operations in Eq. 14. To guarantee the tracking performance and reduce the impact of the actuator saturation problem, a brand-new appointed-time convergent performance function is designed. Suppose that there are n+1 preassigned reference points in the 2-dimensional plane, i.e., P0(t0,y0), P1(t1,y1), …, Pn(tn,yn), the Bézier curve B(α) can be described as B(α) = β0(α)P0 + β1(α)P1 + ⋯ + βn(α)Pn where βi(���) = n!/(i!(ni)!)·αi(1-α)ni, i = 0, 1, …, n. The time series t0, t1, t2, …, tn satisfy t0 t1 t2 tn ≤ Ta with Ta is appointed by the users, and the parameter α is chosen as α = t/Ta. According to inherent properties of the introduced Bézier curve, if the first 3 reference points P0(t0,y0), P1(t1,y1), and P2(t2,y2) are selected to satisfy y0 = y1 = y2, then the developed Bézier curve B(α) will go across the first point and derivative of B(α) with respect to t at t0 is zero. Similarly, if the last 3 points Pn−2(tn−2,yn−2), Pn−1(tn−1,yn−1), and Pn(tn,yn) (n ≥ 3) are selected to satisfy yn−2 = yn−1 = yn, then B(α(Ta)) = yn and dB(α)/dt = 0. Based on the aforementioned analysis, a brand-new appointed-time convergent performance function μ(t) is generated by constructing a Bézier curve with 7 points, where y0 = y1 = y2 = μ(0) = μ0, y4 = y5 = y6 = μ(Ta) = μ, and y3 is selected to satisfy y3 ∈ (μ0, μ) which can be adjusted for different convergent speed. To realize the performance function, an anti-saturated appointed-time pose tracking controller is designed. An auxiliary state variable p ∈ ℝ6 is defined as p = χ1 + λ���(χ2) and the performance inequality is imposed on it to guarantee the pose tracking performance during the close-range proximity operations. The standard tracking error is Λi = pi(t)/μi(t). In PPC structure, the defined performance constraints are then removed using a constraint-free translation function, introducing a newly established state θ. Based on the above derivation, adaptive anti-saturated appointed-time pose tracking controller is devised, constituting of a stable control term and an anti-saturation control term, i.e., u = u0 + uc. Besides, to show the stability, authors prove that under the devised pose controller and adaptive laws, when the control gain ki satisfies ki > (1 + δi)2/8 (i = 1, 2, …, 6), the auxiliary state variable p will be steered to a small neighborhood around origin with guaranteed prescribed performance within appointed time instant Ta,max = max{Ta,i} (i = 1,2,…,6). Both the pose tracking errors χ1 and χ2 are finite-time convergent. Moreover, all the involved close-loop signals for the close-range proximity operations are uniformly ultimately bounded.

Finally, authors present 2 simulation examples of close-range proximity control with a tumbling non-cooperative target to verify the effectiveness of the proposed adaptive finite-time anti-saturated guaranteed control method. In the close-range proximity control with a tumbling target example, the considered target has no active control forces or torques, and is tumbling with a initial angular velocity ωt = [1.5,1.0,1.2]T deg/s. The tracking control system is always stable and the influence of the saturation is reduced by the adaptive projection rule. The chaser can move along with the tumbling target and stay relatively still with the target, thus the proximity and docking mission is well realized. In close-range proximity control with a tumbling and maneuvering target example, the initial system states, parameters, as well as the control parameters are selected the same with close-range proximity control with a tumbling target, except for non-cooperative acceleration caused by the target. The dynamic performance of the tracking system is not influenced by the non-cooperative maneuver, while the steady-state error of r(t) is obviously increased. It is noteworthy that the increased steady-state error is still within the prescribed stable region, and can be reduced by decreasing the prescribed value. These simulation examples show that the constructed auxiliary states are appointed-time stable within the designed performance functions and the proximity and docking mission is well realized even with the maneuvering non-cooperative space target.


Read More

Continue Reading

Uncategorized

Homes listed for sale in early June sell for $7,700 more

New Zillow research suggests the spring home shopping season may see a second wave this summer if mortgage rates fall
The post Homes listed for sale in…

Published

on

  • A Zillow analysis of 2023 home sales finds homes listed in the first two weeks of June sold for 2.3% more. 
  • The best time to list a home for sale is a month later than it was in 2019, likely driven by mortgage rates.
  • The best time to list can be as early as the second half of February in San Francisco, and as late as the first half of July in New York and Philadelphia. 

Spring home sellers looking to maximize their sale price may want to wait it out and list their home for sale in the first half of June. A new Zillow® analysis of 2023 sales found that homes listed in the first two weeks of June sold for 2.3% more, a $7,700 boost on a typical U.S. home.  

The best time to list consistently had been early May in the years leading up to the pandemic. The shift to June suggests mortgage rates are strongly influencing demand on top of the usual seasonality that brings buyers to the market in the spring. This home-shopping season is poised to follow a similar pattern as that in 2023, with the potential for a second wave if the Federal Reserve lowers interest rates midyear or later. 

The 2.3% sale price premium registered last June followed the first spring in more than 15 years with mortgage rates over 6% on a 30-year fixed-rate loan. The high rates put home buyers on the back foot, and as rates continued upward through May, they were still reassessing and less likely to bid boldly. In June, however, rates pulled back a little from 6.79% to 6.67%, which likely presented an opportunity for determined buyers heading into summer. More buyers understood their market position and could afford to transact, boosting competition and sale prices.

The old logic was that sellers could earn a premium by listing in late spring, when search activity hit its peak. Now, with persistently low inventory, mortgage rate fluctuations make their own seasonality. First-time home buyers who are on the edge of qualifying for a home loan may dip in and out of the market, depending on what’s happening with rates. It is almost certain the Federal Reserve will push back any interest-rate cuts to mid-2024 at the earliest. If mortgage rates follow, that could bring another surge of buyers later this year.

Mortgage rates have been impacting affordability and sale prices since they began rising rapidly two years ago. In 2022, sellers nationwide saw the highest sale premium when they listed their home in late March, right before rates barreled past 5% and continued climbing. 

Zillow’s research finds the best time to list can vary widely by metropolitan area. In 2023, it was as early as the second half of February in San Francisco, and as late as the first half of July in New York. Thirty of the top 35 largest metro areas saw for-sale listings command the highest sale prices between May and early July last year. 

Zillow also found a wide range in the sale price premiums associated with homes listed during those peak periods. At the hottest time of the year in San Jose, homes sold for 5.5% more, a $88,000 boost on a typical home. Meanwhile, homes in San Antonio sold for 1.9% more during that same time period.  


Metropolitan Area Best Time to List Price Premium Dollar Boost
United States First half of June 2.3% $7,700
New York, NY First half of July 2.4% $15,500
Los Angeles, CA First half of May 4.1% $39,300
Chicago, IL First half of June 2.8% $8,800
Dallas, TX First half of June 2.5% $9,200
Houston, TX Second half of April 2.0% $6,200
Washington, DC Second half of June 2.2% $12,700
Philadelphia, PA First half of July 2.4% $8,200
Miami, FL First half of June 2.3% $12,900
Atlanta, GA Second half of June 2.3% $8,700
Boston, MA Second half of May 3.5% $23,600
Phoenix, AZ First half of June 3.2% $14,700
San Francisco, CA Second half of February 4.2% $50,300
Riverside, CA First half of May 2.7% $15,600
Detroit, MI First half of July 3.3% $7,900
Seattle, WA First half of June 4.3% $31,500
Minneapolis, MN Second half of May 3.7% $13,400
San Diego, CA Second half of April 3.1% $29,600
Tampa, FL Second half of June 2.1% $8,000
Denver, CO Second half of May 2.9% $16,900
Baltimore, MD First half of July 2.2% $8,200
St. Louis, MO First half of June 2.9% $7,000
Orlando, FL First half of June 2.2% $8,700
Charlotte, NC Second half of May 3.0% $11,000
San Antonio, TX First half of June 1.9% $5,400
Portland, OR Second half of April 2.6% $14,300
Sacramento, CA First half of June 3.2% $17,900
Pittsburgh, PA Second half of June 2.3% $4,700
Cincinnati, OH Second half of April 2.7% $7,500
Austin, TX Second half of May 2.8% $12,600
Las Vegas, NV First half of June 3.4% $14,600
Kansas City, MO Second half of May 2.5% $7,300
Columbus, OH Second half of June 3.3% $10,400
Indianapolis, IN First half of July 3.0% $8,100
Cleveland, OH First half of July  3.4% $7,400
San Jose, CA First half of June 5.5% $88,400


The post Homes listed for sale in early June sell for $7,700 more appeared first on Zillow Research.

Read More

Continue Reading

Uncategorized

February Employment Situation

By Paul Gomme and Peter Rupert The establishment data from the BLS showed a 275,000 increase in payroll employment for February, outpacing the 230,000…

Published

on

By Paul Gomme and Peter Rupert

The establishment data from the BLS showed a 275,000 increase in payroll employment for February, outpacing the 230,000 average over the previous 12 months. The payroll data for January and December were revised down by a total of 167,000. The private sector added 223,000 new jobs, the largest gain since May of last year.

Temporary help services employment continues a steep decline after a sharp post-pandemic rise.

Average hours of work increased from 34.2 to 34.3. The increase, along with the 223,000 private employment increase led to a hefty increase in total hours of 5.6% at an annualized rate, also the largest increase since May of last year.

The establishment report, once again, beat “expectations;” the WSJ survey of economists was 198,000. Other than the downward revisions, mentioned above, another bit of negative news was a smallish increase in wage growth, from $34.52 to $34.57.

The household survey shows that the labor force increased 150,000, a drop in employment of 184,000 and an increase in the number of unemployed persons of 334,000. The labor force participation rate held steady at 62.5, the employment to population ratio decreased from 60.2 to 60.1 and the unemployment rate increased from 3.66 to 3.86. Remember that the unemployment rate is the number of unemployed relative to the labor force (the number employed plus the number unemployed). Consequently, the unemployment rate can go up if the number of unemployed rises holding fixed the labor force, or if the labor force shrinks holding the number unemployed unchanged. An increase in the unemployment rate is not necessarily a bad thing: it may reflect a strong labor market drawing “marginally attached” individuals from outside the labor force. Indeed, there was a 96,000 decline in those workers.

Earlier in the week, the BLS announced JOLTS (Job Openings and Labor Turnover Survey) data for January. There isn’t much to report here as the job openings changed little at 8.9 million, the number of hires and total separations were little changed at 5.7 million and 5.3 million, respectively.

As has been the case for the last couple of years, the number of job openings remains higher than the number of unemployed persons.

Also earlier in the week the BLS announced that productivity increased 3.2% in the 4th quarter with output rising 3.5% and hours of work rising 0.3%.

The bottom line is that the labor market continues its surprisingly (to some) strong performance, once again proving stronger than many had expected. This strength makes it difficult to justify any interest rate cuts soon, particularly given the recent inflation spike.

Read More

Continue Reading

Uncategorized

Mortgage rates fall as labor market normalizes

Jobless claims show an expanding economy. We will only be in a recession once jobless claims exceed 323,000 on a four-week moving average.

Published

on

Everyone was waiting to see if this week’s jobs report would send mortgage rates higher, which is what happened last month. Instead, the 10-year yield had a muted response after the headline number beat estimates, but we have negative job revisions from previous months. The Federal Reserve’s fear of wage growth spiraling out of control hasn’t materialized for over two years now and the unemployment rate ticked up to 3.9%. For now, we can say the labor market isn’t tight anymore, but it’s also not breaking.

The key labor data line in this expansion is the weekly jobless claims report. Jobless claims show an expanding economy that has not lost jobs yet. We will only be in a recession once jobless claims exceed 323,000 on a four-week moving average.

From the Fed: In the week ended March 2, initial claims for unemployment insurance benefits were flat, at 217,000. The four-week moving average declined slightly by 750, to 212,250


Below is an explanation of how we got here with the labor market, which all started during COVID-19.

1. I wrote the COVID-19 recovery model on April 7, 2020, and retired it on Dec. 9, 2020. By that time, the upfront recovery phase was done, and I needed to model out when we would get the jobs lost back.

2. Early in the labor market recovery, when we saw weaker job reports, I doubled and tripled down on my assertion that job openings would get to 10 million in this recovery. Job openings rose as high as to 12 million and are currently over 9 million. Even with the massive miss on a job report in May 2021, I didn’t waver.

Currently, the jobs openings, quit percentage and hires data are below pre-COVID-19 levels, which means the labor market isn’t as tight as it once was, and this is why the employment cost index has been slowing data to move along the quits percentage.  

2-US_Job_Quits_Rate-1-2

3. I wrote that we should get back all the jobs lost to COVID-19 by September of 2022. At the time this would be a speedy labor market recovery, and it happened on schedule, too

Total employment data

4. This is the key one for right now: If COVID-19 hadn’t happened, we would have between 157 million and 159 million jobs today, which would have been in line with the job growth rate in February 2020. Today, we are at 157,808,000. This is important because job growth should be cooling down now. We are more in line with where the labor market should be when averaging 140K-165K monthly. So for now, the fact that we aren’t trending between 140K-165K means we still have a bit more recovery kick left before we get down to those levels. 


From BLS: Total nonfarm payroll employment rose by 275,000 in February, and the unemployment rate increased to 3.9 percent, the U.S. Bureau of Labor Statistics reported today. Job gains occurred in health care, in government, in food services and drinking places, in social assistance, and in transportation and warehousing.

Here are the jobs that were created and lost in the previous month:

IMG_5092

In this jobs report, the unemployment rate for education levels looks like this:

  • Less than a high school diploma: 6.1%
  • High school graduate and no college: 4.2%
  • Some college or associate degree: 3.1%
  • Bachelor’s degree or higher: 2.2%
IMG_5093_320f22

Today’s report has continued the trend of the labor data beating my expectations, only because I am looking for the jobs data to slow down to a level of 140K-165K, which hasn’t happened yet. I wouldn’t categorize the labor market as being tight anymore because of the quits ratio and the hires data in the job openings report. This also shows itself in the employment cost index as well. These are key data lines for the Fed and the reason we are going to see three rate cuts this year.

Read More

Continue Reading

Trending