Uncategorized
SCHWAZZE ANNOUNCES THIRD QUARTER RESULTS
SCHWAZZE ANNOUNCES THIRD QUARTER RESULTS
PR Newswire
DENVER, Nov. 9, 2022
OTCQX: SHWZNEO: SHWZ
Record Quarterly Revenue and Adjusted EBITDA
Revenue Increased 36% to $43.2 Million Compared to $31.8 Million in Q3 2021Nine Month Revenue Increased 46% …
Share this:


SCHWAZZE ANNOUNCES THIRD QUARTER RESULTS
PR Newswire
DENVER, Nov. 9, 2022
OTCQX: SHWZ
NEO: SHWZ
Record Quarterly Revenue and Adjusted EBITDA
Revenue Increased 36% to $43.2 Million Compared to $31.8 Million in Q3 2021
Nine Month Revenue Increased 46% to $119.2 Million Compared to $81.9 Million
Adjusted EBITDA of $15.9 Million, 36.7% of Revenue
Nine Month Adjusted EBITDA of $38.7 Million, 32.5% of Revenue
Conference Call & Webcast Scheduled for Today – 5:00 pm EDT
DENVER, Nov. 9, 2022 /PRNewswire/ - Medicine Man Technologies Inc. operating as Schwazze, (OTCQX: SHWZ) (NEO: SHWZ) ("Schwazze" or the "Company"), today announced financial results for the third quarter ended September 30, 2022 ("Q3 2022").
Q3 2022 Financial Summary:
- Revenues of $43.2 million increased 36% compared to $31.8 million in quarter ended September 30, 2021 ("Q3 2021")
- Retail sales were $39.8 million up 92% to $20.7 million when compared to Q3 2021
- Gross Margin of $26.0 million, 60.1% of revenue, compared to $15.1 million and 47.3% of revenue in Q3 2021
- Net Income was $1.8 million compared to a Net Income of $1.0 million for the same period last year
- Adjusted EBITDA of $15.9 million was 36.7% of revenue, compared to $8.8 million for the same period last year
- Colorado two year stacked IDs for Q3 2022 compared to Q3 2022 and Q3 2020 for same store sales(1) were (9.7%) and one year IDs(1) were (10.6%) comparing Q3 2022 to Q3 2021
- Average basket size (1) for Q3 2022 was $60.96 up slightly by 0.1% compared to Q3 2021
- Recorded customer visits (1) for Q3 2022 totaled 452,220 down 10.7%, compared to Q3 2021
- New Mexico two year stacked IDs for Q3 2022 compared to Q3 2021 and Q3 2020 for same store sales(1) were 52.9% and one year IDs(1) were 48.4% comparing Q3 2022 to Q3 2021
- Average basket size (1) for Q3 2022 was $52.67 down 12.2% compared to Q3 2021
- Recorded customer visits (1) for Q3 2022 totaled 231,137 up 69.0%, compared to Q3 2021
Corporate Update:
Since December 2021, Schwazze has closed acquisitions adding 15 cannabis dispensaries, 10 in New Mexico and five in Colorado as well as four cultivation facilities in New Mexico and one in Colorado and one manufacturing asset in New Mexico. This year Schwazze has opened two new dispensaries in New Mexico. This brings our total dispensary count to 35 between Colorado and New Mexico.
Justin Dye, Chairman and CEO of Schwazze stated, "I am proud of the entire Schwazze team, and I would like to thank them for their hard work this past quarter and year. Despite a challenging economic backdrop, we outperformed our markets in Colorado by 12%. We've worked hard to continue to grow our market share, increase our profitability rate and generate free cash flow from operations, after paying taxes and CAPEX, placing us in an exclusive club within the cannabis sector. This is a proof point that we are well on our way to building Schwazze into a unique regional powerhouse. I believe our distinctive operating capabilities, applied to attractive growth opportunities within our sector, will reward our shareholders with attractive risk adjusted returns. The potential of favorable regulatory reform in the near-term would obviously accelerate and amplify those returns."
Q3 2022 Revenue
Revenues for the three months ended September 30, 2022 totaled $43,190,986, including (i) retail sales of $39,759,734 (ii) wholesale sales of $3,335,252 and (iii) other operating revenues of $96,000, compared to revenues of $31,835,305, including (i) retail sales of $20,741,864, (ii) wholesale sales of $11,022,519, and (iii) other operating revenues of $70,922 during the three months ended September 30, 2021, representing an increase of $11,355,681 or 36%. The most influential factor driving revenue increases in the third quarter of 2022 as compared to the same period in 2021 is acquisition activity. Revenue for the quarter ended September 30, 2022 included revenue from four consummated acquisitions in Colorado and revenue from the Company's initial entrance into the New Mexico market with the acquisition of R. Greenleaf, which were not in revenue for the same period in 2021. Revenue from wholesale sales decreased, due in large part to continued pricing pressure in the Colorado wholesale market as a result of supply saturation in flower and bulk distillate products.
Cost of goods and services for the three months ended September 30, 2022, totaled $17,226,451 compared to cost of goods and services of $16,779,313 during the three months ended September 30, 2021, representing an increase of $447,138 or 3%. Overall cost of goods and services increased due to the same acquisition activities that generated substantial increases in revenue, but the rate at which cost of goods and services increases from acquisition activity occurs at a lower rate than increases in revenue from acquisition activity due to lower wholesale flower pricing in Colorado and substantial vertical integration in New Mexico and increased retail revenue, which has better gross margin, as a percentage of the total revenue.
Gross profit was $25,964,535 million dollars for the quarter compared to $15,055,992 during the same period in 2021. Gross profit margin increased as a percentage of revenue from 47.3% to 60.1%. This positive result reflects a higher percentage of retail sales, our consolidated purchasing approach, the implementation of our retail playbook, and vertical product sales in New Mexico.
Operating expenses for the quarter, totaled $14,849,677, compared to operating expenses of $11,218,992 during the same quarter 2021, representing an increase of $3,630,685 or 32%. This increase is due to increased selling, general and administrative expenses, professional service fees, salaries, benefits and related employment costs driven by growth from acquisitions offset by stock-based compensation.
Other expense, net for the three months ended September 30, 2022 totaled $3,712,108 compared to $1,555,427 during the three months ended September 30, 2021, representing an increase in other expense of $2,156,681 or 139%. The increase in other expenses is due to higher interest payments due on the Company's debt obligations as a result of compounding interest with the passage of time and higher debt balances, which was partially offset this quarter by the revaluation of the derivative liability related to the Investor Notes issued in December 2021 that was recognized as income in the three months ended September 30, 2022.
Adjusted EBITDA for Q3 2022 was $15,860,466 representing 36.7% of revenue, compared to $8,797,641 and 27.6% of revenue for the same period last year. This is derived from Operating Income and adjusting one-time expenses, merger and acquisition and capital raising costs, non-cash related compensation costs, and depreciation and amortization. See the financial table for Adjusted EBITDA below adjustment for details.
For nine months ending September 30, 2022, the Company used cash for operations of $3,957,263 compared to generating cash of $4,814,104 for the same period in 2021. The Company has cash and cash equivalents of $38.7 million at the end of Q3 2022.
Nancy Huber, CFO for Schwazze commented, "During the third quarter we continued our focus on reducing operating and SG&A expenses. Our third quarter gross margin and operating expenses improved over the second quarter in both dollars and percent of revenue. Our balance sheet remains strong, with ample liquidity. We continue to be committed to delivering positive cash flow before acquisition costs for the year while driving organic growth with the opening of two stores in New Mexico in the third quarter."
2022 Guidance
The Company is providing guidance for the fiscal year. FY 2022 revenue is projected to be $155 million to $165 million, and the FY 2022 adjusted EBITDA is projected to be from $51 million to $56 million. We are on target to deliver the lower end of the range for adjusted EBITDA which was a fourth quarter annualized run-rate of $60-72 million dollars. We expect to be slightly below the projected revenues which was a fourth quarter annualized run-rate of $175 million to $200 million. This lower-than-expected revenue in Q4 is due to lower than expected wholesale sales, and construction delays in new store openings in New Mexico.
The company generated $4 million in cash from operations in the third quarter and expects to generate positive cash flow before acquisitions for the year.
NOTES: | |
(1) | Schwazze did not own all the assets and entities in part of 2021, 2020 and 2019 and is using unaudited numbers for this comparison. |
Adjusted EBITDA represents income (loss) from operations, as reported, before tax, adjusted to exclude non-recurring items, other non-cash items, including stock-based compensation expense, depreciation, and amortization, and further adjusted to remove acquisition and capital raise related costs, and other one-time expenses, such as severance, retention, and employee relocation. The Company uses adjusted EBITDA as it believes it better explains the results of its core business. The Company has not reconciled guidance for adjusted EBITDA to the corresponding GAAP financial measure because it cannot provide guidance for the various reconciling items. The Company is unable to provide guidance for these reconciling items because it cannot determine their probable significance, as certain items are outside of its control and cannot be reasonably predicted. Accordingly, a reconciliation to the corresponding GAAP financial measure is not available without unreasonable effort.
Webcast – November 9, 2022 – 5:00 PM EDT
Investors and stakeholders may participate in the conference call by dialing 416-764-8650 or by dialing North American toll free 1-888-664-6383 or listen to the webcast from the Company's website at https://ir.schwazze.com The webcast will be available on the Company's website and on replay until November 16, 2022, and may be accessed by dialing 1-888-390-0541 / 997573 #.
Following their prepared remarks, Chief Executive Officer, Justin Dye; President, Nirup Krishnamurthy; and Chief Financial Officer, Nancy Huber will answer investor questions. Investors may submit questions in advance or during the conference call itself through the weblink: https://app.webinar.net/x0q6rpnP84n. This weblink has been posted to the Company's website and will be archived on the website. All Company SEC filings can also be accessed on the Company website at https://ir.schwazze.com/sec-filings
About Schwazze
Schwazze (OTCQX: SHWZ, NEO: SHWZ) is building a premier vertically integrated regional cannabis company with assets in Colorado and New Mexico and will continue to take its operating system to other states where it can develop a differentiated regional leadership position. Schwazze is the parent company of a portfolio of leading cannabis businesses and brands spanning seed to sale. The Company is committed to unlocking the full potential of the cannabis plant to improve the human condition. Schwazze is anchored by a high-performance culture that combines customer-centric thinking and data science to test, measure, and drive decisions and outcomes. The Company's leadership team has deep expertise in retailing, wholesaling, and building consumer brands at Fortune 500 companies as well as in the cannabis sector. Schwazze is passionate about making a difference in our communities, promoting diversity and inclusion, and doing our part to incorporate climate-conscious practices. Medicine Man Technologies, Inc. was Schwazze's former operating trade name. The corporate entity continues to be named Medicine Man Technologies, Inc. Schwazze derives its name from the pruning technique of a cannabis plant to enhance plant structure and promote healthy growth.
Forward-Looking Statements
Such forward-looking statements may be preceded by the words "plan," "will," "may," "continue," "anticipate," "become," "build," "develop," "expect," "believe," "poised," "project," "approximate," "could," "potential," or similar expressions as they relate to Schwazze. Forward-looking statements include the guidance provided regarding the Company's Q4 2022 performance and annual capital spending. Forward-looking statements are not guarantees of future events or performance, are based on certain assumptions, and are subject to various known and unknown risks and uncertainties, many of which are beyond the Company's control and cannot be predicted or quantified. Consequently, actual events and results may differ materially from those expressed or implied by such forward-looking statements. Such risks and uncertainties include, without limitation, risks and uncertainties associated with (i) our inability to manufacture our products and product candidates on a commercial scale on our own or in collaboration with third parties; (ii) difficulties in obtaining financing on commercially reasonable terms; (iii) changes in the size and nature of our competition; (iv) loss of one or more key executives or scientists; (v) difficulties in securing regulatory approval to market our products and product candidates; (vi) our ability to successfully execute our growth strategy in Colorado and New Mexico and outside the states, (vii) our ability to identify and consummate future acquisitions that meet our criteria, (viii) our ability to successfully integrate acquired businesses and realize synergies therefrom, (ix) the ongoing COVID-19 pandemic, * the timing and extent of governmental stimulus programs, (xi) the uncertainty in the application of federal, state and local laws to our business, and any changes in such laws, and (xii) our ability to achieve the target metrics, including our annualized revenue and EBIDTA run rates set out in our Q4 2022 guidance. More detailed information about the Company and the risk factors that may affect the realization of forward-looking statements is set forth in the Company's filings with the Securities and Exchange Commission (SEC), including the Company's Annual Report on Form 10-K and its Quarterly Reports on Form 10-Q. Investors and security holders are urged to read these documents free of charge on the SEC's website at http://www.sec.gov. The Company assumes no obligation to publicly update or revise its forward-looking statements as a result of new information, future events or otherwise except as required by law.
MEDICINE MAN TECHNOLOGIES, INC.
CONSOLIDATED BALANCE SHEETS
For September 30,2022 and Dec 31, 2021
Expressed in U.S. Dollars
September 30, | December 31, | ||||||
2022 | 2021 | ||||||
(Unaudited) | (Audited) | ||||||
ASSETS | |||||||
Current assets | |||||||
Cash and cash equivalents | $ | 38,725,187 | $ | 106,400,216 | |||
Accounts receivable, net of allowance for doubtful accounts | 5,176,200 | 3,866,828 | |||||
Inventory | 21,289,003 | 11,121,997 | |||||
Note receivable - current, net | 47,778 | — | |||||
Marketable securities, net of unrealized loss of $42,353 and gain of $216,771, respectively | 451,200 | 493,553 | |||||
Prepaid expenses and other current assets | 5,901,058 | 2,523,214 | |||||
Total current assets | 71,590,426 | 124,405,808 | |||||
Non-current assets | |||||||
Fixed assets, net accumulated depreciation of $4,011,034 and $1,988,973, respectively | 25,592,522 | 10,253,226 | |||||
Goodwill | 99,592,790 | 43,316,267 | |||||
Intangible assets, net accumulated amortization of $13,960,457 and $7,652,750, respectively | 111,073,948 | 97,582,330 | |||||
Note receivable – noncurrent, net | — | 143,333 | |||||
Accounts receivable – litigation | 290,648 | 303,086 | |||||
Other noncurrent assets | 1,457,646 | 514,962 | |||||
Operating lease right of use assets | 19,982,940 | 8,511,780 | |||||
Total non-current assets | 257,990,494 | 160,624,984 | |||||
Total assets | $ | 329,580,920 | $ | 285,030,792 | |||
LIABILITIES AND STOCKHOLDERS' DEFICIT | |||||||
Current liabilities | |||||||
Accounts payable | $ | 5,756,736 | $ | 2,548,885 | |||
Accounts payable - related party | 53,819 | 36,820 | |||||
Accrued expenses | 9,332,382 | 5,592,222 | |||||
Derivative liabilities | 6,818,053 | 34,923,013 | |||||
Notes payable - related party | — | 134,498 | |||||
Lease liabilities - current | 2,992,540 | — | |||||
Current portion of long term debt | 1,500,000 | — | |||||
Income taxes payable | 3,588,371 | 2,027,741 | |||||
Total current liabilities | 30,041,901 | 45,263,179 | |||||
Long term debt, net of debt discount and issuance costs | 122,889,447 | 97,482,468 | |||||
Lease liabilities | 17,763,177 | 8,715,480 | |||||
Total long-term liabilities | 140,652,624 | 106,197,948 | |||||
Total liabilities | 170,694,525 | 151,461,127 | |||||
Stockholders' equity | |||||||
Preferred stock, $0.001 par value. 10,000,000 shares authorized; 86,994 shares issued as of September 30, 2022 and December 31, 2021, 84,304 outstanding at September 30, 2022 and 82,566 outstanding at December 31, 2021. | 87 | 87 | |||||
Common stock, $0.001 par value. 250,000,000 shares authorized; 56,069,212 shares issued and 54,741,506 shares outstanding at September 30, 2022 and 45,484,314 shares issued and 44,745,870 shares outstanding as of December 31, 2021. | 56,069 | 45,485 | |||||
Additional paid-in capital | 179,723,367 | 162,815,097 | |||||
Accumulated deficit | (18,902,450) | (27,773,968) | |||||
Common stock held in treasury, at cost, 886,459 shares held as of September 30, 2022 and 517,044 shares held as of December 31, 2021 | (1,990,678) | (1,517,036) | |||||
Total stockholders' equity | 158,886,395 | 133,569,665 | |||||
Total liabilities and stockholders' equity | $ | 329,580,920 | $ | 285,030,792 | |||
See accompanying notes to the financial statements
MEDICINE MAN TECHNOLOGIES, INC.
CONSOLDIATED STATEMENT OF OPERATIONS AND COMPREHENSIVE INCOME (UNAUDITED)
For the Three Months and Nine Months Periods ended September 30, 2022 and September 30, 2021
Expressed in U.S. Dollars
For the Three Months Ended | For the Nine Months Ended | ||||||||||||
September 30, | September 30, | ||||||||||||
2022 | 2021 | 2022 | 2021 | ||||||||||
(Unaudited) | (Unaudited) | (Unaudited) | (Unaudited) | ||||||||||
Operating revenues | |||||||||||||
Retail | $ | 39,759,734 | $ | 20,741,864 | $ | 104,386,464 | $ | 54,083,880 | |||||
Wholesale | 3,335,252 | 11,022,519 | 14,661,268 | 27,654,965 | |||||||||
Other | 96,000 | 70,922 | 184,200 | 165,416 | |||||||||
Total revenue | 43,190,986 | 31,835,305 | 119,231,932 | 81,904,261 | |||||||||
Cost of goods and services | |||||||||||||
Total cost of goods and services | 17,226,451 | 16,779,313 | 57,173,192 | 44,692,765 | |||||||||
Gross profit | 25,964,535 | 15,055,992 | 62,058,740 | 37,211,496 | |||||||||
Operating expenses | |||||||||||||
Selling, general and administrative expenses | 6,725,713 | 5,593,336 | 20,245,737 | 13,580,469 | |||||||||
Professional services | 1,626,909 | 752,572 | 5,729,339 | 4,466,696 | |||||||||
Salaries | 6,397,157 | 3,644,320 | 18,934,873 | 8,505,733 | |||||||||
Stock based compensation | 99,898 | 1,228,764 | 1,788,823 | 3,865,588 | |||||||||
Total operating expenses | 14,849,677 | 11,218,992 | 46,698,772 | 30,418,486 | |||||||||
Income (loss) from operations | 11,114,858 | 3,837,000 | 15,359,968 | 6,793,010 | |||||||||
Other income (expense) | |||||||||||||
Interest expense, net | (8,500,235) | (1,851,694) | (23,312,088) | (4,526,746) | |||||||||
Unrealized gain on derivative liabilities | 4,816,668 | 356,824 | 28,104,960 | 967,751 | |||||||||
Other income | — | — | 20,400 | — | |||||||||
Gain (loss) on sale of assets | — | (49,985) | — | 242,494 | |||||||||
Unrealized gain (loss) on investments | (28,541) | (10,572) | (42,353) | 210,685 | |||||||||
Total other income (expense) | (3,712,108) | (1,555,427) | 4,770,919 | (3,105,816) | |||||||||
Provision for income taxes | 5,593,513 | 1,312,817 | 11,259,369 | 1,997,905 | |||||||||
Net income | $ | 1,809,237 | $ | 968,756 | $ | 8,871,518 | $ | 1,689,289 | |||||
Less: Accumulated preferred stock dividends for the period | (1,784,113) | — | (5,294,132) | — | |||||||||
Net income attributable to common stockholders | $ | 25,124 | $ | 968,756 | $ | 3,577,386 | $ | 1,689,289 | |||||
Earnings (loss) per share attributable to common shareholders | |||||||||||||
Basic earnings (loss) per share | $ | 0.00 | $ | 0.02 | $ | 0.07 | $ | 0.04 | |||||
Diluted earnings (loss) per share | $ | 0.00 | $ | 0.02 | $ | 0.03 | $ | 0.03 | |||||
Weighted average number of shares outstanding - basic | 51,232,943 | 44,145,709 | 50,615,437 | 42,903,008 | |||||||||
Weighted average number of shares outstanding - diluted | 137,954,532 | 44,145,709 | 137,337,027 | 56,688,640 | |||||||||
See accompanying notes to the financial statements
MEDICINE MAN TECHNOLOGIES, INC.
STATEMENT OF CASH FLOWS (UNAUDITED)
For the Nine Month Periods Ended September 30, 2022 and 2021
Expressed in U.S. Dollars
For the Nine Months Ended | |||||||
September 30, | |||||||
2022 | 2021 | ||||||
Cash flows from operating activities | |||||||
Net income (loss) for the period | $ | 8,871,518 | $ | 1,689,289 | |||
Adjustments to reconcile net income to cash provided by (used in) operating activities | |||||||
Depreciation and amortization | 8,329,767 | 7,779,828 | |||||
Non-cash lease expense | 493,782 | — | |||||
Gain on change in derivative liabilities | (28,104,960) | (967,751) | |||||
Loss (gain) on investment, net | 42,353 | (210,685) | |||||
Gain loss on sale of asset | — | (292,479) | |||||
Stock based compensation | 1,474,380 | 3,865,588 | |||||
Changes in operating assets and liabilities (net of acquired amounts): | |||||||
Accounts receivable | (1,100,055) | (2,179,646) | |||||
Inventory | 2,829,157 | (3,034,246) | |||||
Prepaid expenses and other current assets | (2,616,732) | (1,964,835) | |||||
Other assets | (940,184) | (396,183) | |||||
Operating leases right of use assets and liabilities | 75,295 | 114,129 | |||||
Accounts payable and other liabilities | 5,127,786 | (568,387) | |||||
Deferred Revenue | — | (50,000) | |||||
Income taxes payable | 1,560,630 | 1,029,482 | |||||
Net cash provided by (used in) operating activities | (3,957,263) | 4,814,104 | |||||
Cash flows from investing activities: | |||||||
Collection of notes receivable | 95,555 | 181,911 | |||||
Cash consideration for acquisition of business | (92,701,905) | (71,927,071) | |||||
Purchase of fixed assets | (12,511,389) | (3,869,658) | |||||
Purchase of intangible assets | — | (29,580) | |||||
Net cash used in investing activities | (105,117,739) | (75,644,398) | |||||
Cash flows from financing activities: | |||||||
Proceeds from issuance of debt | 22,473,938 | 45,344,578 | |||||
Debt issuance and discount costs | 4,433,042 | — | |||||
Repayment of notes payable | — | (4,865,502) | |||||
Proceeds from issuance of common stock, net of issuance costs | 14,492,993 | 50,282,797 | |||||
Net cash provided by financing activities | 41,399,973 | 90,761,874 | |||||
Net increase (decrease) in cash and cash equivalents | (67,675,029) | 19,931,580 | |||||
Cash and cash equivalents at beginning of period | 106,400,216 | 1,237,236 | |||||
Cash and cash equivalents at end of period | $ | 38,725,187 | $ | 21,168,816 | |||
Supplemental disclosure of cash flow information: | |||||||
Cash paid for interest | $ | 12,797,185 | $ | 3,862,970 | |||
Cash paid for income taxes | 9,840,000 | — | |||||
Supplemental disclosure of non-cash investing and financing activities: | |||||||
Issuance of common stock | 510,525 | — | |||||
Return of common stock | 565,501 | — | |||||
Issuance of stock as payment for acquisitions | 9,508,872 | ||||||
Issuance of preferred stock in connection with private offerings | — | ||||||
See accompanying notes to the financial statements
MEDICINE MAN TECHNOLOGIES, INC.
Adjusted EBITDA Reconciliation
For the Three Months and Nine Months Periods ended September 30, 2022 and September 30, 2021
Expressed in U.S. Dollars
Non-GAAP measurement
(UNAUDITED)
Three Months Ended | Nine Months Ended | |||||
September 30, | September 30, | |||||
2022 | 2021 | 2022 | 2021 | |||
Net income (loss) | $ 1,809,237 | $ 968,756 | $ 8,871,518 | $ 1,689,289 | ||
Interest expense, net | 8,500,235 | 1,851,694 | 23,312,087 | 4,526,746 | ||
Provision for income taxes | 5,593,513 | 1,312,817 | 11,259,369 | 1,997,905 | ||
Other (income) expense | (4,788,127) | (296,267) | (28,083,006) | (1,420,930) | ||
Depreciation and amortization | 3,322,150 | 2,972,681 | 8,823,549 | 7,779,828 | ||
EBITDA (non-GAAP measure) | $ 14,437,008 | $ 6,809,681 | $ 24,183,517 | $ 14,572,838 | ||
Non-cash stock compensation | 99,898 | 1,228,764 | 1,788,823 | 3,865,588 | ||
Deal related expenses | 993,828 | 404,687 | 4,907,291 | 2,067,102 | ||
Capital raise related expenses | 185,597 | 74,155 | 791,229 | 1,256,244 | ||
Inventory adjustment to fair market value for | 34,604 | - | 6,541,651 | 2,164,686 | ||
One-time cultivation asset impairment | - | - | 329,210 | - | ||
Severance | 22,434 | 19,412 | 71,536 | 161,504 | ||
Retention program expenses | - | 29,687 | - | 89,062 | ||
Employee relocation expenses | - | - | 19,110 | 38,391 | ||
Other non-recurring items | 87,097 | 231,255 | 93,322 | 448,433 | ||
Adjusted EBITDA (non-GAAP measure) | $ 15,860,466 | $ 8,797,641 | $ 38,725,689 | $ 24,663,848 | ||
Revenue | 43,190,986 | 31,835,305 | 119,231,932 | 81,904,261 | ||
aEBITDA Percent | 36.7 % | 27.6 % | 32.5 % | 30.1 % | ||
View original content to download multimedia:https://www.prnewswire.com/news-releases/schwazze-announces-third-quarter-results-301673612.html
SOURCE Medicine Man Technologies, Inc.
Uncategorized
Women’s basketball is gaining ground, but is March Madness ready to rival the men’s game?
The hype around Caitlin Clark, NCAA Women’s Basketball is unprecedented — but can its March Madness finally rival the Men’s?
Share this:

In March 2021, the world was struggling to find its legs amid the ongoing Covid-19 pandemic. Sports leagues were trying their best to keep going.
It started with the NBA creating a bubble in Orlando in late 2020, playing a full postseason in the confines of Disney World in arenas that were converted into gyms devoid of fans. Other leagues eventually allowed for limited capacity seating in stadiums, including the NCAA for its Men’s and Women’s Basketball tournaments.
The two tournaments were confined to two cities that year — instead of games normally played in different regions around the country: Indianapolis for the men and San Antonio for the women.
But a glaring difference between the men’s and women’s facilities was exposed by Oregon’s Sedona Prince on social media. The workout and practice area for the men was significantly larger than the women, whose weight room was just a single stack of dumbbells.
Let me put it on Twitter too cause this needs the attention pic.twitter.com/t0DWKL2YHR
— SEDONA (@sedonaprince_) March 19, 2021
The video drew significant attention to the equity gaps between the Men’s and Women’s divisions, leading to a 114-page report by a civil rights law firm that detailed the inequities between the two and suggested ways to improve the NCAA’s efforts for the Women’s side. One of these suggestions was simply to give the Women’s Tournament the same March Madness moniker as the men, which it finally got in 2022.
But underneath the surface of these institutional changes, women’s basketball’s single-biggest success driver was already emerging out of the shadows.
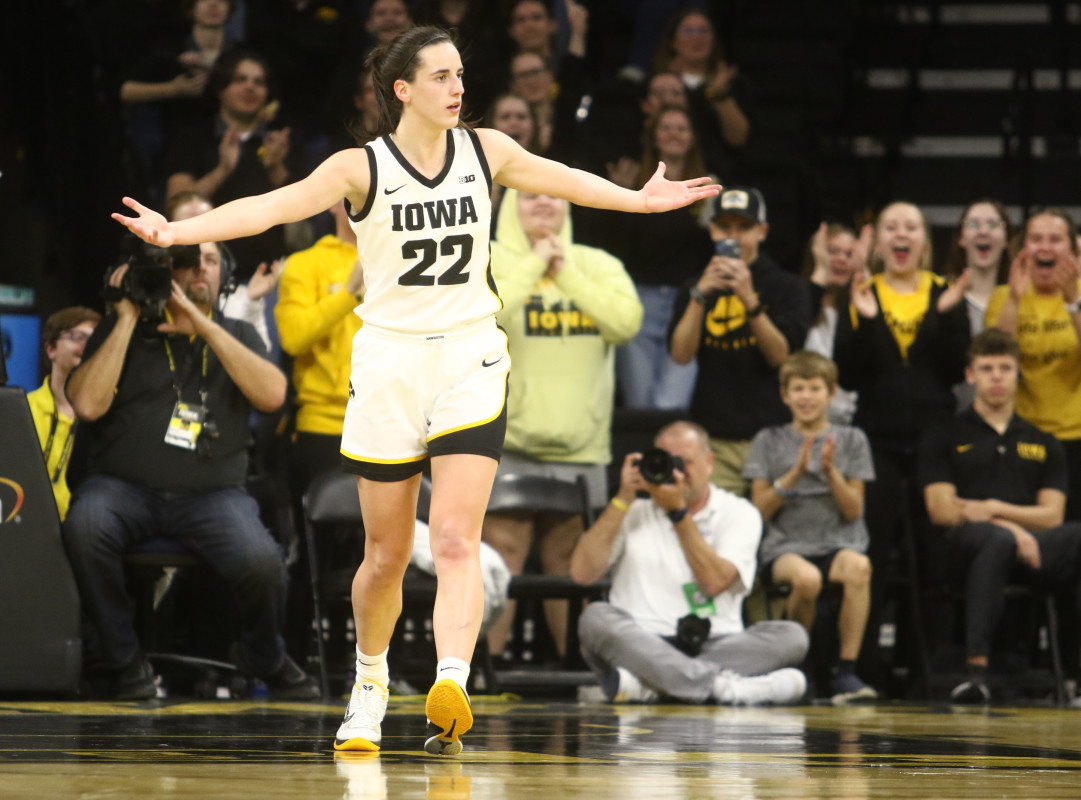
During the same COVID-marred season, a rookie from Iowa led the league in scoring with 26.6 points per game.
Her name: Caitlin Clark.
As it stands today, Clark is the leading scorer in the history of college basketball — Men’s or Women’s. Her jaw-dropping shooting ability has fueled record viewership and ticket sales for Women’s collegiate games, carrying momentum to the March Madness tournament that has NBA legends like Kevin Garnett and Paul Pierce more excited for the Women’s March Madness than the Men’s this year.
Related: Ticket prices for Caitlin Clark's final college home game are insanely high
But as the NCAA tries to bridge the opportunities given to the two sides, can the hype around Clark be enough for the Women’s March Madness to bring in the same fandom as the Men for the 2024 tournaments?
TheStreet spoke with Jon Lewis of Sports Media Watch, who has been following sports viewership trends for the last two decades; Melissa Isaacson, a veteran sports journalist and longtime advocate of women’s basketball; and Pete Giorgio, Deloitte’s leader for Global and US Sports to dissect the rise Caitlin Clark and women’s collegiate hoops ahead of March Madness.
“Nobody is moving the needle like Caitlin Clark,” Lewis told TheStreet. “Nobody else in sports, period, right now, is fueling record numbers on all these different networks, driving viewership beyond what the norm has been for 20 years."
The Caitlin Clark Effect is real — but there are other reasons for the success of women's basketball
The game in which Clark broke the all-time college scoring record against Ohio State on Sunday, Mar. 3 was seen by an average of 3.4 million viewers on Fox, marking the first time a women’s game broke the two million viewership barrier since 2010. Viewership for that game came in just behind the men’s game between Michigan State vs Arizona game on Thanksgiving, which Lewis said was driven by NFL viewership on the same day.
A week later, Iowa’s Big Ten Championship win over Nebraska breached the three million viewers mark as well, and the team has also seen viewership numbers crack over 1.5 million viewers multiple times throughout the regular season.
The success on television has also translated to higher ticket prices, as tickets to watch Clark at home and on the road have breached hundreds of dollars and drawn long lines outside stadiums. Isaacson, who is a professor at Northwestern, said she went to the game between the Hawkeyes and Northwestern Wildcats — which was the first sellout in school history for the team — and witnessed the effect of Clark in person.
“Standing in line interviewing people at the Northwestern game, seeing men who've never been to a women's game with their little girls watching and so excited, and seeing Caitlin and her engaging with little girls, it’s just been really fun,” Isaacson said.
But while Clark is certainly the biggest success driver, her game isn’t the only thing pulling up the women’s side. The three-point revolution, which started in the NBA with the introduction of deeper analytics as well as the rise of stars like Steph Curry, has been a positive for the Women’s game.
“They backed up to the three-point line and it’s opening up the game,” Isaacson said.
One of the major criticisms from a lot of women’s hoops detractors has been how the game does not compare in terms of quality to the men. However, shooting has become a great equalizer, displayed recently during the 2024 NBA All-Star Weekend last month when the WNBA’s Sabrina Ionescu nearly defeated Curry — who is widely considered the greatest shooter ever — in a three-point contest.
Clark has become the embodiment of the three-point revolution for the women. Her shooting displays have demanded the respect of anyone who has doubted women’s basketball in the past because being a man simply doesn’t grant someone the ability to shoot long-distance bombs the way she can.
Basketball pundit Bill Simmons admitted on a Feb. 28 episode of “The Bill Simmons Podcast” that he used to not want to watch women’s basketball because he didn’t enjoy watching the product, but finds himself following the women’s game this year more than the men’s side in large part due to Clark.
“I think she has the chance to be the most fun basketball player, male or female, when she gets to the pros,” Simmons said. “If she’s going to make the same 30-footers, routinely. It’s basically all the same Curry stuff just with a female … I would like watching her play in any format.”
But while Clark is driving up the numbers at the top, she’s not the only one carrying the greatness of the product. Lewis, Isaacson, Giorgio — and even Simmons, on his podcast — agreed that there are several other names and collegiate programs pulling in fans.
“It’s not just Iowa, it’s not just Caitlin Clark, it’s all of these teams,” Giorgio said. “Part of it is Angel Reese … coaches like Dawn Staley in South Carolina … You’ve got great stories left and right.”

The viewership showed that as well because the SEC Championship game between the LSU Tigers and University of South Carolina Gamecocks on Sunday, Mar. 10 averaged two million viewers.
Bridging the gap between the Men’s and Women’s March Madness viewership
The first reason women are catching up to the men is really star power. While the Women’s division has names like Clark and Reese, there just aren’t any names on the Men’s side this year that carry the same weight.
Garnett said on his show that he can’t name any men’s college basketball players, while on the women’s side, he could easily throw out the likes of Clark, Reese, UConn’s Paige Bueckers, and USC’s JuJu Watkins. Lewis felt the same.
Kevin Garnett energy towards WBB is unmatched. Sorry for the language but that’s how he talks. Just watch. pic.twitter.com/0yGBRGaF3O
— The9450 Podcast Network (@The9450) March 8, 2024
“The stars in the men's game, with one and done, I genuinely couldn't give you a single name of a single men’s player,” Lewis said.
A major reason for this is that the Women’s side has the continuity that the Men’s side does not. The rules of the NBA allow for players to play just one year in college — or even play a year professionally elsewhere — before entering the draft, while the WNBA requires players to be 22-years-old during the year of the draft to be eligible.
“You know the stars in the women's game because they stay longer,” Lewis said. “[In the men’s game], the programs are the stars … In the women's game, it's a lot more like the NBA where the players are the stars.”
Parity is also a massive factor on both sides. The women’s game used to be dominated by a few schools like UConn and Notre Dame. Nowadays, between LSU, Iowa, University of South Carolina, Stanford, and UConn, there are a handful of schools that have a shot to win the entire tournament. While this is more exciting for fans, the talent in the women's game isn’t deep enough, so too many upsets are unlikely. Many of the biggest draws are still expected to make deep runs.
But on the men’s side, there is a bigger shot that the smaller programs make it to the end — which is what was seen last year. UConn eventually won the whole thing, but schools without as big of a national fanbase in San Diego State, Florida Atlantic University, and the University Miami rounded out the Final Four.
“People want to see one Cinderella,” Lewis said. “They don't want to see two and three, they want one team that isn't supposed to be there.”
Is Women's March Madness ready to overtake the Men?
Social media might feel like it’s giving more traction to the Women’s game, but experts don’t necessarily expect that to show up in the viewership numbers just yet.
“There’s certainly a lot more buzz than there used to be,” Giorgio said. “It’s been growing every year for not just the past few years but for 10 years, but it’s hard to compare it versus Men’s.”
But the gap continues to get smaller and smaller between the two sides, and this year's tournament could bridge that gap even further.
One indicator is ticket prices. For the NCAA Tournament Final Four in April, “get-in” ticket prices are currently more expensive for the Women’s game than the Men’s game, according to TickPick. The ticketing site also projects that the Women’s Final Four and Championship game ticket prices will smash any previous records for the Women’s side should Clark and the Hawkeyes make a run to the end.

Getty Images/TheStreet
The caveat is that the Women’s Final Four is played in a stadium that has less than a third of the seating capacity of the Men’s Final Four. That’s why the average ticket prices are still more expensive for the men, although the gap is a lot smaller this year than in previous years.

But that caveat pretty much sums up where the women’s game currently stands versus the men’s: There is still a significant gap between the distribution and availability of the former.
While Iowa’s regular season games have garnered millions of viewers, the majority of the most-viewed games are still Men’s contests.
To illustrate the gap between the men’s and women’s game — last year’s Women’s Championship game that saw the LSU Tigers defeat the Hawkeyes was a record-breaking one for the women, drawing an average of 9.9 million viewers, more than double the viewership from the previous year.
One of the main reasons for that increase, as Lewis pointed out, is that last year’s Championship game was on ABC, which was the first time since 1995 that the Women’s Championship game was on broadcast television. The 1995 contest between UConn and Tennessee drew 7.4 million viewers.
The Men’s Championship actually had a record low in viewership last year garnering only 14.7 million viewers, driven in-part due to a lack of hype surrounding the schools that made it to the Final Four and Championship game. Viewership for the Men’s title game has been trending down in recent years — partly due to the effect the pandemic had on collective sports viewership — but the Men’s side had been easily breaching 20 million viewers for the game as recently as 2017.

Iowa's Big Ten Championship win on Sunday actually only averaged 6,000 fewer viewers than the iconic rivalry game between Duke and University of North Carolina Men’s Basketball the day prior. However, there is also the case that the Iowa game was played on broadcast TV (CBS) versus the Duke-UNC game airing on cable channel (ESPN).
So historical precedence makes it unlikely that we’ll see the women’s game match the men’s in terms of viewership as early as this year barring another massive viewership jump for the women and a lack of recovery for the Men’s side.
But ultimately, this shouldn’t be looked at as a down point for Women’s Basketball, according to Lewis. The Men’s side has built its viewership base for years, and the Women’s side is still growing. Even keeping pace with the Men’s viewership is already a great sign.
“The fact that these games have Caitlin Clark are even in the conversation with men's games, in terms of viewership is a huge deal,” Lewis said.
Related: Angel Reese makes bold statement for avoiding late game scuffle in championship game
recovery pandemic covid-19Uncategorized
One city held a mass passport-getting event
A New Orleans congressman organized a way for people to apply for their passports en masse.
Share this:


While the number of Americans who do not have a passport has dropped steadily from more than 80% in 1990 to just over 50% now, a lack of knowledge around passport requirements still keeps a significant portion of the population away from international travel.
Over the four years that passed since the start of covid-19, passport offices have also been dealing with significant backlog due to the high numbers of people who were looking to get a passport post-pandemic.
Related: Here is why it is (still) taking forever to get a passport
To deal with these concurrent issues, the U.S. State Department recently held a mass passport-getting event in the city of New Orleans. Called the "Passport Acceptance Event," the gathering was held at a local auditorium and invited residents of Louisiana’s 2nd Congressional District to complete a passport application on-site with the help of staff and government workers.
'Come apply for your passport, no appointment is required'
"Hey #LA02," Rep. Troy A. Carter Sr. (D-LA), whose office co-hosted the event alongside the city of New Orleans, wrote to his followers on Instagram (META) . "My office is providing passport services at our #PassportAcceptance event. Come apply for your passport, no appointment is required."
More Travel:
- A new travel term is taking over the internet (and reaching airlines and hotels)
- The 10 best airline stocks to buy now
- Airlines see a new kind of traveler at the front of the plane
The event was held on March 14 from 10 a.m. to 1 p.m. While it was designed for those who are already eligible for U.S. citizenship rather than as a way to help non-citizens with immigration questions, it helped those completing the application for the first time fill out forms and make sure they have the photographs and identity documents they need. The passport offices in New Orleans where one would normally have to bring already-completed forms have also been dealing with lines and would require one to book spots weeks in advance.
These are the countries with the highest-ranking passports in 2024
According to Carter Sr.'s communications team, those who submitted their passport application at the event also received expedited processing of two to three weeks (according to the State Department's website, times for regular processing are currently six to eight weeks).
While Carter Sr.'s office has not released the numbers of people who applied for a passport on March 14, photos from the event show that many took advantage of the opportunity to apply for a passport in a group setting and get expedited processing.
Every couple of months, a new ranking agency puts together a list of the most and least powerful passports in the world based on factors such as visa-free travel and opportunities for cross-border business.
In January, global citizenship and financial advisory firm Arton Capital identified United Arab Emirates as having the most powerful passport in 2024. While the United States topped the list of one such ranking in 2014, worsening relations with a number of countries as well as stricter immigration rules even as other countries have taken strides to create opportunities for investors and digital nomads caused the American passport to slip in recent years.
A UAE passport grants holders visa-free or visa-on-arrival access to 180 of the world’s 198 countries (this calculation includes disputed territories such as Kosovo and Western Sahara) while Americans currently have the same access to 151 countries.
stocks pandemic covid-19 grantsUncategorized
Fast-food chain closes restaurants after Chapter 11 bankruptcy
Several major fast-food chains recently have struggled to keep restaurants open.
Share this:


Competition in the fast-food space has been brutal as operators deal with inflation, consumers who are worried about the economy and their jobs and, in recent months, the falling cost of eating at home.
Add in that many fast-food chains took on more debt during the covid pandemic and that labor costs are rising, and you have a perfect storm of problems.
It's a situation where Restaurant Brands International (QSR) has suffered as much as any company.
Related: Wendy's menu drops a fan favorite item, adds something new
Three major Burger King franchise operators filed for bankruptcy in 2023, and the chain saw hundreds of stores close. It also saw multiple Popeyes franchisees move into bankruptcy, with dozens of locations closing.
RBI also stepped in and purchased one of its key franchisees.
"Carrols is the largest Burger King franchisee in the United States today, operating 1,022 Burger King restaurants in 23 states that generated approximately $1.8 billion of system sales during the 12 months ended Sept. 30, 2023," RBI said in a news release. Carrols also owns and operates 60 Popeyes restaurants in six states."
The multichain company made the move after two of its large franchisees, Premier Kings and Meridian, saw multiple locations not purchased when they reached auction after Chapter 11 bankruptcy filings. In that case, RBI bought select locations but allowed others to close.
Image source: Chen Jianli/Xinhua via Getty
Another fast-food chain faces bankruptcy problems
Bojangles may not be as big a name as Burger King or Popeye's, but it's a popular chain with more than 800 restaurants in eight states.
"Bojangles is a Carolina-born restaurant chain specializing in craveable Southern chicken, biscuits and tea made fresh daily from real recipes, and with a friendly smile," the chain says on its website. "Founded in 1977 as a single location in Charlotte, our beloved brand continues to grow nationwide."
Like RBI, Bojangles uses a franchise model, which makes it dependent on the financial health of its operators. The company ultimately saw all its Maryland locations close due to the financial situation of one of its franchisees.
Unlike. RBI, Bojangles is not public — it was taken private by Durational Capital Management LP and Jordan Co. in 2018 — which means the company does not disclose its financial information to the public.
That makes it hard to know whether overall softness for the brand contributed to the chain seeing its five Maryland locations after a Chapter 11 bankruptcy filing.
Bojangles has a messy bankruptcy situation
Even though the locations still appear on the Bojangles website, they have been shuttered since late 2023. The locations were operated by Salim Kakakhail and Yavir Akbar Durranni. The partners operated under a variety of LLCs, including ABS Network, according to local news channel WUSA9.
The station reported that the owners face a state investigation over complaints of wage theft and fraudulent W2s. In November Durranni and ABS Network filed for bankruptcy in New Jersey, WUSA9 reported.
"Not only do former employees say these men owe them money, WUSA9 learned the former owners owe the state, too, and have over $69,000 in back property taxes."
Former employees also say that the restaurant would regularly purchase fried chicken from Popeyes and Safeway when it ran out in their stores, the station reported.
Bojangles sent the station a comment on the situation.
"The franchisee is no longer in the Bojangles system," the company said. "However, it is important to note in your coverage that franchisees are independent business owners who are licensed to operate a brand but have autonomy over many aspects of their business, including hiring employees and payroll responsibilities."
Kakakhail and Durranni did not respond to multiple requests for comment from WUSA9.
bankruptcy pandemic

Key shipping company files for Chapter 11 bankruptcy


Women’s basketball is gaining ground, but is March Madness ready to rival the men’s game?


These Cities Have The Highest (And Lowest) Share Of Unaffordable Neighborhoods In 2024


Tight inventory and frustrated buyers challenge agents in Virginia


Industrial Production Increased 0.1% in February
Key shipping company files Chapter 11 bankruptcy


One city held a mass passport-getting event


Southwest and United Airlines have bad news for passengers


The hostility Black women face in higher education carries dire consequences


Simple blood test could predict risk of long-term COVID-19 lung problems
-

 Uncategorized3 weeks ago
All Of The Elements Are In Place For An Economic Crisis Of Staggering Proportions
-

 International1 week ago
EyePoint poaches medical chief from Apellis; Sandoz CFO, longtime BioNTech exec to retire
-

 Uncategorized4 weeks ago
California Counties Could Be Forced To Pay $300 Million To Cover COVID-Era Program
-

 Uncategorized3 weeks ago
Apparel Retailer Express Moving Toward Bankruptcy
-

 Uncategorized1 month ago
Industrial Production Decreased 0.1% in January
-

 International1 week ago
Walmart launches clever answer to Target’s new membership program
-

 Spread & Containment3 days ago
IFM’s Hat Trick and Reflections On Option-To-Buy M&A
-

 Uncategorized4 weeks ago
RFK Jr: The Wuhan Cover-Up & The Rise Of The Biowarfare-Industrial Complex