Connect with us

Uncategorized

RNA lipid nanoparticle engineering stops liver fibrosis in its tracks, reverses damage

Since the success of the COVID-19 vaccine, RNA therapies have been the object of increasing interest in the biotech world. These therapies work with your…

Published

on

Since the success of the COVID-19 vaccine, RNA therapies have been the object of increasing interest in the biotech world. These therapies work with your body to target the genetic root of diseases and infections, a promising alternative treatment method to that of traditional pharmaceutical drugs.

Credit: University of Pennsylvania

Since the success of the COVID-19 vaccine, RNA therapies have been the object of increasing interest in the biotech world. These therapies work with your body to target the genetic root of diseases and infections, a promising alternative treatment method to that of traditional pharmaceutical drugs.

Lipid nanoparticles (LNPs) have been successfully used in drug delivery for decades. FDA-approved therapies use them as vehicles for delivering messenger RNA (mRNA), which prompts the cell to make new proteins, and small interfering RNA (siRNA), which instruct the cell to silence or inhibit the expression of certain proteins.

The biggest challenge in developing a successful RNA therapy is its targeted delivery. Research is now confronting the current limitations of LNPs, which have left many diseases without an effective RNA therapy.

Liver fibrosis occurs when the liver is repeatedly damaged and the healing process results in the accumulation of scar tissue, impeding healthy liver function. It is a chronic disease characterized by the buildup of excessive collagen-rich extracellular matrix (ECM). Liver fibrosis has remained challenging to treat using RNA therapies due to a lack of delivery systems for targeting activated liver-resident fibroblasts. Both the solid fibroblast structure and the lack of specificity or affinity to target these fibroblasts has impeded current LNPs from entering activated liver-resident fibroblasts, and thus they are unable to deliver RNA therapeutics.

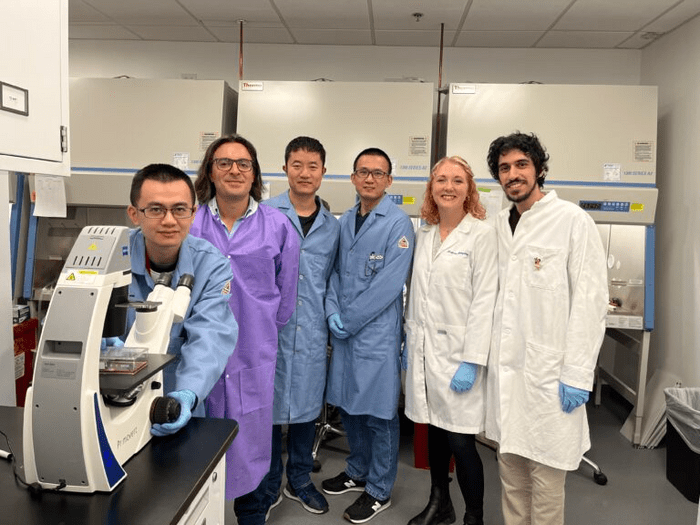
To tackle this issue and help provide a treatment for the millions of people who suffer from this chronic disease, Michael Mitchell, J. Peter and Geri Skirkanich Assistant Professor of Innovation in the Department of Bioengineering, and postdoctoral fellows Xuexiang Han and Ningqiang Gong, found a new way to synthesize ligand-tethered LNPs, increasing their selectivity and allowing them to target liver fibroblasts.

Lulu Xue, Margaret Billingsley, Rakan El-Mayta, Sarah J. Shepherd, Mohamad-Gabriel Alameh and Drew Weissman, Roberts Family Professor in Vaccine Research and Director of the Penn Institute for RNA Innovation at the Perelman School of Medicine, also contributed to this work.

Their study, published in Nature Communications, shows how a small-molecule ligand incorporated into the synthesis of the ionizable lipid, a key component of the LNP, creates an affinity to the notoriously hard-to-target activated fibroblasts in the liver responsible for the buildup of collagen.

The collagen buildup is accompanied by an increased expression of Heat Shock Protein 47 (HSP47), the protein that drives collagen biogenesis and secretion. Overexpression of HSP47 and increased collagen biogenesis ultimately progresses to fibrosis.

Once their LNPs arrive at and enter the target cell, siRNA is released, which silences the expression of HSP47, inhibits the production of collagen and stops fibrosis in its tracks. The treatment, shown to be successful in mice, is a promising treatment for liver fibrosis in humans.

This novel approach to ionizable lipid synthesis is the key to opening many more doors for RNA therapy to treat diverse diseases.

“To make LNPs selective enough to target hepatic stellate cells, those that drive fibrosis, we incorporated an anisamide ligand, a molecule which has a high affinity for the receptor on these stellate cells, into the structure of the ionizable lipid,” says Mitchell. “Essentially, we created a lock-and-key mechanism to target and unlock delivery to these hard-to-reach cells.”

The synthesis process was developed by Han and colleagues as a “one-pot, two-step” process. To create a library of ionizable lipids, the team first put an anisamide ligand (AA) precursor and different amino cores together. They then added the hydrophobic tail to create AA-tethered ionizable lipids. Anisamide was chosen as the ligand due to its neutral and stable nature as well as its affinity for the overexpressed sigma receptors on stellate cells. Once the library of AA-tethered LNPs was created, the team analyzed their abilities to target and deliver therapy to cells through a two-round selection process.

“We needed to find a specific AA-tethered LNP that was both potent and selective,” says Han. “The first round of the selection process was done by examining how well our LNPs could knock down green fluorescence protein (GFP) in fibroblasts to measure potency. GFP provides great visual evidence for how therapeutic RNA turns off gene expression in real time.”

“In the second round, we tested the selective ability of the potent LNP,” says Han. “We did this by blocking the sigma receptor to understand how significant the specific AA ligand group was in the LNPs ability to get into target cells. Unsurprisingly, we showed that the AA group was significant; after the sigma receptor blockade, we lost the lock-and-key mechanism and the AA-tethered LNP would not enter the target cell.”

The team identified AA-T3A-C12 as both a potent and selective LNP carrying therapeutic siRNA able to achieve 65% knockdown of HSP47 expression in mice as well as enhance the recovery of damaged liver tissue. The results of the study conclude that the AA-T3A-C12 LNP outperforms the MC3 LNP, a clinically utilized non-viral vector that has been FDA-approved for use in hepatic, or liver, cell RNA therapy.

This new ligand-tethered LNP provides a form of treatment for liver fibrosis and the synthesis method provides a way to tailor LNPs to other previously hard-to-target cells and tissues in the body.

“The potential of LNPs is enormous,” says Han. “We’re making LNPs smarter and more efficient.”

“We are excited to have produced a potential treatment that tackles the genetic root of this liver disease,” says Mitchell. “And, because this LNP delivery vehicle works in fibrotic cells of the liver, it may lead to developing a treatment for other types of fibrosis in the body, such as fibrosis that arises in the lung or in tumors.”

“Beyond what we have investigated in the liver, this method of creating LNPs can be used to unlock delivery for therapies to other cell types,” he adds. “We could potentially target cells in the brain, lungs or heart by installing specific targeting ligands into the ionizable lipid structure. There are many avenues from here and we are excited to continue pushing this research in new directions.”


Read More

Continue Reading

Uncategorized

February Employment Situation

By Paul Gomme and Peter Rupert The establishment data from the BLS showed a 275,000 increase in payroll employment for February, outpacing the 230,000…

Published

on

By Paul Gomme and Peter Rupert

The establishment data from the BLS showed a 275,000 increase in payroll employment for February, outpacing the 230,000 average over the previous 12 months. The payroll data for January and December were revised down by a total of 167,000. The private sector added 223,000 new jobs, the largest gain since May of last year.

Temporary help services employment continues a steep decline after a sharp post-pandemic rise.

Average hours of work increased from 34.2 to 34.3. The increase, along with the 223,000 private employment increase led to a hefty increase in total hours of 5.6% at an annualized rate, also the largest increase since May of last year.

The establishment report, once again, beat “expectations;” the WSJ survey of economists was 198,000. Other than the downward revisions, mentioned above, another bit of negative news was a smallish increase in wage growth, from $34.52 to $34.57.

The household survey shows that the labor force increased 150,000, a drop in employment of 184,000 and an increase in the number of unemployed persons of 334,000. The labor force participation rate held steady at 62.5, the employment to population ratio decreased from 60.2 to 60.1 and the unemployment rate increased from 3.66 to 3.86. Remember that the unemployment rate is the number of unemployed relative to the labor force (the number employed plus the number unemployed). Consequently, the unemployment rate can go up if the number of unemployed rises holding fixed the labor force, or if the labor force shrinks holding the number unemployed unchanged. An increase in the unemployment rate is not necessarily a bad thing: it may reflect a strong labor market drawing “marginally attached” individuals from outside the labor force. Indeed, there was a 96,000 decline in those workers.

Earlier in the week, the BLS announced JOLTS (Job Openings and Labor Turnover Survey) data for January. There isn’t much to report here as the job openings changed little at 8.9 million, the number of hires and total separations were little changed at 5.7 million and 5.3 million, respectively.

As has been the case for the last couple of years, the number of job openings remains higher than the number of unemployed persons.

Also earlier in the week the BLS announced that productivity increased 3.2% in the 4th quarter with output rising 3.5% and hours of work rising 0.3%.

The bottom line is that the labor market continues its surprisingly (to some) strong performance, once again proving stronger than many had expected. This strength makes it difficult to justify any interest rate cuts soon, particularly given the recent inflation spike.

Read More

Continue Reading

Uncategorized

Mortgage rates fall as labor market normalizes

Jobless claims show an expanding economy. We will only be in a recession once jobless claims exceed 323,000 on a four-week moving average.

Published

on

Everyone was waiting to see if this week’s jobs report would send mortgage rates higher, which is what happened last month. Instead, the 10-year yield had a muted response after the headline number beat estimates, but we have negative job revisions from previous months. The Federal Reserve’s fear of wage growth spiraling out of control hasn’t materialized for over two years now and the unemployment rate ticked up to 3.9%. For now, we can say the labor market isn’t tight anymore, but it’s also not breaking.

The key labor data line in this expansion is the weekly jobless claims report. Jobless claims show an expanding economy that has not lost jobs yet. We will only be in a recession once jobless claims exceed 323,000 on a four-week moving average.

From the Fed: In the week ended March 2, initial claims for unemployment insurance benefits were flat, at 217,000. The four-week moving average declined slightly by 750, to 212,250


Below is an explanation of how we got here with the labor market, which all started during COVID-19.

1. I wrote the COVID-19 recovery model on April 7, 2020, and retired it on Dec. 9, 2020. By that time, the upfront recovery phase was done, and I needed to model out when we would get the jobs lost back.

2. Early in the labor market recovery, when we saw weaker job reports, I doubled and tripled down on my assertion that job openings would get to 10 million in this recovery. Job openings rose as high as to 12 million and are currently over 9 million. Even with the massive miss on a job report in May 2021, I didn’t waver.

Currently, the jobs openings, quit percentage and hires data are below pre-COVID-19 levels, which means the labor market isn’t as tight as it once was, and this is why the employment cost index has been slowing data to move along the quits percentage.  

2-US_Job_Quits_Rate-1-2

3. I wrote that we should get back all the jobs lost to COVID-19 by September of 2022. At the time this would be a speedy labor market recovery, and it happened on schedule, too

Total employment data

4. This is the key one for right now: If COVID-19 hadn’t happened, we would have between 157 million and 159 million jobs today, which would have been in line with the job growth rate in February 2020. Today, we are at 157,808,000. This is important because job growth should be cooling down now. We are more in line with where the labor market should be when averaging 140K-165K monthly. So for now, the fact that we aren’t trending between 140K-165K means we still have a bit more recovery kick left before we get down to those levels. 


From BLS: Total nonfarm payroll employment rose by 275,000 in February, and the unemployment rate increased to 3.9 percent, the U.S. Bureau of Labor Statistics reported today. Job gains occurred in health care, in government, in food services and drinking places, in social assistance, and in transportation and warehousing.

Here are the jobs that were created and lost in the previous month:

IMG_5092

In this jobs report, the unemployment rate for education levels looks like this:

  • Less than a high school diploma: 6.1%
  • High school graduate and no college: 4.2%
  • Some college or associate degree: 3.1%
  • Bachelor’s degree or higher: 2.2%
IMG_5093_320f22

Today’s report has continued the trend of the labor data beating my expectations, only because I am looking for the jobs data to slow down to a level of 140K-165K, which hasn’t happened yet. I wouldn’t categorize the labor market as being tight anymore because of the quits ratio and the hires data in the job openings report. This also shows itself in the employment cost index as well. These are key data lines for the Fed and the reason we are going to see three rate cuts this year.

Read More

Continue Reading

Uncategorized

Inside The Most Ridiculous Jobs Report In History: Record 1.2 Million Immigrant Jobs Added In One Month

Inside The Most Ridiculous Jobs Report In History: Record 1.2 Million Immigrant Jobs Added In One Month

Last month we though that the January…

Published

on

Inside The Most Ridiculous Jobs Report In History: Record 1.2 Million Immigrant Jobs Added In One Month

Last month we though that the January jobs report was the "most ridiculous in recent history" but, boy, were we wrong because this morning the Biden department of goalseeked propaganda (aka BLS) published the February jobs report, and holy crap was that something else. Even Goebbels would blush. 

What happened? Let's take a closer look.

On the surface, it was (almost) another blockbuster jobs report, certainly one which nobody expected, or rather just one bank out of 76 expected. Starting at the top, the BLS reported that in February the US unexpectedly added 275K jobs, with just one research analyst (from Dai-Ichi Research) expecting a higher number.

Some context: after last month's record 4-sigma beat, today's print was "only" 3 sigma higher than estimates. Needless to say, two multiple sigma beats in a row used to only happen in the USSR... and now in the US, apparently.

Before we go any further, a quick note on what last month we said was "the most ridiculous jobs report in recent history": it appears the BLS read our comments and decided to stop beclowing itself. It did that by slashing last month's ridiculous print by over a third, and revising what was originally reported as a massive 353K beat to just 229K,  a 124K revision, which was the biggest one-month negative revision in two years!

Of course, that does not mean that this month's jobs print won't be revised lower: it will be, and not just that month but every other month until the November election because that's the only tool left in the Biden admin's box: pretend the economic and jobs are strong, then revise them sharply lower the next month, something we pointed out first last summer and which has not failed to disappoint once.

To be fair, not every aspect of the jobs report was stellar (after all, the BLS had to give it some vague credibility). Take the unemployment rate, after flatlining between 3.4% and 3.8% for two years - and thus denying expectations from Sahm's Rule that a recession may have already started - in February the unemployment rate unexpectedly jumped to 3.9%, the highest since February 2022 (with Black unemployment spiking by 0.3% to 5.6%, an indicator which the Biden admin will quickly slam as widespread economic racism or something).

And then there were average hourly earnings, which after surging 0.6% MoM in January (since revised to 0.5%) and spooking markets that wage growth is so hot, the Fed will have no choice but to delay cuts, in February the number tumbled to just 0.1%, the lowest in two years...

... for one simple reason: last month's average wage surge had nothing to do with actual wages, and everything to do with the BLS estimate of hours worked (which is the denominator in the average wage calculation) which last month tumbled to just 34.1 (we were led to believe) the lowest since the covid pandemic...

... but has since been revised higher while the February print rose even more, to 34.3, hence why the latest average wage data was once again a product not of wages going up, but of how long Americans worked in any weekly period, in this case higher from 34.1 to 34.3, an increase which has a major impact on the average calculation.

While the above data points were examples of some latent weakness in the latest report, perhaps meant to give it a sheen of veracity, it was everything else in the report that was a problem starting with the BLS's latest choice of seasonal adjustments (after last month's wholesale revision), which have gone from merely laughable to full clownshow, as the following comparison between the monthly change in BLS and ADP payrolls shows. The trend is clear: the Biden admin numbers are now clearly rising even as the impartial ADP (which directly logs employment numbers at the company level and is far more accurate), shows an accelerating slowdown.

But it's more than just the Biden admin hanging its "success" on seasonal adjustments: when one digs deeper inside the jobs report, all sorts of ugly things emerge... such as the growing unprecedented divergence between the Establishment (payrolls) survey and much more accurate Household (actual employment) survey. To wit, while in January the BLS claims 275K payrolls were added, the Household survey found that the number of actually employed workers dropped for the third straight month (and 4 in the past 5), this time by 184K (from 161.152K to 160.968K).

This means that while the Payrolls series hits new all time highs every month since December 2020 (when according to the BLS the US had its last month of payrolls losses), the level of Employment has not budged in the past year. Worse, as shown in the chart below, such a gaping divergence has opened between the two series in the past 4 years, that the number of Employed workers would need to soar by 9 million (!) to catch up to what Payrolls claims is the employment situation.

There's more: shifting from a quantitative to a qualitative assessment, reveals just how ugly the composition of "new jobs" has been. Consider this: the BLS reports that in February 2024, the US had 132.9 million full-time jobs and 27.9 million part-time jobs. Well, that's great... until you look back one year and find that in February 2023 the US had 133.2 million full-time jobs, or more than it does one year later! And yes, all the job growth since then has been in part-time jobs, which have increased by 921K since February 2023 (from 27.020 million to 27.941 million).

Here is a summary of the labor composition in the past year: all the new jobs have been part-time jobs!

But wait there's even more, because now that the primary season is over and we enter the heart of election season and political talking points will be thrown around left and right, especially in the context of the immigration crisis created intentionally by the Biden administration which is hoping to import millions of new Democratic voters (maybe the US can hold the presidential election in Honduras or Guatemala, after all it is their citizens that will be illegally casting the key votes in November), what we find is that in February, the number of native-born workers tumbled again, sliding by a massive 560K to just 129.807 million. Add to this the December data, and we get a near-record 2.4 million plunge in native-born workers in just the past 3 months (only the covid crash was worse)!

The offset? A record 1.2 million foreign-born (read immigrants, both legal and illegal but mostly illegal) workers added in February!

Said otherwise, not only has all job creation in the past 6 years has been exclusively for foreign-born workers...

Source: St Louis Fed FRED Native Born and Foreign Born

... but there has been zero job-creation for native born workers since June 2018!

This is a huge issue - especially at a time of an illegal alien flood at the southwest border...

... and is about to become a huge political scandal, because once the inevitable recession finally hits, there will be millions of furious unemployed Americans demanding a more accurate explanation for what happened - i.e., the illegal immigration floodgates that were opened by the Biden admin.

Which is also why Biden's handlers will do everything in their power to insure there is no official recession before November... and why after the election is over, all economic hell will finally break loose. Until then, however, expect the jobs numbers to get even more ridiculous.

Tyler Durden Fri, 03/08/2024 - 13:30

Read More

Continue Reading

Trending