Research: Brookfield just might Stay Knocked Down due to the Pandemic BAM


Spread & Containment
IFM’s Hat Trick and Reflections On Option-To-Buy M&A
Today IFM Therapeutics announced the acquisition of IFM Due, one of its subsidiaries, by Novartis. Back in Sept 2019, IFM granted Novartis the right to…
Share this:

Today IFM Therapeutics announced the acquisition of IFM Due, one of its subsidiaries, by Novartis. Back in Sept 2019, IFM granted Novartis the right to acquire IFM Due as part of an “option to buy” collaboration around cGAS-STING antagonists for autoimmune disease.
This secures for IFM what is a rarity for a single biotech company: a liquidity hat trick, as this milestone represents the third successful exit of an IFM Therapeutics subsidiary since its inception in 2015.
Back in 2017, BMS purchased IFM’s NLRP3 and STING agonists for cancer. In early 2019, Novartis acquired IFM Tre for NLRP3 antagonists for autoimmune disease, which are now being studied in multiple Phase 2 studies. Then, later in 2019, Novartis secured the right to acquire IFM Due after their lead program entered clinical development. Since inception, across the three exits, IFM has secured over $700M in upfront cash payments and north of $3B in biobucks.
Kudos to the team, led by CEO Martin Seidel since 2019, for their impressive and continued R&D and BD success.
Option-to-Acquire Deals
These days option-based M&A deals aren’t in vogue: in large part because capital generally remains abundant despite the contraction, and there’s still a focus on “going big” for most startup companies. That said, lean capital efficiency around asset-centric product development with a partner can still drive great returns. In different settings or stages of the market cycle, different deal configurations can make sense.
During the pandemic boom, when the world was awash in capital chasing deals, “going long” as independent company was an easy choice for most teams. But in tighter markets, taking painful levels of equity dilution may be less compelling than securing a lucrative option-based M&A deal.
For historical context, these option-based M&A deals were largely borne out of necessity in far more challenging capital markets (2010-2012) on the venture front, when both the paucity of private financing and the tepid exit environment for early stage deals posed real risks to biotech investment theses. Pharma was willing to engage on early clinical or even preclinical assets with these risk-sharing structures as a way to secure optionality for their emerging pipelines.
As a comparison, in 2012, total venture capital funding into biotech was less than quarter of what it is now, even post bubble contraction, and back then we had witnessed only a couple dozen IPOs in the prior 3 years combined. And most of those IPOs were later stage assets in 2010-2012. Times were tough for biotech venture capital. Option-based deals and capital efficient business models were part of ecosystem’s need for experimentation and external R&D innovation.
Many flavors of these option-based deals continued to get done for the rest of the decade, and indeed some are still getting done, albeit at a much less frequent cadence. Today, the availability of capital on the supply side, and the reduced appetite for preclinical or early stage acquisitions on the demand side, have limited the role of these option to buy transactions in the current ecosystem.
But if the circumstances are right, these deals can still make some sense: a constructive combination of corporate strategy, funding needs, risk mitigation, and collaborative expertise must come together. In fact, Arkuda Therapeutics, one of our neuroscience companies, just announced a new option deal with Janssen.
Stepping back, it’ s worth asking what has been the industry’s success rate with these “option to buy” deals.
Positive anecdotes of acquisition options being exercised over the past few years are easy to find. We’ve seen Takeda exercise its right to acquire Maverick for T-cell engagers and GammaDelta for its cellular immunotherapy, among other deals. AbbVie recently did the same with Mitokinin for a Parkinson’s drug. On the negative side, in a high profile story last month, Gilead bailed on purchasing Tizona after securing that expensive $300M option a few years ago.
But these are indeed just a few anecdotes; what about data since these deal structures emerged circa 2010? Unfortunately, as these are mostly private deals with undisclosed terms, often small enough to be less material to the large Pharma buyer, there’s really no great source of comprehensive data on the subject. But a reasonable guess is that the proportion of these deals where the acquisition right is exercised is likely 30%.
This estimate comes from triangulating from a few sources. A quick and dirty dataset from DealForma, courtesy of Tim Opler at Stifel, suggests 30% or so for deals 2010-2020. Talking to lawyers from Goodwin and Cooley, they also suggest ballpark of 30-50% in their experience. The shareholder representatives at SRS Acquiom (who manage post-M&A milestones and escrows) also shared with me that about 33%+ of the option deals they tracked had converted positively to an acquisition. As you might expect, this number is not that different than milestone payouts after an outright acquisition, or future payments in licensing deals. R&D failure rates and aggregate PoS will frequently dictate that within a few years, only a third of programs will remain alive and well.
Atlas’ experience with Option-based M&A deals
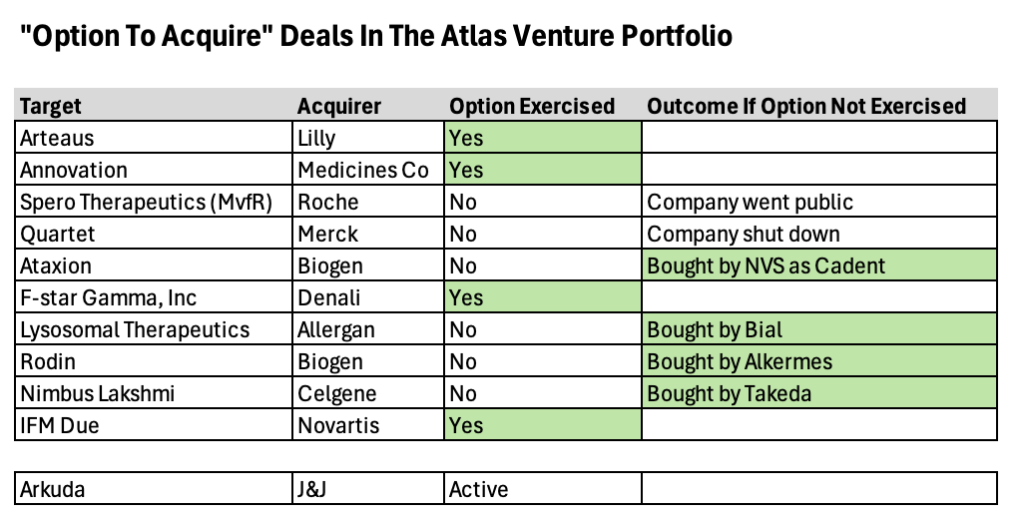
Looking back, we’ve done nearly a dozen of these option-to-buy deals since 2010. These took many flavors, from strategic venture co-creation where the option was granted at inception (e.g., built-to-buy deals like Arteaus and Annovation) to other deals where the option was sold as part of BD transaction for a maturing company (e.g., Lysosomal Therapeutics for GBA-PD).
Our hit rate with the initial option holder has been about 40%; these are cases where the initial Pharma that bought the option moves ahead and exercises that right to purchase the company. Most of these initial deals were done around pre- or peri-clinical stage assets. But equally interesting, if not more so, is that in situations where the option expired without being exercised, but the asset continued forward into development, all of these were subsequently acquired by other Pharma buyers – and all eight of these investments generated positive returns for Atlas funds. For example, Rodin and Ataxion had option deals with Biogen (here, here) that weren’t exercised, and went on to be acquired by Alkermes and Novartis (here, here). And Nimbus Lakshmi for TYK2 was originally an option deal with Celgene, and went on to be purchased by Takeda.
For the two that weren’t acquired via the option or later, science was the driving factor. Spero was originally an LLC holding company model, and Roche had a right to purchase a subsidiary with a quorum-sensing antibacterial program (MvfR). And Quartet had a non-opioid pain program where Merck had acquired an option. Both of these latter programs were terminated for failing to advance in R&D.
Option deals are often criticized for “capping the upside” or creating “captive companies” – and there’s certainly some truth to that. These deals are structured, typically with pre-specified return curves, so there is a dollar value that one is locked into and the presence of the option right typically precludes a frothy IPO scenario. But in aggregate across milestones and royalties, these deals can still secure significant “Top 1%” venture upside though if negotiated properly and when the asset reaches the market: for example, based only on public disclosures, Arteaus generated north of $300M in payments across the upfront, milestones, and royalties, after spending less than $18M in equity capital. The key is to make sure the right-side of the return tail are included in the deal configuration – so if the drug progresses to the market, everyone wins.
Importantly, once in place, these deals largely protect both the founders and early stage investors from further equity dilution. While management teams that are getting reloaded with new stock with every financing may be indifferent to dilution, existing shareholders (founders and investors alike) often aren’t – so they may find these deals, when negotiated favorably, to be attractive relative to the alternative of being washed out of the cap table. This is obviously less of a risk in a world where the cost of capital is low and funding widely available.
These deal structures also have some other meaningful benefits worth considering though: they reduce financing risk in challenging equity capital markets, as the buyer often funds the entity with an option payment through the M&A trigger event, and they reduce exit risk, as they have a pre-specified path to realizing liquidity. Further, the idea that the assets are “tainted” if the buyer walks hasn’t been borne out in our experience, where all of the entities with active assets after the original option deal expired were subsequently acquired by other players, as noted above.
In addition, an outright sale often puts our prized programs in the hands of large and plodding bureaucracies before they’ve been brought to patients or later points in development. This can obviously frustrate development progress. For many capable teams, keeping the asset in their stewardship even while being “captive”, so they can move it quickly down the R&D path themselves, is an appealing alternative to an outright sale – especially if there’s greater appreciation of value with that option point.
Option-based M&A deals aren’t right for every company or every situation, and in recent years have been used only sparingly across the sector. They obviously only work in practice for private companies, often as alternative to larger dilutive financings on the road to an IPO. But for asset-centric stories with clear development paths and known capital requirements, they can still be a useful tool in the BD toolbox – and can generate attractive venture-like returns for shareholders.
Like others in the biotech ecosystem, Atlas hasn’t done many of these deals in recent funds. And it’s unlikely these deals will come back in vogue with what appears to be 2024’s more constructive fundraising environment (one that’s willing to fund early stage stories), but if things get tighter or Pharma re-engages earlier in the asset continuum, these could return to being important BD tools. It will be interesting to see what role they may play in the broader external R&D landscape over the next few years.
Most importantly, circling back to point of the blog, kudos to the team at IFM and our partners at Novartis!
The post IFM’s Hat Trick and Reflections On Option-To-Buy M&A appeared first on LifeSciVC.
preclinical pandemic mitigationGovernment
Student Loan Forgiveness Is Robbing Peter To Pay Paul
Student Loan Forgiveness Is Robbing Peter To Pay Paul
Via SchiffGold.com,
With President Biden’s Saving on a Valuable Education (SAVE)…
Share this:


With President Biden’s Saving on a Valuable Education (SAVE) plan set to extend more student loan relief to borrowers this summer, the federal government is pretending it can wave a magic wand to make debts disappear. But the truth of student debt “relief” is that they’re simply shifting the burden to everyone else, robbing Peter to pay Paul and funneling more steam into an inflation pressure cooker that’s already set to burst.
Starting July 1st, new rules go into effect that change the discretionary income requirements for their payment plans from 10% to only 5% for undergraduates, leading to lower payments for millions. Some borrowers will even have their owed balances revert to zero.
What the plan doesn’t describe, predictably, is how that burden will be shifted to the rest of the country by stealing value out of their pockets via new taxes or increased inflation, which still simmering well above levels seen in early 2020 before the Fed printed trillions in Covid “stimulus” money. They’re rewarding students who took out loans they can’t afford and punishing those who paid their way or repaid their loans, attending school while living within their means. And they’re stealing from the entire country to finance it.
Biden actually claims that a continuing Covid “emergency” is what gives him the authority to offer student loan forgiveness to begin with. As with any “temporary” measure that gives state power a pretense to grow, or gives them an excuse to collect more revenue (I’m looking at you, federal income tax), COVID-19 continues to be the gift that keeps on giving for power and revenue-hungry politicians even as the CDC reclassifies the virus as a threat similar to the seasonal flu.
The SAVE plan takes the burden of billions of dollars in owed payments away from students and adds it to a national debt that’s already ballooning to the tune of a mind-boggling trillion dollars every 3 months. If all student loan debt were forgiven, according to the Brookings Institution, it would surpass the cumulative totals for the past 20 years for multiple existing tax credits and welfare programs:
“Forgiving all student debt would be a transfer larger than the amounts the nation has spent over the past 20 years on unemployment insurance, larger than the amount it has spent on the Earned Income Tax Credit, and larger than the amount it has spent on food stamps.”
Ironically enough, adding hundreds of billions to the national debt from Biden’s program is likely to cause the most pain to the very demographics the Biden administration claims to be helping with its plan: poor people, anyone who skipped college entirely or paid their loans back, and other already overly-indebted young adults, whose purchasing power is being rapidly eroded by out-of-control government spending and central bank monetary shenanigans. It effectively transfers even more wealth from the poor to the wealthy, a trend that Covid-era measures have taken to new extremes.
As Ron Paul pointed out in a recent op-ed for the Eurasia Review:
“…these loans will be paid off in part by taxpayers who did not go to college, paid their own way through school, or have already paid off their student loans. Since those with college degrees tend to earn more over time than those without them, this program redistributes wealth from lower to higher income Americans.”
Even some progressives are taking aim at the plan, not because it shifts the debt burden to other Americans, but because it will require cutting welfare or sacrificing other expensive social programs promised by Biden such as universal pre-K. For these critics, the issue isn’t so much that spending and debt are totally out of control, but that they’re being funneled into the wrong issues.
Progressive “solutions” always seem to take the form of slogans like “tax the wealthy,” a feel-good bromide that for lawmakers always seems to translate into increased taxes for the middle and lower-upper class. Meanwhile, the .01% continue to avoid taxes through offshore accounts, money laundering trickery dressed up as philanthropy, and general de facto ownership of the system through channels like political donations and aggressive lobbying.
If new waves of college applicants expect loan forgiveness plans to continue, it also encourages schools to continue raising tuition and motivates prospective students to continue with even more irresponsible borrowing.
This puts pressure on the Fed to keep interest rates lower to help accommodate waves of new student loan applicants from sparkly-eyed young borrowers who figure they’ll never really have to pay the money back.
With the Fed already expected to cut rates this year despite inflation not being properly under control, the loan forgiveness scheme is just one of many factors conspiring to cause inflation to start running hotter again, spiraling out of control, as the entire country is forced to pay the hidden tax of price increases for all their basic needs.
Uncategorized
Bougie Broke The Financial Reality Behind The Facade
Social media users claiming to be Bougie Broke share pictures of their fancy cars, high-fashion clothing, and selfies in exotic locations and expensive…
Share this:


Social media users claiming to be Bougie Broke share pictures of their fancy cars, high-fashion clothing, and selfies in exotic locations and expensive restaurants. Yet they complain about living paycheck to paycheck and lacking the means to support their lifestyle.
Bougie broke is like “keeping up with the Joneses,” spending beyond one’s means to impress others.
Bougie Broke gives us a glimpse into the financial condition of a growing number of consumers. Since personal consumption represents about two-thirds of economic activity, it’s worth diving into the Bougie Broke fad to appreciate if a large subset of the population can continue to consume at current rates.
The Wealth Divide Disclaimer
Forecasting personal consumption is always tricky, but it has become even more challenging in the post-pandemic era. To appreciate why we share a joke told by Mike Green.
Bill Gates and I walk into the bar…
Bartender: “Wow… a couple of billionaires on average!”
Bill Gates, Jeff Bezos, Elon Musk, Mark Zuckerberg, and other billionaires make us all much richer, on average. Unfortunately, we can’t use the average to pay our bills.
According to Wikipedia, Bill Gates is one of 756 billionaires living in the United States. Many of these billionaires became much wealthier due to the pandemic as their investment fortunes proliferated.
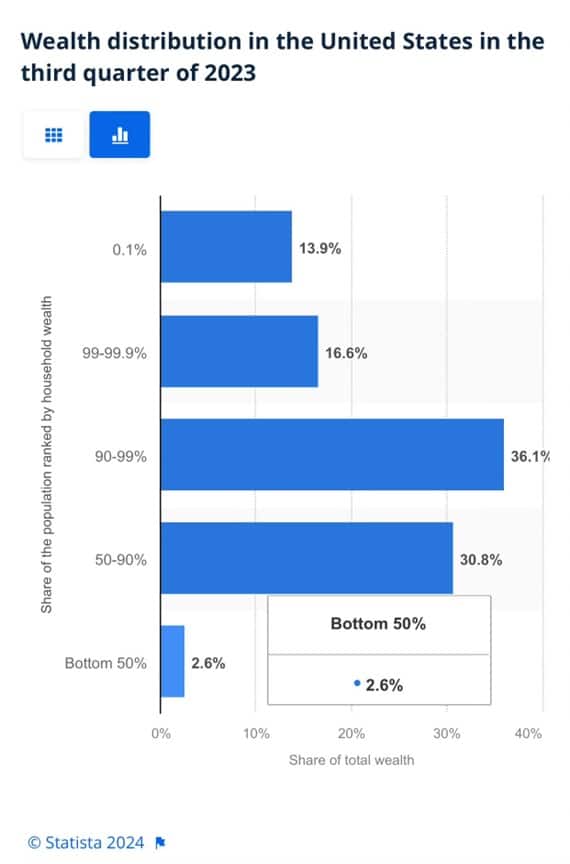
To appreciate the wealth divide, consider the graph below courtesy of Statista. 1% of the U.S. population holds 30% of the wealth. The wealthiest 10% of households have two-thirds of the wealth. The bottom half of the population accounts for less than 3% of the wealth.
The uber-wealthy grossly distorts consumption and savings data. And, with the sharp increase in their wealth over the past few years, the consumption and savings data are more distorted.
Furthermore, and critical to appreciate, the spending by the wealthy doesn’t fluctuate with the economy. Therefore, the spending of the lower wealth classes drives marginal changes in consumption. As such, the condition of the not-so-wealthy is most important for forecasting changes in consumption.
Revenge Spending
Deciphering personal data has also become more difficult because our spending habits have changed due to the pandemic.
A great example is revenge spending. Per the New York Times:
Ola Majekodunmi, the founder of All Things Money, a finance site for young adults, explained revenge spending as expenditures meant to make up for “lost time” after an event like the pandemic.
So, between the growing wealth divide and irregular spending habits, let’s quantify personal savings, debt usage, and real wages to appreciate better if Bougie Broke is a mass movement or a silly meme.
The Means To Consume
Savings, debt, and wages are the three primary sources that give consumers the ability to consume.
Savings
The graph below shows the rollercoaster on which personal savings have been since the pandemic. The savings rate is hovering at the lowest rate since those seen before the 2008 recession. The total amount of personal savings is back to 2017 levels. But, on an inflation-adjusted basis, it’s at 10-year lows. On average, most consumers are drawing down their savings or less. Given that wages are increasing and unemployment is historically low, they must be consuming more.
Now, strip out the savings of the uber-wealthy, and it’s probable that the amount of personal savings for much of the population is negligible. A survey by Payroll.org estimates that 78% of Americans live paycheck to paycheck.

More on Insufficient Savings
The Fed’s latest, albeit old, Report on the Economic Well-Being of U.S. Households from June 2023 claims that over a third of households do not have enough savings to cover an unexpected $400 expense. We venture to guess that number has grown since then. To wit, the number of households with essentially no savings rose 5% from their prior report a year earlier.
Relatively small, unexpected expenses, such as a car repair or a modest medical bill, can be a hardship for many families. When faced with a hypothetical expense of $400, 63 percent of all adults in 2022 said they would have covered it exclusively using cash, savings, or a credit card paid off at the next statement (referred to, altogether, as “cash or its equivalent”). The remainder said they would have paid by borrowing or selling something or said they would not have been able to cover the expense.
Debt
After periods where consumers drained their existing savings and/or devoted less of their paychecks to savings, they either slowed their consumption patterns or borrowed to keep them up. Currently, it seems like many are choosing the latter option. Consumer borrowing is accelerating at a quicker pace than it was before the pandemic.
The first graph below shows outstanding credit card debt fell during the pandemic as the economy cratered. However, after multiple stimulus checks and broad-based economic recovery, consumer confidence rose, and with it, credit card balances surged.
The current trend is steeper than the pre-pandemic trend. Some may be a catch-up, but the current rate is unsustainable. Consequently, borrowing will likely slow down to its pre-pandemic trend or even below it as consumers deal with higher credit card balances and 20+% interest rates on the debt.

The second graph shows that since 2022, credit card balances have grown faster than our incomes. Like the first graph, the credit usage versus income trend is unsustainable, especially with current interest rates.

With many consumers maxing out their credit cards, is it any wonder buy-now-pay-later loans (BNPL) are increasing rapidly?
Insider Intelligence believes that 79 million Americans, or a quarter of those over 18 years old, use BNPL. Lending Tree claims that “nearly 1 in 3 consumers (31%) say they’re at least considering using a buy now, pay later (BNPL) loan this month.”More telling, according to their survey, only 52% of those asked are confident they can pay off their BNPL loan without missing a payment!
Wage Growth
Wages have been growing above trend since the pandemic. Since 2022, the average annual growth in compensation has been 6.28%. Higher incomes support more consumption, but higher prices reduce the amount of goods or services one can buy. Over the same period, real compensation has grown by less than half a percent annually. The average real compensation growth was 2.30% during the three years before the pandemic.
In other words, compensation is just keeping up with inflation instead of outpacing it and providing consumers with the ability to consume, save, or pay down debt.
It’s All About Employment
The unemployment rate is 3.9%, up slightly from recent lows but still among the lowest rates in the last seventy-five years.

The uptick in credit card usage, decline in savings, and the savings rate argue that consumers are slowly running out of room to keep consuming at their current pace.
However, the most significant means by which we consume is income. If the unemployment rate stays low, consumption may moderate. But, if the recent uptick in unemployment continues, a recession is extremely likely, as we have seen every time it turned higher.
It’s not just those losing jobs that consume less. Of greater impact is a loss of confidence by those employed when they see friends or neighbors being laid off.
Accordingly, the labor market is probably the most important leading indicator of consumption and of the ability of the Bougie Broke to continue to be Bougie instead of flat-out broke!
Summary
There are always consumers living above their means. This is often harmless until their means decline or disappear. The Bougie Broke meme and the ability social media gives consumers to flaunt their “wealth” is a new medium for an age-old message.
Diving into the data, it argues that consumption will likely slow in the coming months. Such would allow some consumers to save and whittle down their debt. That situation would be healthy and unlikely to cause a recession.
The potential for the unemployment rate to continue higher is of much greater concern. The combination of a higher unemployment rate and strapped consumers could accentuate a recession.
The post Bougie Broke The Financial Reality Behind The Facade appeared first on RIA.
recession unemployment pandemic economic recovery stimulus fed recession recovery interest rates unemployment stimulus

IFM’s Hat Trick and Reflections On Option-To-Buy M&A


Student Loan Forgiveness Is Robbing Peter To Pay Paul


Bougie Broke The Financial Reality Behind The Facade


Analyst reviews Apple stock price target amid challenges


Major typhoid fever surveillance study in sub-Saharan Africa indicates need for the introduction of typhoid conjugate vaccines in endemic countries


US Spent More Than Double What It Collected In February, As 2024 Deficit Is Second Highest Ever… And Debt Explodes


Buried Project Veritas Recording Shows Top Pfizer Scientists Suppressed Concerns Over COVID-19 Boosters, MRNA Tech


Association of prenatal vitamins and metals with epigenetic aging at birth and in childhood


A beginner’s guide to the taxes you’ll hear about this election season


Analyzing Capital Market Trends
-

 Uncategorized3 weeks ago
All Of The Elements Are In Place For An Economic Crisis Of Staggering Proportions
-

 International5 days ago
EyePoint poaches medical chief from Apellis; Sandoz CFO, longtime BioNTech exec to retire
-

 Uncategorized4 weeks ago
California Counties Could Be Forced To Pay $300 Million To Cover COVID-Era Program
-

 Uncategorized3 weeks ago
Apparel Retailer Express Moving Toward Bankruptcy
-

 Uncategorized4 weeks ago
Industrial Production Decreased 0.1% in January
-

 International5 days ago
Walmart launches clever answer to Target’s new membership program
-

 Uncategorized4 weeks ago
RFK Jr: The Wuhan Cover-Up & The Rise Of The Biowarfare-Industrial Complex
-

 Uncategorized3 weeks ago
GOP Efforts To Shore Up Election Security In Swing States Face Challenges