Renters: Results from the Zillow Consumer Housing Trends Report 2022
The 2022 Consumer Housing Trends Report (CHTR) provides a snapshot of what housing consumers are thinking and doing in early-to-mid 2022. In this report,…
More than two years into a global pandemic, the housing market continues to witness unprecedented shifts: recent weeks and months have seen skyrocketing interest rates, a softening buyers' market, and climbing rents. While many of these changes are reshaping the homebuying process and renters' plans and preferences, many renters' behaviors, intentions, and preferences have remained relatively stable over the last year. Amid the flurry of external change, much of the rental market remains following the pandemic-catalyzed new 'normal.'
The 2022 Consumer Housing Trends Report (CHTR) provides a snapshot of what housing consumers are thinking and doing in early-to-mid 2022. In this report, we take a deeper look at renters For the first time in recent years, CHTR includes both renters who have moved in the last year (the historical focus of the report), as well as tenured renters who have lived in their homes longer. In other CHTR 2022 reports, we examine homeowners, buyers, and sellers more closely. Information about who renters are in 2022 equips business teams with information they need to make informed decisions in this transformed housing market landscape.
Who are renters?
The typical US renter is 39 years old. Compared with the adult population as a whole, renters generally tend to be younger, less likely to identify as white, more likely to have never been married, and, and more likely to identify as LGBTQ+. These trends are especially true for recent renters. Demographic change tends to play out over a long time: Most of these characteristics have not changed substantially, if at all, over the last few years.
As we will detail throughout the report, there are several notable differences by renter tenure. For example, for renters who moved in the last year (recent renters), the median age is 31 years old. Renters who have lived in their current home for at least a year are typically older: their median age is 42 years old.
What do their homes look like?
Most renters (55%) live in an apartment building. The typical rental home has 2 bedrooms and 1.5 bathrooms, and is 1000 – 1999 square feet (500-999 for recent renters).[1] About two-thirds of recent renters (68%) moved from a previous rental.
How much do recent renters pay upfront?
The typical (median) recent renter submitted 2 applications. For those that paid an application fee (68%), the typical amount was between $40 and $59. Most recent renters (87%) also reported paying a security deposit — typically $500 to $999 among renters that paid one. Application fees and security deposits follow many similar trends: renters in urban and suburban areas, renters of color, younger renters, and renters in regions with the most expensive rental markets are all more likely to pay an application fee and/or a security deposit, and those upfront costs tend to be higher.
What characteristics do they consider important in a rental?
From a series of home characteristics, renters are most likely to say that a home that's within their initial budget is very or extremely important (80%), followed by having their preferred number of bedrooms (68%). Despite continued easing of COVID-19-pandemic restrictions, recent renters remained similarly unlikely to consider shared amenities like gyms, rooftop decks and pet areas as highly important.
Who is planning to move (again)?
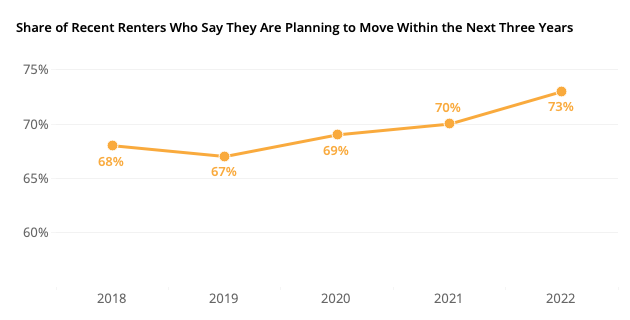
About two-thirds of renters (64%) say they are considering moving within the next three years. For recent renters, the share is even larger: 73% say they plan to move again in the next three years. Despite the unprecedented events of the last two years, this number has remained relatively flat from 2018 (68%), 2019 (67%), 2020 (69%), and 2021 (70%). Among those considering moving, about half (48%) say they plan to continue renting while almost two-in-five (37%) say they plan to buy their next home. The remainder (6%) say they plan to have another living situation.
Survey Methodology
Research Approach
In order to gain a comprehensive understanding of U.S. renters, Zillow Group Population Science conducted three nationally representative surveys – each sampling with at least 3,000 renter-respondents. In total, the three surveys contain information from 8,300 unique renters – more than 2,500 recent renters and 5,700 tenured renters. Participants were allowed to take more than one survey. The study was fielded between March and June 2022.
Wherever possible, survey questions from previous years were asked in the same manner this year to allow for the measurement of year-to-year trends in key areas of business interest.
For the purpose of this study, "renters" refers to household decision makers 18 years of age or older who rent their primary residence. "Recent renters" refer to those that moved in the past year, and "tenured renters" refer to those that did not move in the past year.
Sampling & Weighting
Results from this survey are nationally representative of renters. To achieve representativeness, ZG Population Science used a two-prong approach. First, the initial recruitment to the sample was balanced to all renters from the U.S. Census Bureau, 2019 American Community Survey (ACS) on the basis of age, relationship status, income, ethnicity/race, education, region and sex. The survey targeted subgroups based on all key household demographic characteristics. Second, statistical raking was used to create calibration weights to ensure that the distribution of survey respondents matched the U.S. population with respect to a number of key demographic characteristics. Weighting benchmarks used the 2019 ACS for race and income and the 2021 Current Population Survey Annual Social and Economic Supplement (CPS ASEC) for geographic division/region, education, age and sex.
Quality Control
To reduce response bias, survey respondents did not know that Zillow Group was conducting the survey. Several additional quality control measures were also taken to ensure data accuracy:
We identified and terminated any professional respondents, robots or those taking the survey on multiple devices.
Completion times were recorded to ensure that surveys submitted by the fastest respondents, who may have rushed through the survey, did not provide poor quality data. If necessary, these respondents were removed from the sample.
In-survey quality control checks identified illogical or unrealistic responses.
Additional Data Sources
Unless otherwise specified, estimates in this report come from the Consumer Housing Trends Report (CHTR) 2022, and year-over-year comparisons also use data from CHTR 2018, CHTR 2019 CHTR 2020, and CHTR 2021. To provide a fuller picture of the state of home rentals and renters' characteristics, preferences and behaviors, we also analyzed data from other sources:
U.S. Census Bureau, 2019 American Community Survey – Despite the release of ACS 2020 data, changes in sampling methodology during the pandemic resulted in certain unrealistic estimates for renters. To better capture renter heterogeneity, Zillow Population Science used ACS 2019 as the most recently available reliable dataset from the U.S. Census Bureau's survey of the U.S. population. The ACS is the nation's largest survey and is based on a probability sample; as such, it is considered one of the leading sources of information on U.S. population and housing.
U.S. Census Bureau, 2021 Current Population Survey Annual Social and Economic Supplement – The CPS ASEC offers the most recent demographic estimates on renters.
Zillow.com website metrics – To provide additional context for survey results, ZG Population Science also examined internal Zillow data on rental listing information, rental applications, and page view / app use metrics.
Zillow Group Population Science Fall 2020 Survey of Renters – Because many young renters moved out of the rental market at the start of the COVID-19 pandemic, this survey supplemented previous ZG Population Science research on both shifting and stable sentiment among renters while capturing an age demographic that was atypically absent from the rental market earlier that year. Topics included renter preference on location, virtual home searching tools, and reasons for moving.
The Typical Renter & Rental
In this section, we provide a high-level overview of key renter info and what their homes look like. According to Census Bureau 2021 Current Population Survey Annual Social and Economic Supplement, 30% of adults in the country are renters (regardless of whether they moved in the past year). About a fifth (17%) of these renters moved in the past year.
Age
The median age of U.S. renters is 37 years old and about two-thirds (65%) of renters are under the age of 40; only 8% of renters are in their seventies or older, and 9% are in their sixties. In other words, the age distribution of renters trends younger than the overall U.S. population. While past research has referred to renters that moved in the past year, renters as a whole, including tenured renters who did not move, skew older. The median age for a tenured renter (who did not move in the past year) is 39 — almost a decade older than the typical renter that moved (30).
Consistent with age, the largest generational group of renters is between 27 and 41 years old in 2021 — the group colloquially known as "Millennials." About 42% of renters are Millennials.
Race & Ethnicity
Just over half of renters are non-Hispanic white or Caucasian (56%), smaller than the overall share of the U.S. adult population that is white (63%). At the same time, 12% of U.S. adults identify as non-Hispanic Black or African American, while 17% of renters are Black.
Region
The largest share of renters live in the South (39%), followed by the West (25%) and Midwest (21%). The smallest share lives in the Northeast (15%).
Gender Identity & Sexual Orientation
About one in ten (11%) recent renters identified as LGBTQ+ in 2019, the first year CHTR asked about sexual orientation and gender identity, then 16% in 2020. The share that identified as LGBTQ+ peaked in 2021 at 22%. In 2022, 18% of recent renters identified as LGBTQ+.[2] Recent renters are more likely to identify as LGBTQ+ (18%) than tenured renters (12%) or renters as a whole (13%). Younger renters are more likely to self-identify as LGBTQ+: The median age of an LGBTQ+ renter is 29 – versus 41 for cisgender heterosexual renters. Renters trending younger than the US adult population as a whole may help explain why renters are also more likely to identify as LGBTQ+.
Income
Renters tend to have lower incomes than the U.S. population overall. The annual median household income among renters is approximately $42,500, compared to the overall national median of $67,500.[4]
Education
Renters tend to have a similar level of education to the overall population of U.S. household decision makers: 36% of renters have at least a four-year degree, similar to 34% of overall U.S. household decision makers.
Relationship Status
Skewing younger than the U.S. population as a whole, renters are less likely to be married, divorced, separated or widowed. A majority (51%) are single and never married. These differences in relationship status may provide a partial explanation for the lower household income of renters compared with the overall population.
29% of renters have children under age 18 in their homes
2% of renters have their parents or parents-in-law in their homes
38% have at least one dog
29% have at least one cat
13% have another kind of pet
Urbanicity
Almost half of renters describe the area that they live in as suburban (45%); 41% say they live in an urban area, and the remaining 14% say they live in a rural area.
Home Type, Beds, Baths, and Size
Apartments of various sizes are what most renters call home: 53% of renters report living in an apartment building. About one in five renters (17%) say they rent in a smaller-size apartment building (fewer than 10 units). The same share (17%) said they live in a medium-size building (10-49 units), and 19% said they live in a larger multifamily building (50 units or more). About 21% live in a single-family detached house.
Home Type
Share of Renters
Apartment in a smaller size building (fewer than 10 units)
17%
Apartment in a medium size building (10-49 units)
17%
Apartment in a larger size building (50 units or more)
19%
Condominium / co-op
4%
Single-family detached house
21%
Townhouse / rowhouse
8%
Duplex / triplex
5%
Room in shared housing
3%
Income restricted rental home / community
2%
Other
4%
The typical (median) renter lives in a 2-bed, 2-bath, apartment between 500 and 999 square feet.
Most Recent Movers Changed Neighborhoods, but Stayed Local
When asked how far they moved, the largest share of recent renters said they stayed in the same city, but changed neighborhoods (40%). About one in ten (11%) reported staying in the same neighborhood. The smallest share (3%) moved from abroad.
Distance Moved
2019
2020
2021
2022
Same neighborhood
16%
14%
11%
11%
Same city, different neighborhood
38%
40%
39%
40%
Same metro, different city
19%
19%
19%
19%
Same state, different metro
13%
12%
16%
15%
Same country, different state
13%
13%
13%
13%
Moved from abroad
2%
2%
2%
3%
That is, about 70% of recent renters stayed within the same metro area. Over time, this number has largely stayed stable (72% in 2019, 73% in 2020, 68% in 2021).
Upfront Costs
Applications & Application Fees
The typical (median) renter submitted two applications — one online and one on paper/in person. For these rental applicants, the typical application fee was between $40 and $59. The typical number of applications and amount in fees that renters reported has not changed significantly between 2022 and 2018.
Paying a rental application fee was the norm across generations. However, younger renters were more likely to submit at least one application than their older counterparts. While most Gen Z (83%), Millennial (74%) and Gen X (79%) renters paid at least one application fee, less than half (42%) of Boomer & Silent Generation renters paid one.
The 2021 Consumer Housing Trends Report hypothesized that older renters were more likely to have personal connections to their landlords – helping to explain the lower likelihood of paying an application fee. We added questions to this year's survey to examine this possibility. Findings from this new content (in 2022) paint a more complex portrait: Across age groups, renters reported knowing their landlord or property manager personally at similar rates.
Age Group
Share that Paid An Application Fee
Share that Paid An Application Fee of At Least $40
Ages 18-29
70%
28%
Ages 30-39
64%
26%
Ages 40-49
59%
23%
Ages 50-59
50%
19%
Ages 60+
41%
18%
Generation
Share that Paid an Application Fee
Share that Paid An Application Fee of At Least $40
Gen Z (Ages 18-27)
71%
29%
Millennial (Ages 27-41)
65%
26%
Gen X (Ages 42-56)
56%
21%
Baby Boomers & Silent Generation (Ages 57+)
42%
18%
Across racial groups, paying an application fee is more common than not, but renters of color are more likely to report paying one: Larger shares of Black (69%), Latinx (65%), and Asian American/Pacific Islander (60%) renters reported paying an application fee than white renters (53%). Black and Latinx renters were also almost twice as likely to report submitting 5 applications or more (38% of Black and Latinx renters report submitting 5 or more, compared to 21% of white renters). Renters of color report paying a higher median application fee than white renters: The typical white renter reported paying $35 in application fees on their rental, while the typical Black, Latinx, and Asian renters all reported spending $50 on application fees. [4]
Race/Ethnicity
Share that Paid an Application Fee
Share that Paid At Least $40
Share that Paid At Least $100
Share that Submitted 2 Applications or more
Total Renters
59%
23%
9%
57%
White, non-Hispanic
53%
20%
8%
52%
Black, non-Hispanic
69%
25%
10%
73%
Latinx
65%
31%
12%
66%
AAPI, non-Hispanic
60%
28%
9%
60%
LGBTQ+ renters were more likely to report paying an application fee: 66% of LGBTQ+ renters said they paid one – higher than 57% of cisgender heterosexual renters. LGBTQ+ renters are also more likely to submit a greater number of applications: 68% submit two or more – compared to 57% for cisgender heterosexual renters. And 19% submit 5 or more – just above 15% for cisgender heterosexual renters.
Share of Renters that Submitted Each Number of Applications
Total Renters
LGBTQ+
Cisgender Heterosexual
0
12%
9%
12%
1
29%
22%
30%
2 or more
59%
68%
57%
5 or more
16%
19%
15%
LGBTQ+ renters are about 28% more likely to report recently moving than cisgender heterosexual renters. This higher move likelihood means that LGBTQ+ renters disproportionately feel the effect of upfront costs of moving, and may experience them more often.
Renters in large multifamily buildings (those with 50 units or more) were most likely to report submitting at least one application: 96% do, compared with 81% of those in single-family detached houses and 89% of those renting other home types.
Type of Home Rented
Share that Submitted At Least 1 Application
Share that Paid an Application Fee
Median Application Fee
Median Application Fee Among Renters Who Paid One
Total Renters
88%
59%
$20 – $39
$40 – $59
Multifamily (50+ units)
96%
72%
$40 – $59
$40 – $59
Single-family detached
81%
47%
$0
$40 – $59
Other
89%
62%
$20 – $39
$40 – $59
Security Deposits
For renters that pay one, the typical security deposit reported in 2022 was $500 – $999.
The oldest generations of renters are the most likely to avoid paying a deposit at all: 81% report paying a security deposit — lower than 87% of Gen Z, 86% of Millennial, and 85% of Gen X renters.
Generation
Share that Paid a Security Deposit
Total Renters
85%
Gen Z (Ages 18-27)
87%
Millennial (Ages 27-41)
86%
Gen X (Ages 42-56)
85%
Baby Boomers & Silent Generation (Ages 57+)
79%
Age Group
Share that Paid a Security Deposit
Total Renters
85%
Ages 18-29
87%
Ages 30-39
86%
Ages 40-49
88%
Ages 50-59
82%
Ages 60+
80%
Renters of color are more likely to report paying a security deposit: 86% do, compared to 84% of white renters. Latinx and Asian American/Pacific Islander renters are more likely to pay a more expensive deposit: 39% of Latinx and 43% of AAPI renters paid at least $500 for their deposit, and 22% of Latinx and 30% of AAPI renters paid at least $1,000.
Race/ Ethnicity
Share that Paid a Security Deposit
Deposit of At Least $500
Deposit of At Least $1,000
Total Renters
88%
33%
18%
White
85%
32%
17%
Black
93%
28%
13%
Latinx
91%
39%
22%
AAPI
92%
43%
30%
Regardless of the type of home rented, paying a deposit is the norm: 85% of renters reported paying one. Renters in single-family detached houses, though, can be slightly more likely to dodge paying a deposit: 21% of single-family renters reported paying no security deposit – higher than 11% of multifamily renters and 13% of renters in other home types. When they don't avoid paying one, single-family deposit amounts are typically higher: The typical security deposit among single-family renters that pay one was $1,000 – $1,499 – higher than the median of $500 – $999 for renters in multifamily and other types of buildings. A lower likelihood of paying an application fee (which often includes a credit check) combined with the fact that single-family renters are more likely to rent from a private owner (who may be less able to offset risk from a single tenant than a professional management company) likely contribute to this difference.
Type of Home Rented
Share that Paid a Security Deposit
Median Security Deposit
Median Security Deposit Among Renters Who Paid One
Share that Paid At Least $500
Share that Paid At Least $1,000
Total Renters
85%
$500 – $999
$500 – $999
33%
18%
Multifamily (50+ units)
89%
$250 – $499
$500 – $999
26%
15%
Single-family detached
79%
$500 – $999
$1,000 – $1,499
41%
24%
Other
87%
$500 – $999
$500 – $999
31%
17%
Type of Home Rented
Share that rent from a private owner (rather than a professional management company)
Share that knew their landlord/property manager personally
Total Renters
51%
20%
Multifamily (50+ units)
15%
11%
Single-family detached
77%
27%
Other
46%
19%
Resources Renters Use When Shopping & Searching
More Recent Renters Searching on Mobile Devices
The share of recent renters that say they searched on a mobile website held onto its increase from 2021: (74% in 2022 and 2021, up from 65% in 2020) and/or on a mobile app (60% in 2022 and 2021, up from 51% in 2020).
Online resources used when searching
2019
2020
2021
2022
Website on a laptop / desktop computer
70%
72%
73%
67%
Mobile website on a smartphone / tablet
64%
65%
74%
74%
App on a smartphone / tablet
46%
51%
60%
60%
Home Characteristics that Renters Consider Highly Important
Importance of Staying on Budget Persists
When asked what home characteristics they are most likely to consider very or extremely important, renters have consistently said that staying within their initial budget is highly important. The largest majority (80%) said so, higher than any other home characteristic.
Preferred number of bedrooms was the runner-up, at a distant 68%. Despite the rise of remote work with the COVID-19 pandemic, the importance of renters' preferred number of bedrooms has held steady over the last few years.
No "Post-Pandemic" Rebound for Importance of Common Amenities
Between 2018 and 2020, the share of recent renters that considered various shared community amenities like gyms, decks, gardens, and game rooms highly important inched upward. In 2021's survey, however, this trend appears to have ground to a halt or even reversed. And in 2022, despite many of these amenities reopening, recent renters were similarly or less likely to consider each highly important.
The likelihood that recent renters consider each common amenity highly important dropped in 2022 from peaks in 2020: a shared fitness center or gym dropped from 23% in 2020 to 15% in 2022; a community recreation space dropped from 18% to 12%; rooftop deck or garden fell from 18% to 15%, and other shared amenities fell from 20% to 15%.
Pandemic Coincided with an Increase in the Share of Renters Considering Buying
Most Considered Buying During their Rental Search
A majority of recent renters said in 2022 that they considered buying when they were looking for a home to rent: 66% said they at least thought about it, up from 56% in 2021, 55% in 2020, 49% in 2019, and 46% in 2018.
Millennial renters were the most likely to say they considered buying: 70% said so, significantly higher than the oldest generations of renters — closer to half of Baby Boomer and Silent Generation renters (47%) said they at least thought about buying.
Considered Buying
Total Renters
Gen Z
(Ages 18-27)
Millennial
(Ages 28-42)
Generation X
(Ages 43-57)
Boomers + Silent Gen
(Ages 57+)
Never considered buying
37%
34%
30%
41%
53%
Seriously considered buying instead
23%
23%
27%
24%
10%
Thought about buying, more serious about renting
41%
43%
43%
36%
36%
NET: Considered buying
1%
66%
70%
59%
47%
Almost Three Quarters of Recent Renters Consider Moving Again Within the Next 3 Years
Similar both before and after the pandemic, recent renters consistently consider moving: 73% say they are considering it within the next 3 years. About a quarter (23%) say they are currently considering moving, and almost one in three (31%) say they're considering moving in the next year. Another fifth (19%) say they're considering it within the next two to three years. About one in ten (12%) say they might consider moving, but not within the next 3 years. And the remaining 15% say they have no plans to move.
Moving Consideration
2018
2019
2020
2021
2022
No plans to move
20%
20%
19%
17%
15%
Might consider moving, but not within next 3 years
12%
14%
12%
14%
12%
Considering moving in the next 2-3 years
22%
20%
23%
24%
19%
Considering moving in the next year
22%
23%
26%
21%
31%
Currently considering moving
24%
24%
20%
24%
19%
The Share Considering Moving Remained Stable, But Plans to Buy Stayed Up
In 2018 and 2019, 34% of recent renters considering moving within the next year said they planned to buy their next home. In 2020, the share increased slightly to 39%, and in 2021, the same share (39%) said they planned to buy. In 2022, recent renters appeared more likely to report plans to buy their next home: 44% said home buying was their next plan.
Demand for Digital Tools Stable, Up in Some Cases
A Quarter of Recent Renters Took Zero In-Person Tours
The typical recent renter surveyed in 2022 reported taking only one in-person tour. Going on at least two in-person tours is still quite common, however: 40% of recent renters reported taking at least two. 2022 continues the trend from last year: About one in four (23%) recent renters said they forewent in-person tours entirely.
Share of Recent Renters that Reported Taking
2018
2019
2020
2021
2022
0 In-Person Tours
21%
19%
18%
23%
23%
1-4 In-Person Tours
62%
63%
67%
68%
71%
5 or More In-Person Tours
16%
17%
15%
10%
6%
Rise in Electronic Lease Signing Holds
While the share of recent renters that signed their lease electronically stayed largely unchanged between 2018 and 2019 (21% and 23% respectively), 2020 saw a substantial increase to 30%, and the trend continued in the 2021 survey, where 35% of recent renters reported signing their leases electronically. In 2022, 36% of recent renters reported signing electronically – similar to 2021. In-person leases are still the norm for a majority of renters (55%), but have been on a downward trend since last year.
While the share of recent renters that actually signed electronically remained similar to 2021, the share that would ideally prefer to sign electronically increased _ points to 53%. Despite landlords and property managers stepping up their offering of electronic leasing options, the gap between the share of recent renters that signed online (36%) and would ideally prefer to sign online (53%) widened in 2022.
Half of Renters Pay Rent Online – More Would Like To
In fall of 2020, half (50%) of recent renters said they typically pay their rent online. Since then, the share has risen a slight 6 points to 56%. Over the same time, the share of recent renters that said they would ideally prefer to pay their rent online remained similar: 69% in fall 2020 and 68% in spring/summer of 2022.
Gap Between Share of Renters that Typically and Would Ideally Pay Rent Online
Spring 2018
Spring 2019
Spring 2020
Fall 2020
Spring & Summer 2021
Spring & Summer 2022
21%
20%
17%
19%
13%
12%
Half of Renters Get At Least One Perk or Concession
Among recent renters that recalled which concessions they received, 54% said they got at least one – similar to 55% in 2020. The most common perk that renters reported getting was parking — about a quarter (24%) said parking was included in their rental agreement. Frequency of most individual concessions stayed similar to 2021.
Among recent renters that remember whether they got any concessions
2020
2021
2022
First month rent free
13%
15%
12%
More than first month rent free
7%
5%
5%
Reduced rent
12%
13%
12%
Parking
19%
25%
24%
Reduced security deposit
11%
10%
8%
Free/discounted access to paid property amenities (laundry, internet, etc…)
10%
12%
11%
Broker’s fee paid
5%
4%
3%
Gift card
6%
5%
5%
Something else
6%
6%
4%
I didn’t receive any concessions
45%
41%
46%
Net: Received Concession
55%
59%
54%
Concessions Appear to Have Peaked in February
According to an analysis of Zillow rental listings, the share of listings that advertised at least one concession peaked in February 2021 (36% mentioned one). By June 2022, that number had dropped to 20%.
Perks & Concessions More Common for Young and Multifamily Renters
The youngest generation of renters (those age 27 and younger) were the most likely to secure at least one perk or concession in their rental agreement: 67% reported doing so, higher than 51% of those between 28 and 42 years old, and even higher than older generations.
Among renters that remember whether they got any concessions
Gen Z (Ages 18-27)
Millennial (Ages 28-42)
Generation X (Ages 43-57)
Boomers + Silent Gen (58+)
Share that got at least 1 perk/concession
67%
51%
37%
36%
Renters in large multifamily buildings were also more likely to report getting a concession: 58% said they did, compared to 36% of renters in single-detached houses. Renters in other home types were the middle ground: 52% reported getting at least one concession.
Among renters that remember whether they got any concessions
Single-Family Detached House
Multifamily Apartment Building
Other
Share that got at least 1 perk/concession
36%
58%
52%
Renters in each of these groups associated with a higher likelihood of reporting a concession may not actually be more likely to receive each perk, like parking, but rather more likely to consider such a perk as something they cannot take for granted: Renters in single-detached houses, for example, may consider parking as a given, which may explain why 87% didn't report receiving it as a concession or perk.
12 Months Is the Most Common Lease Duration
A Quarter of Renters are Month-to-Month
About a quarter (24%) of renters say that their lease allows them to leave with no more than a month of notice. For recent renters, the share is smaller: 15% of those that moved in the past year say their lease allows them to leave with no more than a month of notice.
12 Months Is the Norm for 2/3rds of Fixed-Term Renters
Among renters on a fixed-term lease, two-thirds (67%) say they signed on for a 12-month duration. About one in five (19%) say their lease is longer than a year. One in ten (10%) say their lease is 2 years or longer, and one in seven (14%) say their lease is shorter than 12 months.
[1]Renters were asked about their home's square footage in ranges. According to the 2019 American Housing Survey, the median was 980 square feet. [2] LGBTQ+ renters are those who identified as gay, lesbian, bisexual, transgender, gender non-conforming/non-binary, intersex, or with another sexual orientation (other than straight) or gender identity (e.g. gender fluid, gender queer, gender neutral). [3] These estimates come from CHTR 2021 and the 2019 American Community Survey. [4] These higher fees and number of applications that renters of color disproportionately experience may at least be partially attributable to age, income, and geography: The typical renter of color is 2 years younger than the median white renter. White renters are more likely to rent in rural markets and the Midwest, both of which generally skew less expensive, while renters of color are more likely to rent in urban markets. Asian and Latinx renters in particular are more likely to rent in the West, which includes many of the country's most expensive and competitive rental markets. Exploratory analyses of the data suggest that differences in region, urbanicity, age structure, and income explain about 10-20% of Latinx-white differences. Models, however, are underpowered for a more detailed accounting of sources of racial/ethnic differences.
"I Can't Even Save": Americans Are Getting Absolutely Crushed Under Enormous Debt Load
While Joe Biden insists that Americans are doing great - suggesting in his State of the Union Address last week that "our economy is the envy of the world," Americans are being absolutely crushed by inflation (which the Biden admin blames on 'shrinkflation' and 'corporate greed'), andof course - crippling debt.
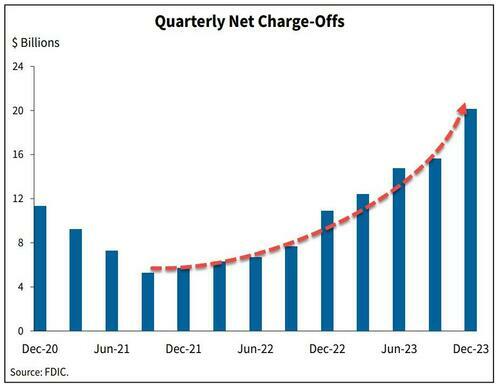
The signs are obvious. Last week we noted that banks' charge-offs are accelerating, and are now above pre-pandemic levels.
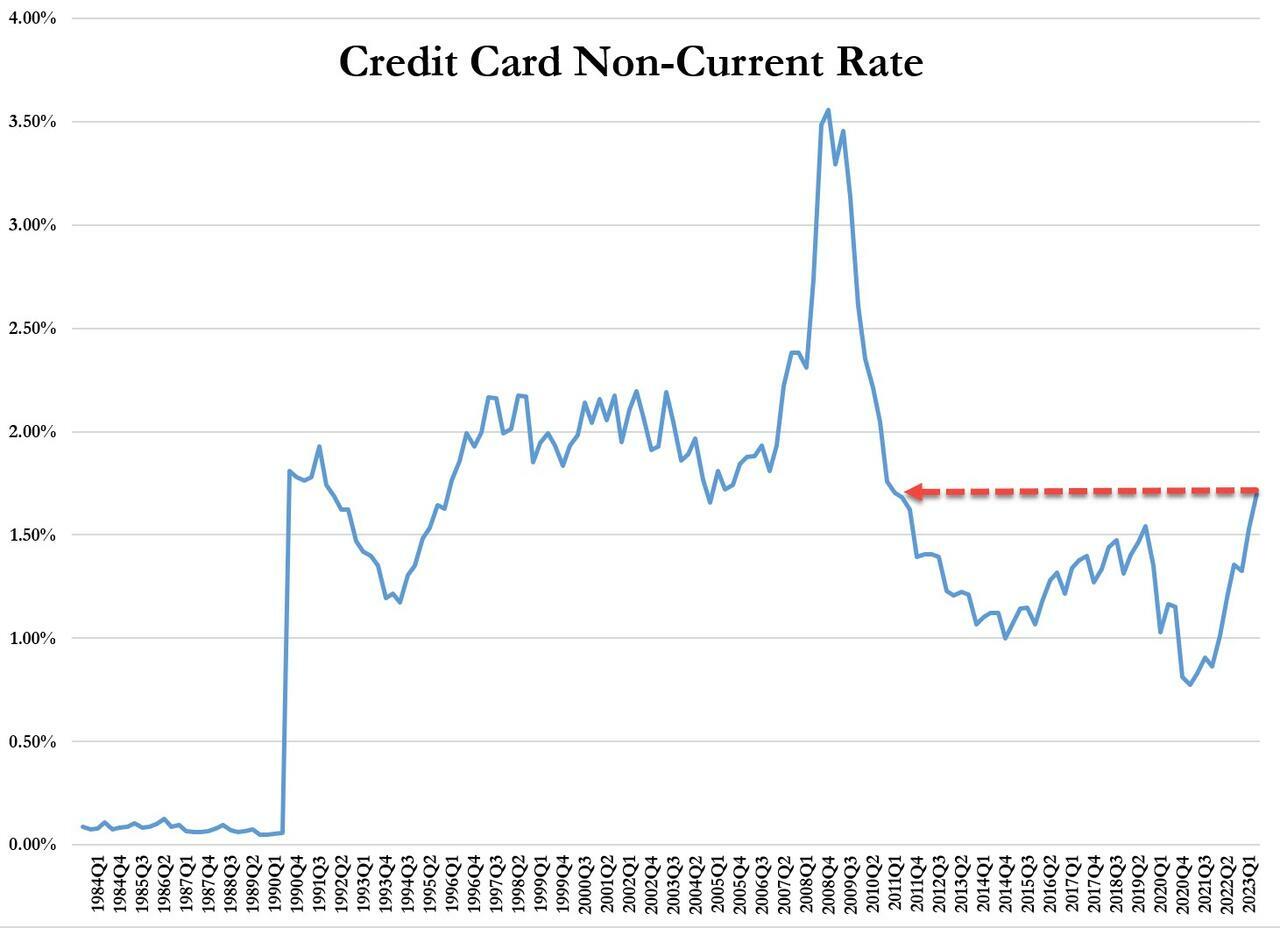
...and leading this increase are credit card loans - with delinquencies that haven't been this high since Q3 2011.
On top of that, while credit cards and nonfarm, nonresidential commercial real estate loans drove the quarterly increase in the noncurrent rate, residential mortgages drove the quarterly increase in the share of loans 30-89 days past due.
And while Biden and crew can spin all they want, an average of polls from RealClear Politics shows that just 40% of people approve of Biden's handling of the economy.
Crushed
On Friday, Bloomberg dug deeper into the effects of Biden's "envious" economy on Americans - specifically, how massive debt loads (credit cards and auto loans especially) are absolutely crushing people.
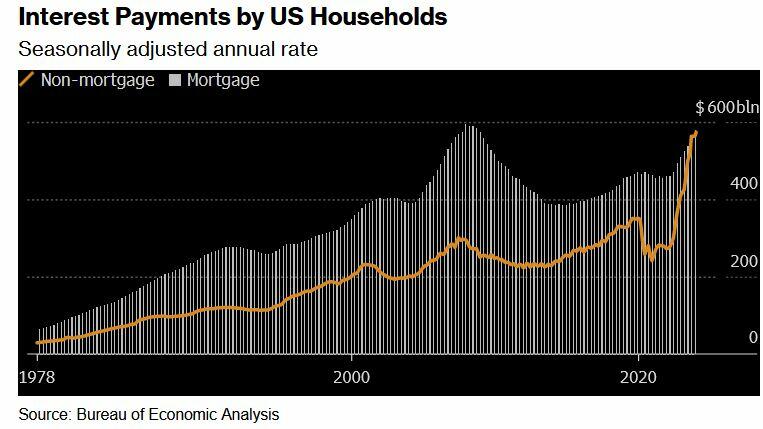
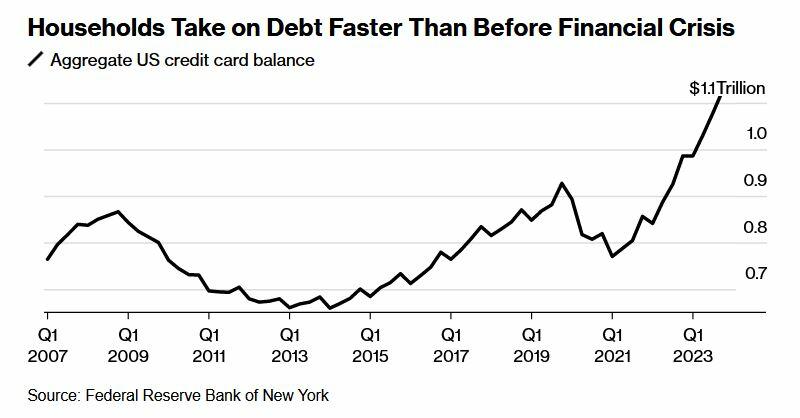
Two years after the Federal Reserve began hiking interest rates to tame prices, delinquency rates on credit cards and auto loans are the highest in more than a decade. For the first time on record, interest payments on those and other non-mortgage debts are as big a financial burden for US households as mortgage interest payments.
According to the report, this presents a difficult reality for millions of consumers who drive the US economy - "The era of high borrowing costs — however necessary to slow price increases — has a sting of its own that many families may feel for years to come, especially the ones that haven’t locked in cheap home loans."
The Fed, meanwhile, doesn't appear poised to cut rates until later this year.
According to a February paper from IMF and Harvard, the recent high cost of borrowing - something which isn't reflected in inflation figures, is at the heart of lackluster consumer sentiment despite inflation having moderated and a job market which has recovered (thanks to job gains almost entirely enjoyed by immigrants).
In short, the debt burden has made life under President Biden a constant struggle throughout America.
"I’m making the most money I've ever made, and I’m still living paycheck to paycheck," 40-year-old Denver resident Nikki Cimino told Bloomberg. Cimino is carrying a monthly mortgage of $1,650, and has $4,000 in credit card debt following a 2020 divorce.
"There's this wild disconnect between what people are experiencing and what economists are experiencing."
CBS: Do you attribute the inflation crisis to the pandemic or Biden?
WISCONSIN VOTER: "It's been YEARS now since the pandemic — I'm not buying that anymore. At first I did; I'm not buying that anymore because yogurt is STILL going up in price!" pic.twitter.com/apahb65scB
What's more, according to Wells Fargo, families have taken on debt at a comparatively fast rate - no doubt to sustain the same lifestyle as low rates and pandemic-era stimmies provided. In fact, it only took four years for households to set a record new debt level after paying down borrowings in 2021 when interest rates were near zero.
Meanwhile, that increased debt load is exacerbated by credit card interest rates that have climbed to a record 22%, according to the Fed.
[P]art of the reason some Americans were able to take on a substantial load of non-mortgage debt is because they’d locked in home loans at ultra-low rates, leaving room on their balance sheets for other types of borrowing. The effective rate of interest on US mortgage debt was just 3.8% at the end of last year.
Yet the loans and interest payments can be a significant strain that shapes families’ spending choices. -Bloomberg
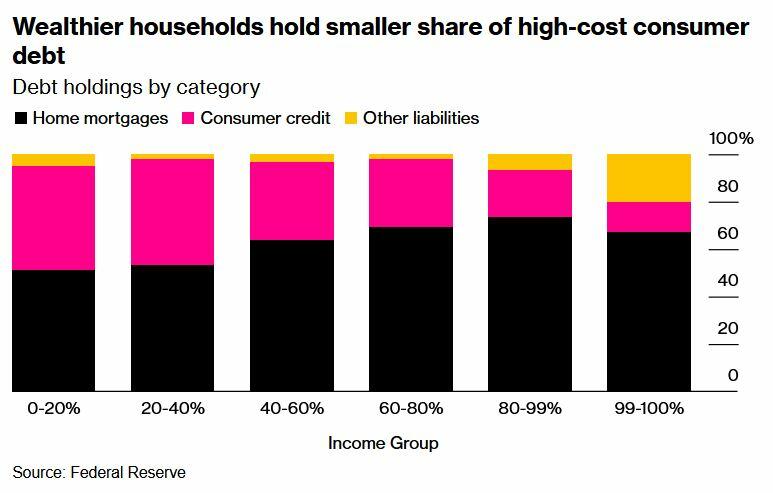
And of course, the highest-interest debt (credit cards) is hurting lower-income households the most, as tends to be the case.
The lowest earners also understandably had the biggest increase in credit card delinquencies.
"Many consumers are levered to the hilt — maxed out on debt and barely keeping their heads above water," Allan Schweitzer, a portfolio manager at credit-focused investment firm Beach Point Capital Management told Bloomberg. "They can dog paddle, if you will, but any uptick in unemployment or worsening of the economy could drive a pretty significant spike in defaults."
"We had more money when Trump was president," said Denise Nierzwicki, 69. She and her 72-year-old husband Paul have around $20,000 in debt spread across multiple cards - all of which have interest rates above 20%.
During the pandemic, Denise lost her job and a business deal for a bar they owned in their hometown of Lexington, Kentucky. While they applied for Social Security to ease the pain, Denise is now working 50 hours a week at a restaurant. Despite this, they're barely scraping enough money together to service their debt.
The couple blames Biden for what they see as a gloomy economy and plans to vote for the Republican candidate in November. Denise routinely voted for Democrats up until about 2010, when she grew dissatisfied with Barack Obama’s economic stances, she said. Now, she supports Donald Trump because he lowered taxes and because of his policies on immigration. -Bloomberg
Meanwhile there's student loans - which are not able to be discharged in bankruptcy.
"I can't even save, I don't have a savings account," said 29-year-old in Columbus, Ohio resident Brittany Walling - who has around $80,000 in federal student loans, $20,000 in private debt from her undergraduate and graduate degrees, and $6,000 in credit card debt she accumulated over a six-month stretch in 2022 while she was unemployed.
"I just know that a lot of people are struggling, and things need to change," she told the outlet.
The only silver lining of note, according to Bloomberg, is that broad wage gains resulting in large paychecks has made it easier for people to throw money at credit card bills.
Yet, according to Wells Fargo economist Shannon Grein, "As rates rose in 2023, we avoided a slowdown due to spending that was very much tied to easy access to credit ... Now, credit has become harder to come by and more expensive."
According to Grein, the change has posed "a significant headwind to consumption."
Then there's the election
"Maybe the Fed is done hiking, but as long as rates stay on hold, you still have a passive tightening effect flowing down to the consumer and being exerted on the economy," she continued. "Those household dynamics are going to be a factor in the election this year."
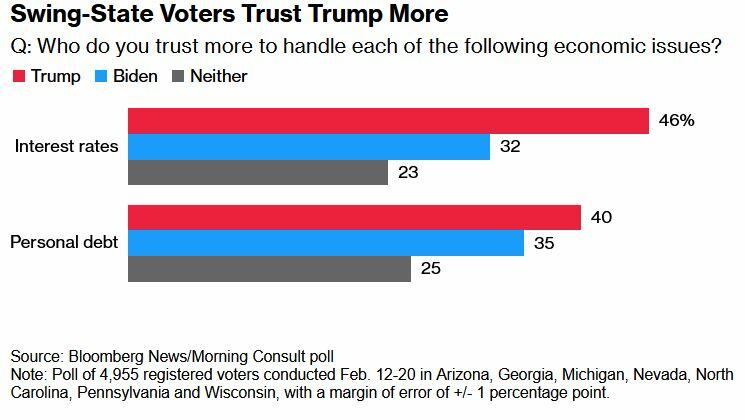
Meanwhile, swing-state voters in a February Bloomberg/Morning Consult poll said they trust Trump more than Biden on interest rates and personal debt.
Reverberations
These 'headwinds' have M3 Partners' Moshin Meghji concerned.
"Any tightening there immediately hits the top line of companies," he said, noting that for heavily indebted companies that took on debt during years of easy borrowing, "there's no easy fix."
Sylvester researchers, collaborators call for greater investment in bereavement care
MIAMI, FLORIDA (March 15, 2024) – The public health toll from bereavement is well-documented in the medical literature, with bereaved persons at greater…
MIAMI, FLORIDA (March 15, 2024) – The public health toll from bereavement is well-documented in the medical literature, with bereaved persons at greater risk for many adverse outcomes, including mental health challenges, decreased quality of life, health care neglect, cancer, heart disease, suicide, and death. Now, in a paper published in The Lancet Public Health, researchers sound a clarion call for greater investment, at both the community and institutional level, in establishing support for grief-related suffering.
Credit: Photo courtesy of Memorial Sloan Kettering Comprehensive Cancer Center
MIAMI, FLORIDA (March 15, 2024) – The public health toll from bereavement is well-documented in the medical literature, with bereaved persons at greater risk for many adverse outcomes, including mental health challenges, decreased quality of life, health care neglect, cancer, heart disease, suicide, and death. Now, in a paper published in The Lancet Public Health, researchers sound a clarion call for greater investment, at both the community and institutional level, in establishing support for grief-related suffering.
The authors emphasized that increased mortality worldwide caused by the COVID-19 pandemic, suicide, drug overdose, homicide, armed conflict, and terrorism have accelerated the urgency for national- and global-level frameworks to strengthen the provision of sustainable and accessible bereavement care. Unfortunately, current national and global investment in bereavement support services is woefully inadequate to address this growing public health crisis, said researchers with Sylvester Comprehensive Cancer Center at the University of Miami Miller School of Medicine and collaborating organizations.
They proposed a model for transitional care that involves firmly establishing bereavement support services within healthcare organizations to ensure continuity of family-centered care while bolstering community-based support through development of “compassionate communities” and a grief-informed workforce. The model highlights the responsibility of the health system to build bridges to the community that can help grievers feel held as they transition.
The Center for the Advancement of Bereavement Care at Sylvester is advocating for precisely this model of transitional care. Wendy G. Lichtenthal, PhD, FT, FAPOS, who is Founding Director of the new Center and associate professor of public health sciences at the Miller School, noted, “We need a paradigm shift in how healthcare professionals, institutions, and systems view bereavement care. Sylvester is leading the way by investing in the establishment of this Center, which is the first to focus on bringing the transitional bereavement care model to life.”
What further distinguishes the Center is its roots in bereavement science, advancing care approaches that are both grounded in research and community-engaged.
The authors focused on palliative care, which strives to provide a holistic approach to minimize suffering for seriously ill patients and their families, as one area where improvements are critically needed. They referenced groundbreaking reports of the Lancet Commissions on the value of global access to palliative care and pain relief that highlighted the “undeniable need for improved bereavement care delivery infrastructure.” One of those reports acknowledged that bereavement has been overlooked and called for reprioritizing social determinants of death, dying, and grief.
“Palliative care should culminate with bereavement care, both in theory and in practice,” explained Lichtenthal, who is the article’s corresponding author. “Yet, bereavement care often is under-resourced and beset with access inequities.”
Transitional bereavement care model
So, how do health systems and communities prioritize bereavement services to ensure that no bereaved individual goes without needed support? The transitional bereavement care model offers a roadmap.
“We must reposition bereavement care from an afterthought to a public health priority. Transitional bereavement care is necessary to bridge the gap in offerings between healthcare organizations and community-based bereavement services,” Lichtenthal said. “Our model calls for health systems to shore up the quality and availability of their offerings, but also recognizes that resources for bereavement care within a given healthcare institution are finite, emphasizing the need to help build communities’ capacity to support grievers.”
Key to the model, she added, is the bolstering of community-based support through development of “compassionate communities” and “upskilling” of professional services to assist those with more substantial bereavement-support needs.
The model contains these pillars:
Preventive bereavement care –healthcare teams engage in bereavement-conscious practices, and compassionate communities are mindful of the emotional and practical needs of dying patients’ families.
Ownership of bereavement care – institutions provide bereavement education for staff, risk screenings for families, outreach and counseling or grief support. Communities establish bereavement centers and “champions” to provide bereavement care at workplaces, schools, places of worship or care facilities.
Resource allocation for bereavement care – dedicated personnel offer universal outreach, and bereaved stakeholders provide input to identify community barriers and needed resources.
Upskilling of support providers – Bereavement education is integrated into training programs for health professionals, and institutions offer dedicated grief specialists. Communities have trained, accessible bereavement specialists who provide support and are educated in how to best support bereaved individuals, increasing their grief literacy.
Evidence-based care – bereavement care is evidence-based and features effective grief assessments, interventions, and training programs. Compassionate communities remain mindful of bereavement care needs.
Lichtenthal said the new Center will strive to materialize these pillars and aims to serve as a global model for other health organizations. She hopes the paper’s recommendations “will cultivate a bereavement-conscious and grief-informed workforce as well as grief-literate, compassionate communities and health systems that prioritize bereavement as a vital part of ethical healthcare.”
“This paper is calling for healthcare institutions to respond to their duty to care for the family beyond patients’ deaths. By investing in the creation of the Center for the Advancement of Bereavement Care, Sylvester is answering this call,” Lichtenthal said.
Follow @SylvesterCancer on X for the latest news on Sylvester’s research and care.
# # #
Article Title: Investing in bereavement care as a public health priority
DOI: 10.1016/S2468-2667(24)00030-6
Authors: The complete list of authors is included in the paper.
Funding: The authors received funding from the National Cancer Institute (P30 CA240139 Nimer) and P30 CA008748 Vickers).
Disclosures: The authors declared no competing interests.
# # #
Journal
The Lancet Public Health
DOI
10.1016/S2468-2667(24)00030-6
Article Title
Investing in bereavement care as a public health priority
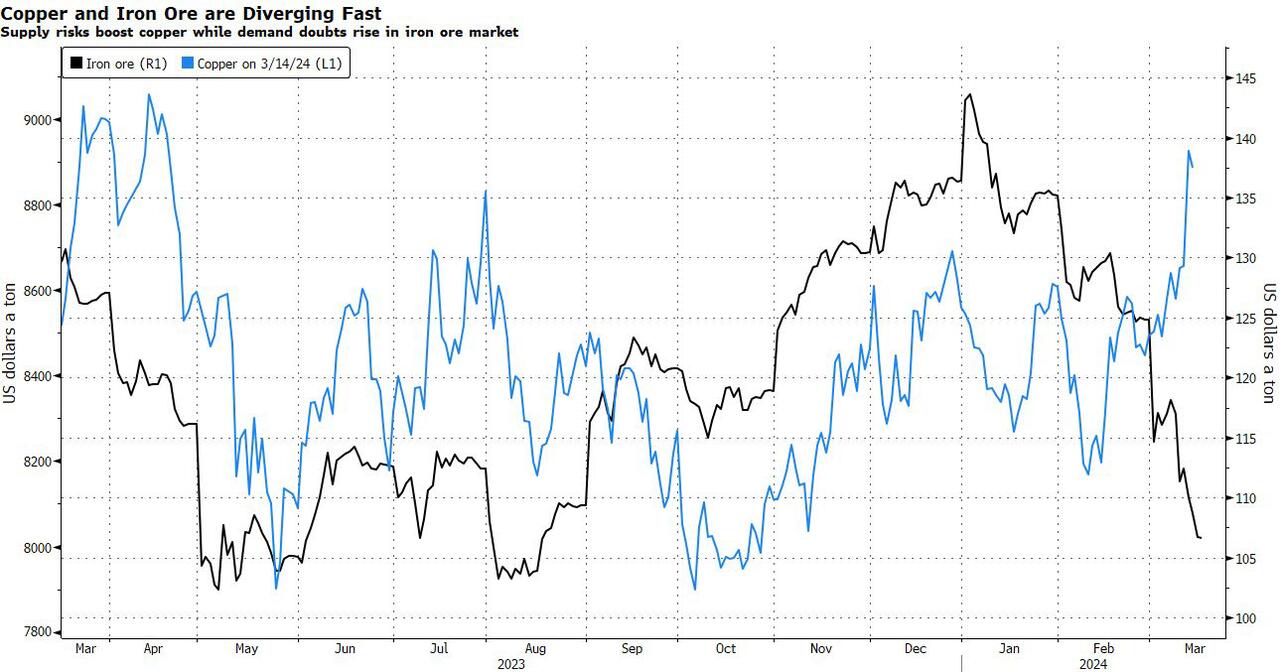
Copper Soars, Iron Ore Tumbles As Goldman Says "Copper's Time Is Now"
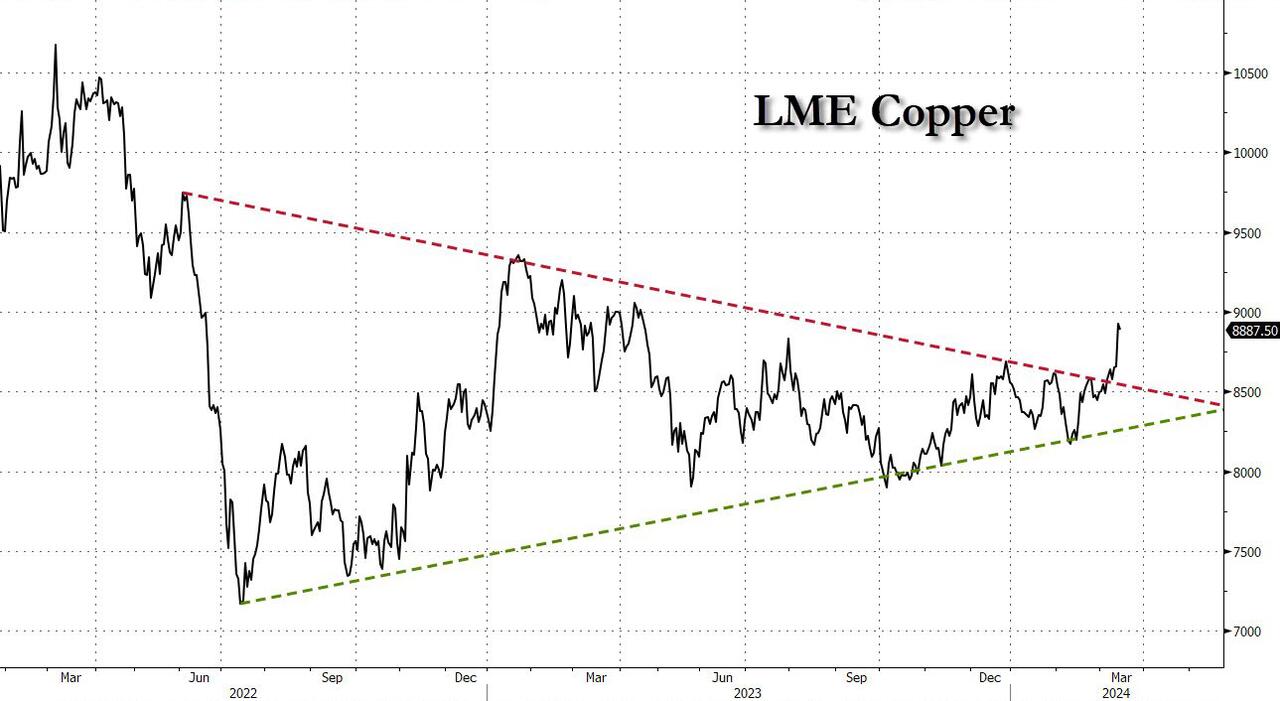
After languishing for the past two years in a tight range despite recurring speculation about declining global supply, copper has finally broken out, surging to the highest price in the past year, just shy of $9,000 a ton as supply cuts hit the market; At the same time the price of the world's "other" most important mined commodity has diverged, as iron ore has tumbled amid growing demand headwinds out of China's comatose housing sector where not even ghost cities are being built any more.
Copper surged almost 5% this week, ending a months-long spell of inertia, as investors focused on risks to supply at various global mines and smelters. As Bloomberg adds, traders also warmed to the idea that the worst of a global downturn is in the past, particularly for metals like copper that are increasingly used in electric vehicles and renewables.
Yet the commodity crash of recent years is hardly over, as signs of the headwinds in traditional industrial sectors are still all too obvious in the iron ore market, where futures fell below $100 a ton for the first time in seven months on Friday as investors bet that China’s years-long property crisis will run through 2024, keeping a lid on demand.
Indeed, while the mood surrounding copper has turned almost euphoric, sentiment on iron ore has soured since the conclusion of the latest National People’s Congress in Beijing, where the CCP set a 5% goal for economic growth, but offered few new measures that would boost infrastructure or other construction-intensive sectors.
As a result, the main steelmaking ingredient has shed more than 30% since early January as hopes of a meaningful revival in construction activity faded. Loss-making steel mills are buying less ore, and stockpiles are piling up at Chinese ports. The latest drop will embolden those who believe that the effects of President Xi Jinping’s property crackdown still have significant room to run, and that last year’s rally in iron ore may have been a false dawn.
Meanwhile, as Bloomberg notes, on Friday there were fresh signs that weakness in China’s industrial economy is hitting the copper market too, with stockpiles tracked by the Shanghai Futures Exchange surging to the highest level since the early days of the pandemic. The hope is that headwinds in traditional industrial areas will be offset by an ongoing surge in usage in electric vehicles and renewables.
And while industrial conditions in Europe and the US also look soft, there’s growing optimism about copper usage in India, where rising investment has helped fuel blowout growth rates of more than 8% — making it the fastest-growing major economy.
In any case, with the demand side of the equation still questionable, the main catalyst behind copper’s powerful rally is an unexpected tightening in global mine supplies, driven mainly by last year’s closure of a giant mine in Panama (discussed here), but there are also growing worries about output in Zambia, which is facing an El Niño-induced power crisis.
On Wednesday, copper prices jumped on huge volumes after smelters in China held a crisis meeting on how to cope with a sharp drop in processing fees following disruptions to supplies of mined ore. The group stopped short of coordinated production cuts, but pledged to re-arrange maintenance work, reduce runs and delay the startup of new projects. In the coming weeks investors will be watching Shanghai exchange inventories closely to gauge both the strength of demand and the extent of any capacity curtailments.
“The increase in SHFE stockpiles has been bigger than we’d anticipated, but we expect to see them coming down over the next few weeks,” Colin Hamilton, managing director for commodities research at BMO Capital Markets, said by phone. “If the pace of the inventory builds doesn’t start to slow, investors will start to question whether smelters are actually cutting and whether the impact of weak construction activity is starting to weigh more heavily on the market.”
* * *
Few have been as happy with the recent surge in copper prices as Goldman's commodity team, where copper has long been a preferred trade (even if it may have cost the former team head Jeff Currie his job due to his unbridled enthusiasm for copper in the past two years which saw many hedge fund clients suffer major losses).
As Goldman's Nicholas Snowdon writes in a note titled "Copper's time is now" (available to pro subscribers in the usual place)...
... there has been a "turn in the industrial cycle." Specifically according to the Goldman analyst, after a prolonged downturn, "incremental evidence now points to a bottoming out in the industrial cycle, with the global manufacturing PMI in expansion for the first time since September 2022." As a result, Goldman now expects copper to rise to $10,000/t by year-end and then $12,000/t by end of Q1-25.’
Here are the details:
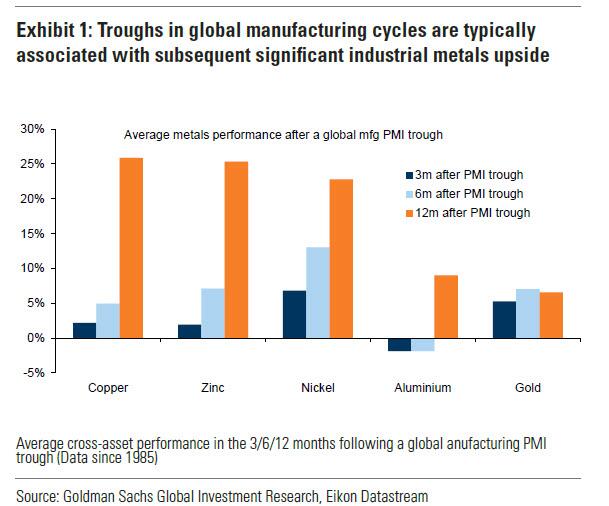
Previous inflexions in global manufacturing cycles have been associated with subsequent sustained industrial metals upside, with copper and aluminium rising on average 25% and 9% over the next 12 months. Whilst seasonal surpluses have so far limited a tightening alignment at a micro level, we expect deficit inflexions to play out from quarter end, particularly for metals with severe supply binds. Supplemented by the influence of anticipated Fed easing ahead in a non-recessionary growth setting, another historically positive performance factor for metals, this should support further upside ahead with copper the headline act in this regard.
Goldman then turns to what it calls China's "green policy put":
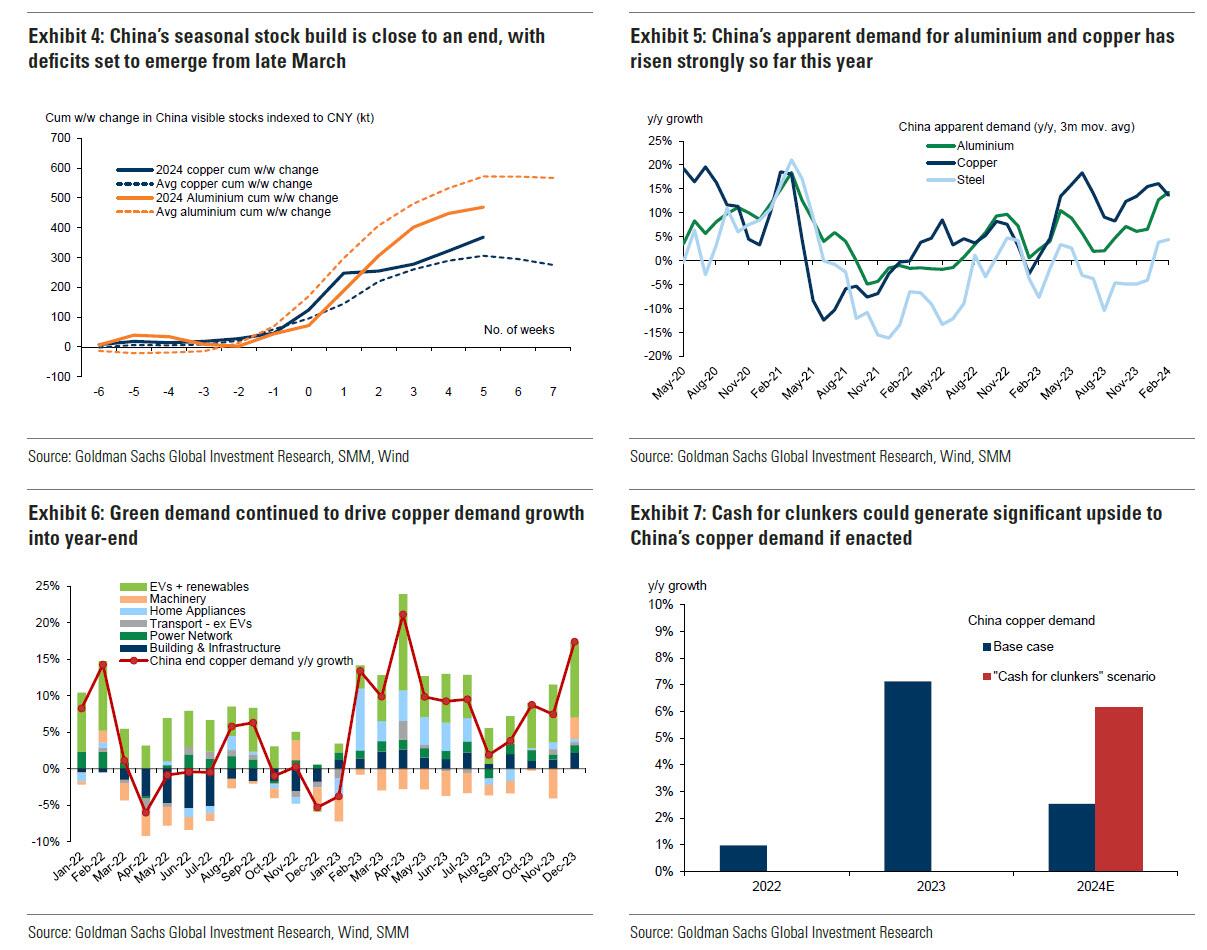
Much of the recent focus on the “Two Sessions” event centred on the lack of significant broad stimulus, and in particular the limited property support. In our view it would be wrong – just as in 2022 and 2023 – to assume that this will result in weak onshore metals demand. Beijing’s emphasis on rapid growth in the metals intensive green economy, as an offset to property declines, continues to act as a policy put for green metals demand. After last year’s strong trends, evidence year-to-date is again supportive with aluminium and copper apparent demand rising 17% and 12% y/y respectively. Moreover, the potential for a ‘cash for clunkers’ initiative could provide meaningful right tail risk to that healthy demand base case. Yet there are also clear metal losers in this divergent policy setting, with ongoing pressure on property related steel demand generating recent sharp iron ore downside.
Meanwhile, Snowdon believes that the driver behind Goldman's long-running bullish view on copper - a global supply shock - continues:
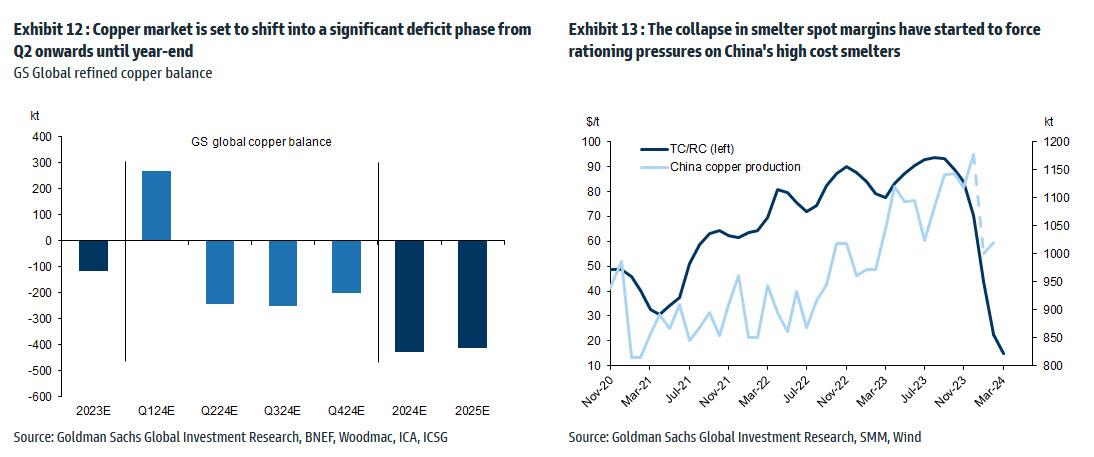
Copper’s supply shock progresses. The metal with most significant upside potential is copper, in our view. The supply shock which began with aggressive concentrate destocking and then sharp mine supply downgrades last year, has now advanced to an increasing bind on metal production, as reflected in this week's China smelter supply rationing signal. With continued positive momentum in China's copper demand, a healthy refined import trend should generate a substantial ex-China refined deficit this year. With LME stocks having halved from Q4 peak, China’s imminent seasonal demand inflection should accelerate a path into extreme tightness by H2. Structural supply underinvestment, best reflected in peak mine supply we expect next year, implies that demand destruction will need to be the persistent solver on scarcity, an effect requiring substantially higher pricing than current, in our view. In this context, we maintain our view that the copper price will surge into next year (GSe 2025 $15,000/t average), expecting copper to rise to $10,000/t by year-end and then $12,000/t by end of Q1-25’
Another reason why Goldman is doubling down on its bullish copper outlook: gold.
The sharp rally in gold price since the beginning of March has ended the period of consolidation that had been present since late December. Whilst the initial catalyst for the break higher came from a (gold) supportive turn in US data and real rates, the move has been significantly amplified by short term systematic buying, which suggests less sticky upside. In this context, we expect gold to consolidate for now, with our economists near term view on rates and the dollar suggesting limited near-term catalysts for further upside momentum. Yet, a substantive retracement lower will also likely be limited by resilience in physical buying channels. Nonetheless, in the midterm we continue to hold a constructive view on gold underpinned by persistent strength in EM demand as well as eventual Fed easing, which should crucially reactivate the largely for now dormant ETF buying channel. In this context, we increase our average gold price forecast for 2024 from $2,090/toz to $2,180/toz, targeting a move to $2,300/toz by year-end.
We use cookies on our website to give you the most relevant experience by remembering your preferences and repeat visits. By clicking “Accept”, you consent to the use of ALL the cookies.
This website uses cookies to improve your experience while you navigate through the website. Out of these, the cookies that are categorized as necessary are stored on your browser as they are essential for the working of basic functionalities of the website. We also use third-party cookies that help us analyze and understand how you use this website. These cookies will be stored in your browser only with your consent. You also have the option to opt-out of these cookies. But opting out of some of these cookies may affect your browsing experience.
Necessary cookies are absolutely essential for the website to function properly. These cookies ensure basic functionalities and security features of the website, anonymously.
Cookie
Duration
Description
cookielawinfo-checbox-analytics
11 months
This cookie is set by GDPR Cookie Consent plugin. The cookie is used to store the user consent for the cookies in the category "Analytics".
cookielawinfo-checbox-functional
11 months
The cookie is set by GDPR cookie consent to record the user consent for the cookies in the category "Functional".
cookielawinfo-checbox-others
11 months
This cookie is set by GDPR Cookie Consent plugin. The cookie is used to store the user consent for the cookies in the category "Other.
cookielawinfo-checkbox-necessary
11 months
This cookie is set by GDPR Cookie Consent plugin. The cookies is used to store the user consent for the cookies in the category "Necessary".
cookielawinfo-checkbox-performance
11 months
This cookie is set by GDPR Cookie Consent plugin. The cookie is used to store the user consent for the cookies in the category "Performance".
viewed_cookie_policy
11 months
The cookie is set by the GDPR Cookie Consent plugin and is used to store whether or not user has consented to the use of cookies. It does not store any personal data.
Functional cookies help to perform certain functionalities like sharing the content of the website on social media platforms, collect feedbacks, and other third-party features.
Performance cookies are used to understand and analyze the key performance indexes of the website which helps in delivering a better user experience for the visitors.
Analytical cookies are used to understand how visitors interact with the website. These cookies help provide information on metrics the number of visitors, bounce rate, traffic source, etc.
Advertisement cookies are used to provide visitors with relevant ads and marketing campaigns. These cookies track visitors across websites and collect information to provide customized ads.


 The typical (median) renter submitted two applications — one online and one on paper/in person. For these rental applicants, the typical application fee was between $40 and $59. The typical number of applications and amount in fees that renters reported has not changed significantly between 2022 and 2018.


