Connect with us

Uncategorized

Overuse of social media and devices top parent concerns as kids head back to school

ANN ARBOR, Mich. –  As children head back to school, two issues have climbed higher on their parents’ list of concerns: the role of social media and…

Published

on

ANN ARBOR, Mich. –  As children head back to school, two issues have climbed higher on their parents’ list of concerns: the role of social media and the internet in kids’ lives.

Credit: University of Michigan Health C.S. Mott Children’s Hospital National Poll on Children’s Health.

ANN ARBOR, Mich. –  As children head back to school, two issues have climbed higher on their parents’ list of concerns: the role of social media and the internet in kids’ lives.

Over half of parents also rate mental health issues as leading health concerns for children and teens, according to the University of Michigan Health C.S. Mott Children’s Hospital National Poll on Children’s Health.

Overall, emotional health and technology use dominated this year’s top 10 list of parent concerns about health-related issues for kids in the U.S.– surpassing childhood obesity, which parents rated the number one children’s health issue a decade ago.

“Parents still view problems directly impacting physical health, including unhealthy eating and obesity, as important children’s health issues. But these have been overtaken by concerns about mental health, social media and screen time,” said Mott Poll co-director and Mott pediatrician Susan Woolford, M.D., M.P.H.

Two-thirds of parents are worried about children’s increased time on devices, including overall screen time and use of social media, taking the No.1 and No.2 spots on the list of children’s health concerns this year, according to the nationally representative poll.

“Children are using digital devices and social media at younger ages, and parents may struggle with how to appropriately monitor use to prevent negative impacts on safety, self-esteem, social connections and habits that may interfere with sleep and other areas of health,” Woolford said.

Screen time became a growing concern for parents during the pandemic, previous reports suggest. Woolford encourages parents to regularly evaluate their children’s use of technology and consider limiting use if they notice signs of unhealthy interactions or behaviors. Certain social media and device settings can also help protect kids.  

Mental, emotional health concerns top of mind

The poll findings, which are based on 2,099 responses collected in February, also demonstrate parents’ continued concern about children’s mental health. The majority of parents view depression, suicide, stress, anxiety, and related topics like bullying as big problems.

And nearly half of parents expressed concern with a lack of mental health services.

“The mismatch between the growing number of youth with mental health concerns and the limited access to mental health services has serious implications for children’s well-being,” Woolford said.

Parents also shared a high level of concern about school violence, which may reflect direct experience with school shootings or fights as well as media coverage about such events, Woolford says.

She adds that changes to the school environment, such as metal detectors, armed guards and locked doors, as well as active shooter drills may remind children and parents about the potential for school violence. Parents may struggle with how to manage their own stress and anxiety while they try to reassure their child.

“Parents may want to talk with their child periodically about how safe they feel at school and what they’ve heard about violent incidents,” Woolford said. “They should tailor the information to their child’s age and avoid sharing graphic details while offering reassurance about safety measures that their school has in place.”

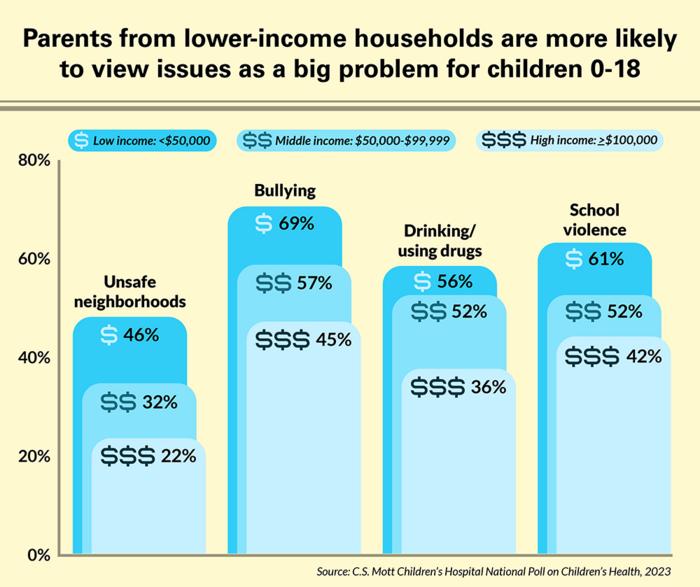
Parents in low-income households were more likely to view several children’s health issues as a major concern, including depression and suicide, bullying, school violence, unsafe neighborhoods, drinking and drugs, smoking and vaping, teen pregnancy and sexual activity, child abuse and neglect, parental stress, discrimination, COVID, and health risks from pollution.

Meanwhile, parents in middle and high-income homes are more likely to rate overuse of devices and social media as significant problems.

“Differences in how parents view children’s health problems may reflect their day-to-day experiences dealing with environmental challenges such as unsafe neighborhoods, as well as discrimination that may be more frequently experienced by children from low-income homes,” Woolford said.

Concern about a greater number of child health issues may be reflected in this group’s higher reports of parental stress as a big problem, Woolford adds.

But parents across income groups rated other topics similarly, including unhealthy diet, obesity, healthcare costs, and lack of mental health services.

Falling just outside the top 10 children’s health concerns are obesity (48%), guns/gun injuries (47%), lack of mental health services (47%), poverty (45%), drinking/using drugs (44%), child abuse/neglect (42%), followed by unequal access to health care (35%), parental stress (35%), inaccurate/misleading health information (31%), teen pregnancy/sexual activity (31%), discrimination (31%), unsafe neighborhoods (30%), gay/gender issues (LGBTQ) (29%), and health risks from polluted water and air (23%).

At the bottom of the list: safety of vaccines (16%), over-involved parents/parents doing too much (13%) and COVID (12%).

“Today’s school aged children have experienced dramatic shifts in classroom environments, technology norms and increased mental health challenges,” Woolford said.

“Parents should partner with schools, mentors and their child’s health care providers to address both ongoing and emerging health concerns. They should also regularly revisit conversations with their children and teens that encourage them to share any concerns they might be experiencing, both physically and emotionally.”


Read More

Continue Reading

Uncategorized

Homes listed for sale in early June sell for $7,700 more

New Zillow research suggests the spring home shopping season may see a second wave this summer if mortgage rates fall
The post Homes listed for sale in…

Published

on

  • A Zillow analysis of 2023 home sales finds homes listed in the first two weeks of June sold for 2.3% more. 
  • The best time to list a home for sale is a month later than it was in 2019, likely driven by mortgage rates.
  • The best time to list can be as early as the second half of February in San Francisco, and as late as the first half of July in New York and Philadelphia. 

Spring home sellers looking to maximize their sale price may want to wait it out and list their home for sale in the first half of June. A new Zillow® analysis of 2023 sales found that homes listed in the first two weeks of June sold for 2.3% more, a $7,700 boost on a typical U.S. home.  

The best time to list consistently had been early May in the years leading up to the pandemic. The shift to June suggests mortgage rates are strongly influencing demand on top of the usual seasonality that brings buyers to the market in the spring. This home-shopping season is poised to follow a similar pattern as that in 2023, with the potential for a second wave if the Federal Reserve lowers interest rates midyear or later. 

The 2.3% sale price premium registered last June followed the first spring in more than 15 years with mortgage rates over 6% on a 30-year fixed-rate loan. The high rates put home buyers on the back foot, and as rates continued upward through May, they were still reassessing and less likely to bid boldly. In June, however, rates pulled back a little from 6.79% to 6.67%, which likely presented an opportunity for determined buyers heading into summer. More buyers understood their market position and could afford to transact, boosting competition and sale prices.

The old logic was that sellers could earn a premium by listing in late spring, when search activity hit its peak. Now, with persistently low inventory, mortgage rate fluctuations make their own seasonality. First-time home buyers who are on the edge of qualifying for a home loan may dip in and out of the market, depending on what’s happening with rates. It is almost certain the Federal Reserve will push back any interest-rate cuts to mid-2024 at the earliest. If mortgage rates follow, that could bring another surge of buyers later this year.

Mortgage rates have been impacting affordability and sale prices since they began rising rapidly two years ago. In 2022, sellers nationwide saw the highest sale premium when they listed their home in late March, right before rates barreled past 5% and continued climbing. 

Zillow’s research finds the best time to list can vary widely by metropolitan area. In 2023, it was as early as the second half of February in San Francisco, and as late as the first half of July in New York. Thirty of the top 35 largest metro areas saw for-sale listings command the highest sale prices between May and early July last year. 

Zillow also found a wide range in the sale price premiums associated with homes listed during those peak periods. At the hottest time of the year in San Jose, homes sold for 5.5% more, a $88,000 boost on a typical home. Meanwhile, homes in San Antonio sold for 1.9% more during that same time period.  


Metropolitan Area Best Time to List Price Premium Dollar Boost
United States First half of June 2.3% $7,700
New York, NY First half of July 2.4% $15,500
Los Angeles, CA First half of May 4.1% $39,300
Chicago, IL First half of June 2.8% $8,800
Dallas, TX First half of June 2.5% $9,200
Houston, TX Second half of April 2.0% $6,200
Washington, DC Second half of June 2.2% $12,700
Philadelphia, PA First half of July 2.4% $8,200
Miami, FL First half of June 2.3% $12,900
Atlanta, GA Second half of June 2.3% $8,700
Boston, MA Second half of May 3.5% $23,600
Phoenix, AZ First half of June 3.2% $14,700
San Francisco, CA Second half of February 4.2% $50,300
Riverside, CA First half of May 2.7% $15,600
Detroit, MI First half of July 3.3% $7,900
Seattle, WA First half of June 4.3% $31,500
Minneapolis, MN Second half of May 3.7% $13,400
San Diego, CA Second half of April 3.1% $29,600
Tampa, FL Second half of June 2.1% $8,000
Denver, CO Second half of May 2.9% $16,900
Baltimore, MD First half of July 2.2% $8,200
St. Louis, MO First half of June 2.9% $7,000
Orlando, FL First half of June 2.2% $8,700
Charlotte, NC Second half of May 3.0% $11,000
San Antonio, TX First half of June 1.9% $5,400
Portland, OR Second half of April 2.6% $14,300
Sacramento, CA First half of June 3.2% $17,900
Pittsburgh, PA Second half of June 2.3% $4,700
Cincinnati, OH Second half of April 2.7% $7,500
Austin, TX Second half of May 2.8% $12,600
Las Vegas, NV First half of June 3.4% $14,600
Kansas City, MO Second half of May 2.5% $7,300
Columbus, OH Second half of June 3.3% $10,400
Indianapolis, IN First half of July 3.0% $8,100
Cleveland, OH First half of July  3.4% $7,400
San Jose, CA First half of June 5.5% $88,400


The post Homes listed for sale in early June sell for $7,700 more appeared first on Zillow Research.

Read More

Continue Reading

Uncategorized

February Employment Situation

By Paul Gomme and Peter Rupert The establishment data from the BLS showed a 275,000 increase in payroll employment for February, outpacing the 230,000…

Published

on

By Paul Gomme and Peter Rupert

The establishment data from the BLS showed a 275,000 increase in payroll employment for February, outpacing the 230,000 average over the previous 12 months. The payroll data for January and December were revised down by a total of 167,000. The private sector added 223,000 new jobs, the largest gain since May of last year.

Temporary help services employment continues a steep decline after a sharp post-pandemic rise.

Average hours of work increased from 34.2 to 34.3. The increase, along with the 223,000 private employment increase led to a hefty increase in total hours of 5.6% at an annualized rate, also the largest increase since May of last year.

The establishment report, once again, beat “expectations;” the WSJ survey of economists was 198,000. Other than the downward revisions, mentioned above, another bit of negative news was a smallish increase in wage growth, from $34.52 to $34.57.

The household survey shows that the labor force increased 150,000, a drop in employment of 184,000 and an increase in the number of unemployed persons of 334,000. The labor force participation rate held steady at 62.5, the employment to population ratio decreased from 60.2 to 60.1 and the unemployment rate increased from 3.66 to 3.86. Remember that the unemployment rate is the number of unemployed relative to the labor force (the number employed plus the number unemployed). Consequently, the unemployment rate can go up if the number of unemployed rises holding fixed the labor force, or if the labor force shrinks holding the number unemployed unchanged. An increase in the unemployment rate is not necessarily a bad thing: it may reflect a strong labor market drawing “marginally attached” individuals from outside the labor force. Indeed, there was a 96,000 decline in those workers.

Earlier in the week, the BLS announced JOLTS (Job Openings and Labor Turnover Survey) data for January. There isn’t much to report here as the job openings changed little at 8.9 million, the number of hires and total separations were little changed at 5.7 million and 5.3 million, respectively.

As has been the case for the last couple of years, the number of job openings remains higher than the number of unemployed persons.

Also earlier in the week the BLS announced that productivity increased 3.2% in the 4th quarter with output rising 3.5% and hours of work rising 0.3%.

The bottom line is that the labor market continues its surprisingly (to some) strong performance, once again proving stronger than many had expected. This strength makes it difficult to justify any interest rate cuts soon, particularly given the recent inflation spike.

Read More

Continue Reading

Uncategorized

Mortgage rates fall as labor market normalizes

Jobless claims show an expanding economy. We will only be in a recession once jobless claims exceed 323,000 on a four-week moving average.

Published

on

Everyone was waiting to see if this week’s jobs report would send mortgage rates higher, which is what happened last month. Instead, the 10-year yield had a muted response after the headline number beat estimates, but we have negative job revisions from previous months. The Federal Reserve’s fear of wage growth spiraling out of control hasn’t materialized for over two years now and the unemployment rate ticked up to 3.9%. For now, we can say the labor market isn’t tight anymore, but it’s also not breaking.

The key labor data line in this expansion is the weekly jobless claims report. Jobless claims show an expanding economy that has not lost jobs yet. We will only be in a recession once jobless claims exceed 323,000 on a four-week moving average.

From the Fed: In the week ended March 2, initial claims for unemployment insurance benefits were flat, at 217,000. The four-week moving average declined slightly by 750, to 212,250


Below is an explanation of how we got here with the labor market, which all started during COVID-19.

1. I wrote the COVID-19 recovery model on April 7, 2020, and retired it on Dec. 9, 2020. By that time, the upfront recovery phase was done, and I needed to model out when we would get the jobs lost back.

2. Early in the labor market recovery, when we saw weaker job reports, I doubled and tripled down on my assertion that job openings would get to 10 million in this recovery. Job openings rose as high as to 12 million and are currently over 9 million. Even with the massive miss on a job report in May 2021, I didn’t waver.

Currently, the jobs openings, quit percentage and hires data are below pre-COVID-19 levels, which means the labor market isn’t as tight as it once was, and this is why the employment cost index has been slowing data to move along the quits percentage.  

2-US_Job_Quits_Rate-1-2

3. I wrote that we should get back all the jobs lost to COVID-19 by September of 2022. At the time this would be a speedy labor market recovery, and it happened on schedule, too

Total employment data

4. This is the key one for right now: If COVID-19 hadn’t happened, we would have between 157 million and 159 million jobs today, which would have been in line with the job growth rate in February 2020. Today, we are at 157,808,000. This is important because job growth should be cooling down now. We are more in line with where the labor market should be when averaging 140K-165K monthly. So for now, the fact that we aren’t trending between 140K-165K means we still have a bit more recovery kick left before we get down to those levels. 


From BLS: Total nonfarm payroll employment rose by 275,000 in February, and the unemployment rate increased to 3.9 percent, the U.S. Bureau of Labor Statistics reported today. Job gains occurred in health care, in government, in food services and drinking places, in social assistance, and in transportation and warehousing.

Here are the jobs that were created and lost in the previous month:

IMG_5092

In this jobs report, the unemployment rate for education levels looks like this:

  • Less than a high school diploma: 6.1%
  • High school graduate and no college: 4.2%
  • Some college or associate degree: 3.1%
  • Bachelor’s degree or higher: 2.2%
IMG_5093_320f22

Today’s report has continued the trend of the labor data beating my expectations, only because I am looking for the jobs data to slow down to a level of 140K-165K, which hasn’t happened yet. I wouldn’t categorize the labor market as being tight anymore because of the quits ratio and the hires data in the job openings report. This also shows itself in the employment cost index as well. These are key data lines for the Fed and the reason we are going to see three rate cuts this year.

Read More

Continue Reading

Trending